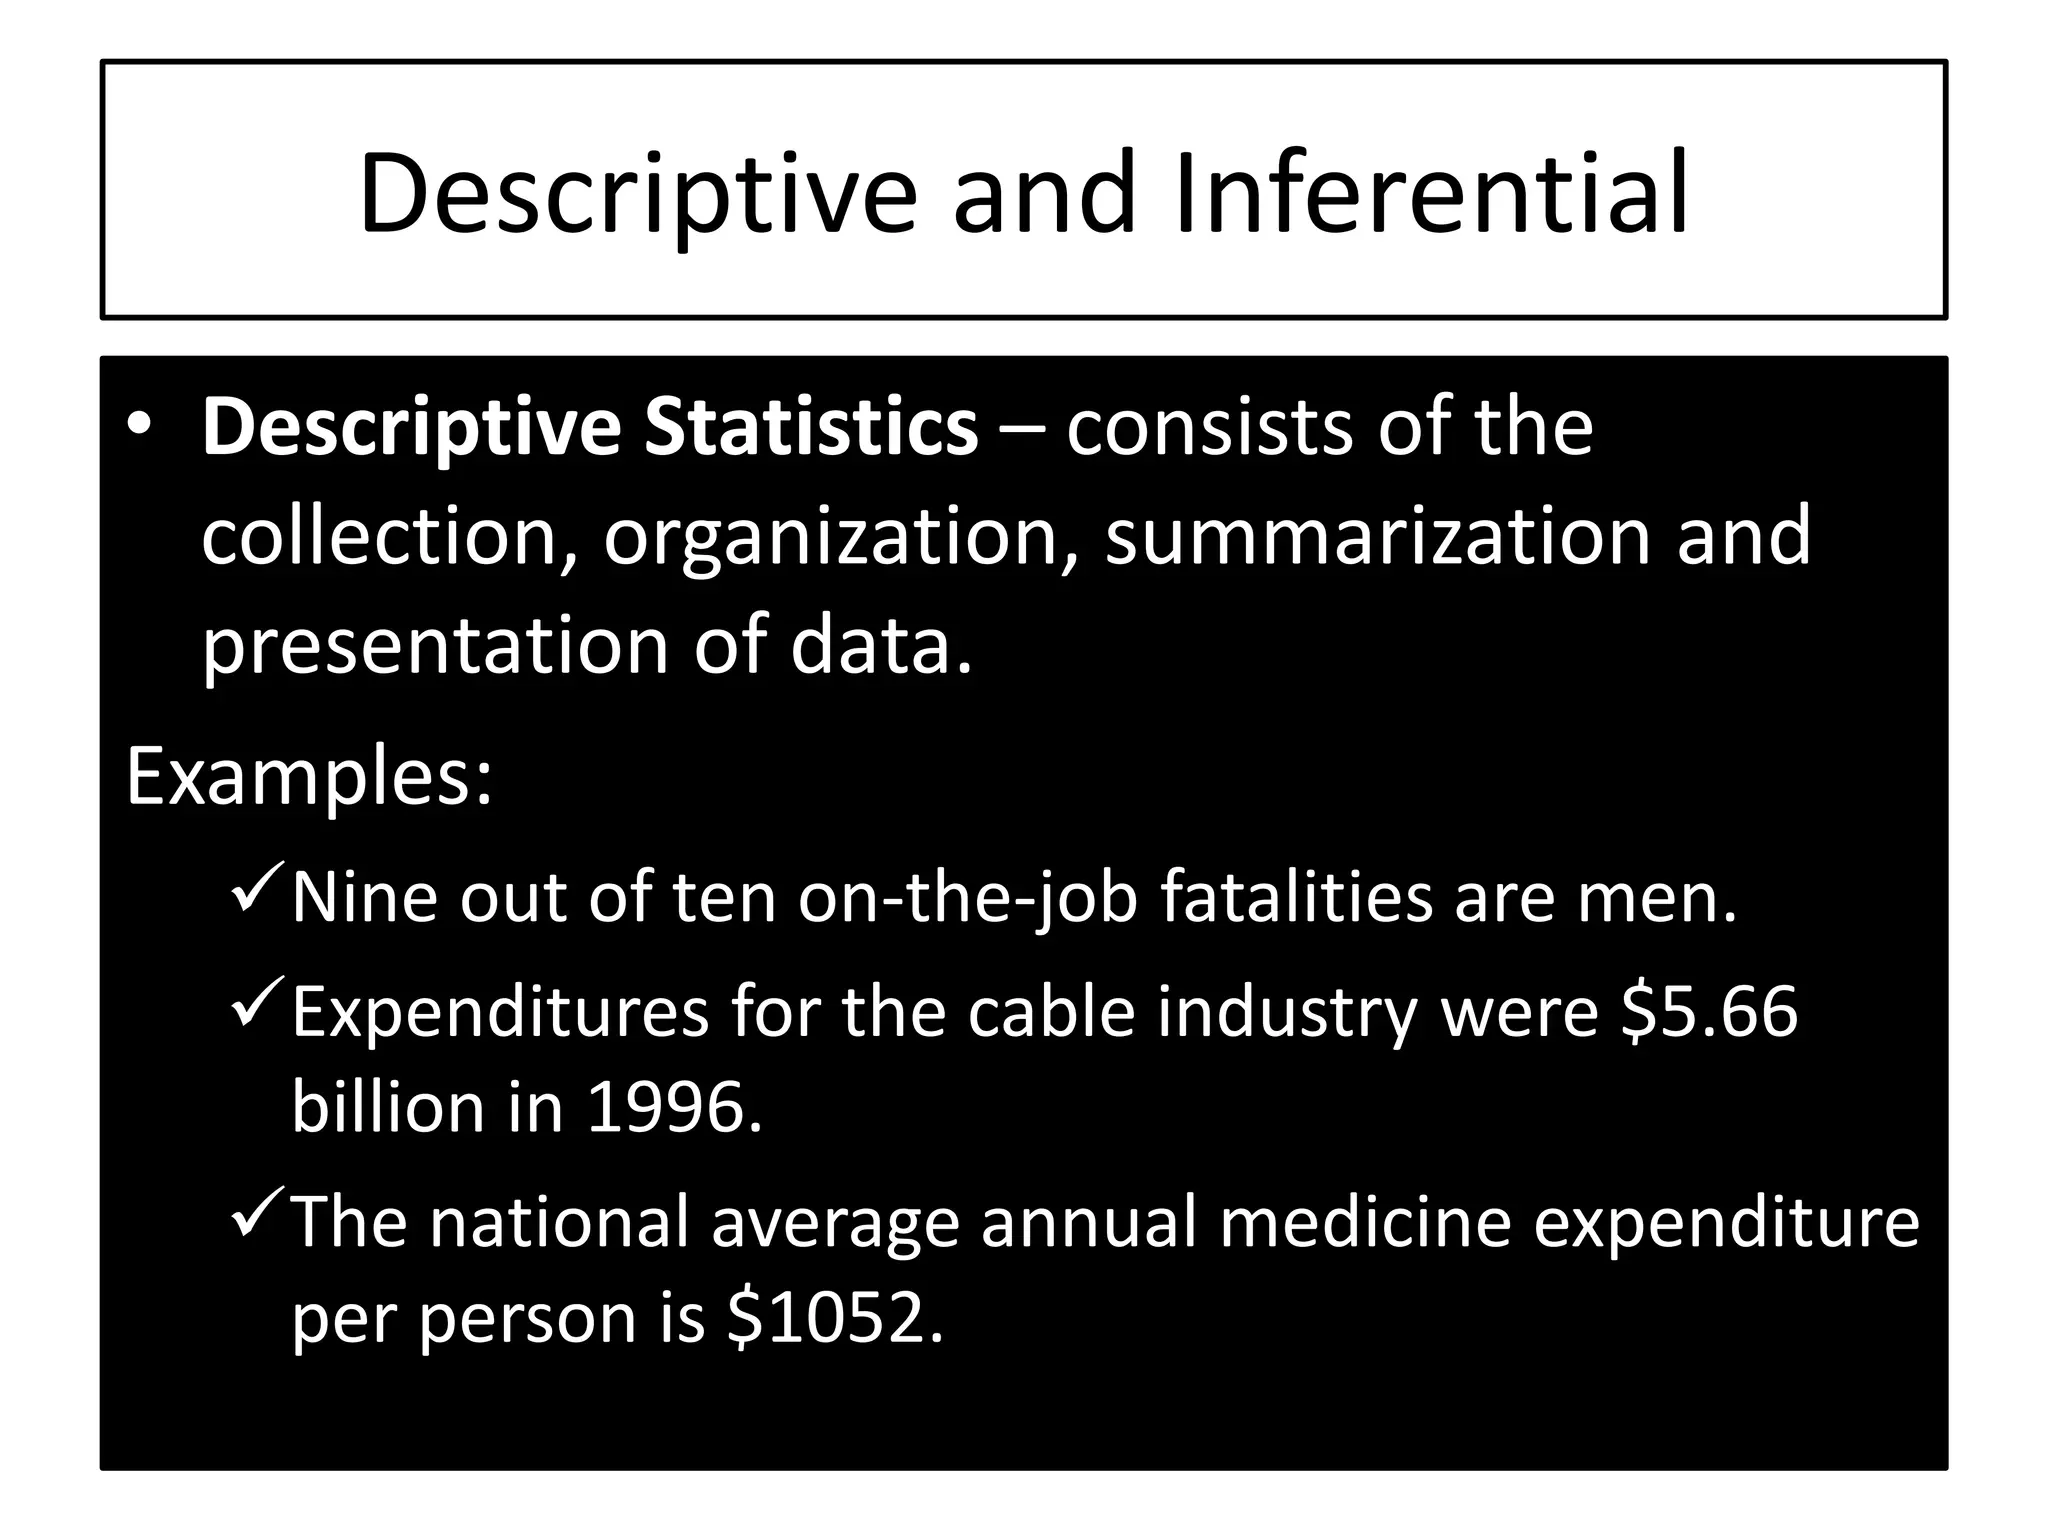
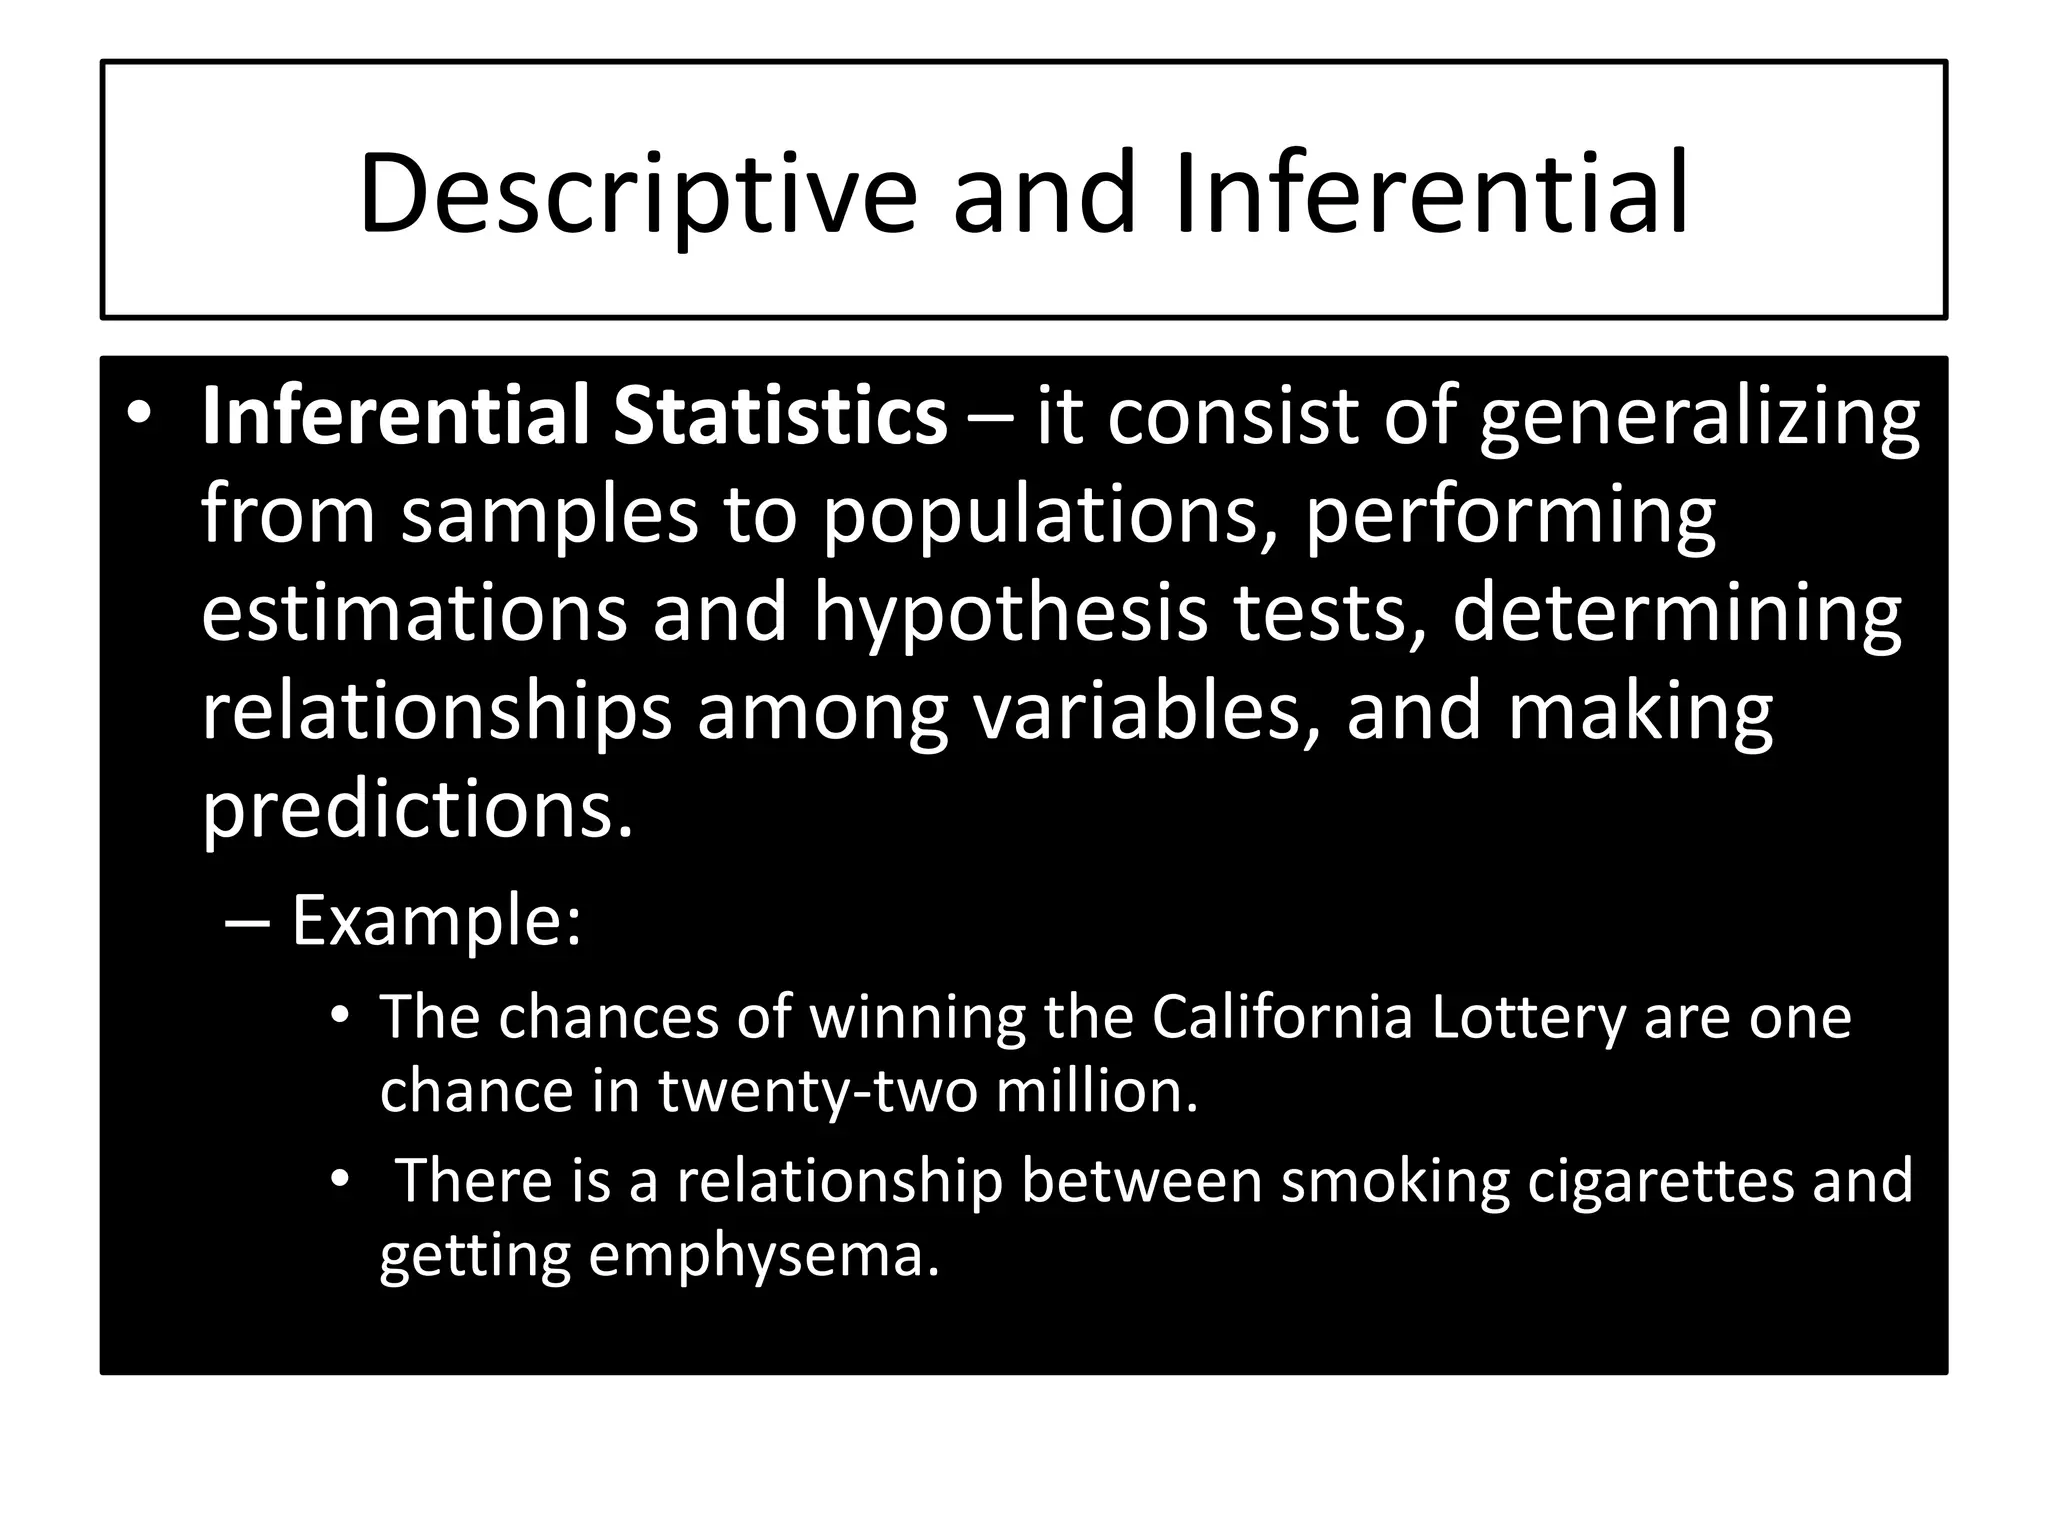
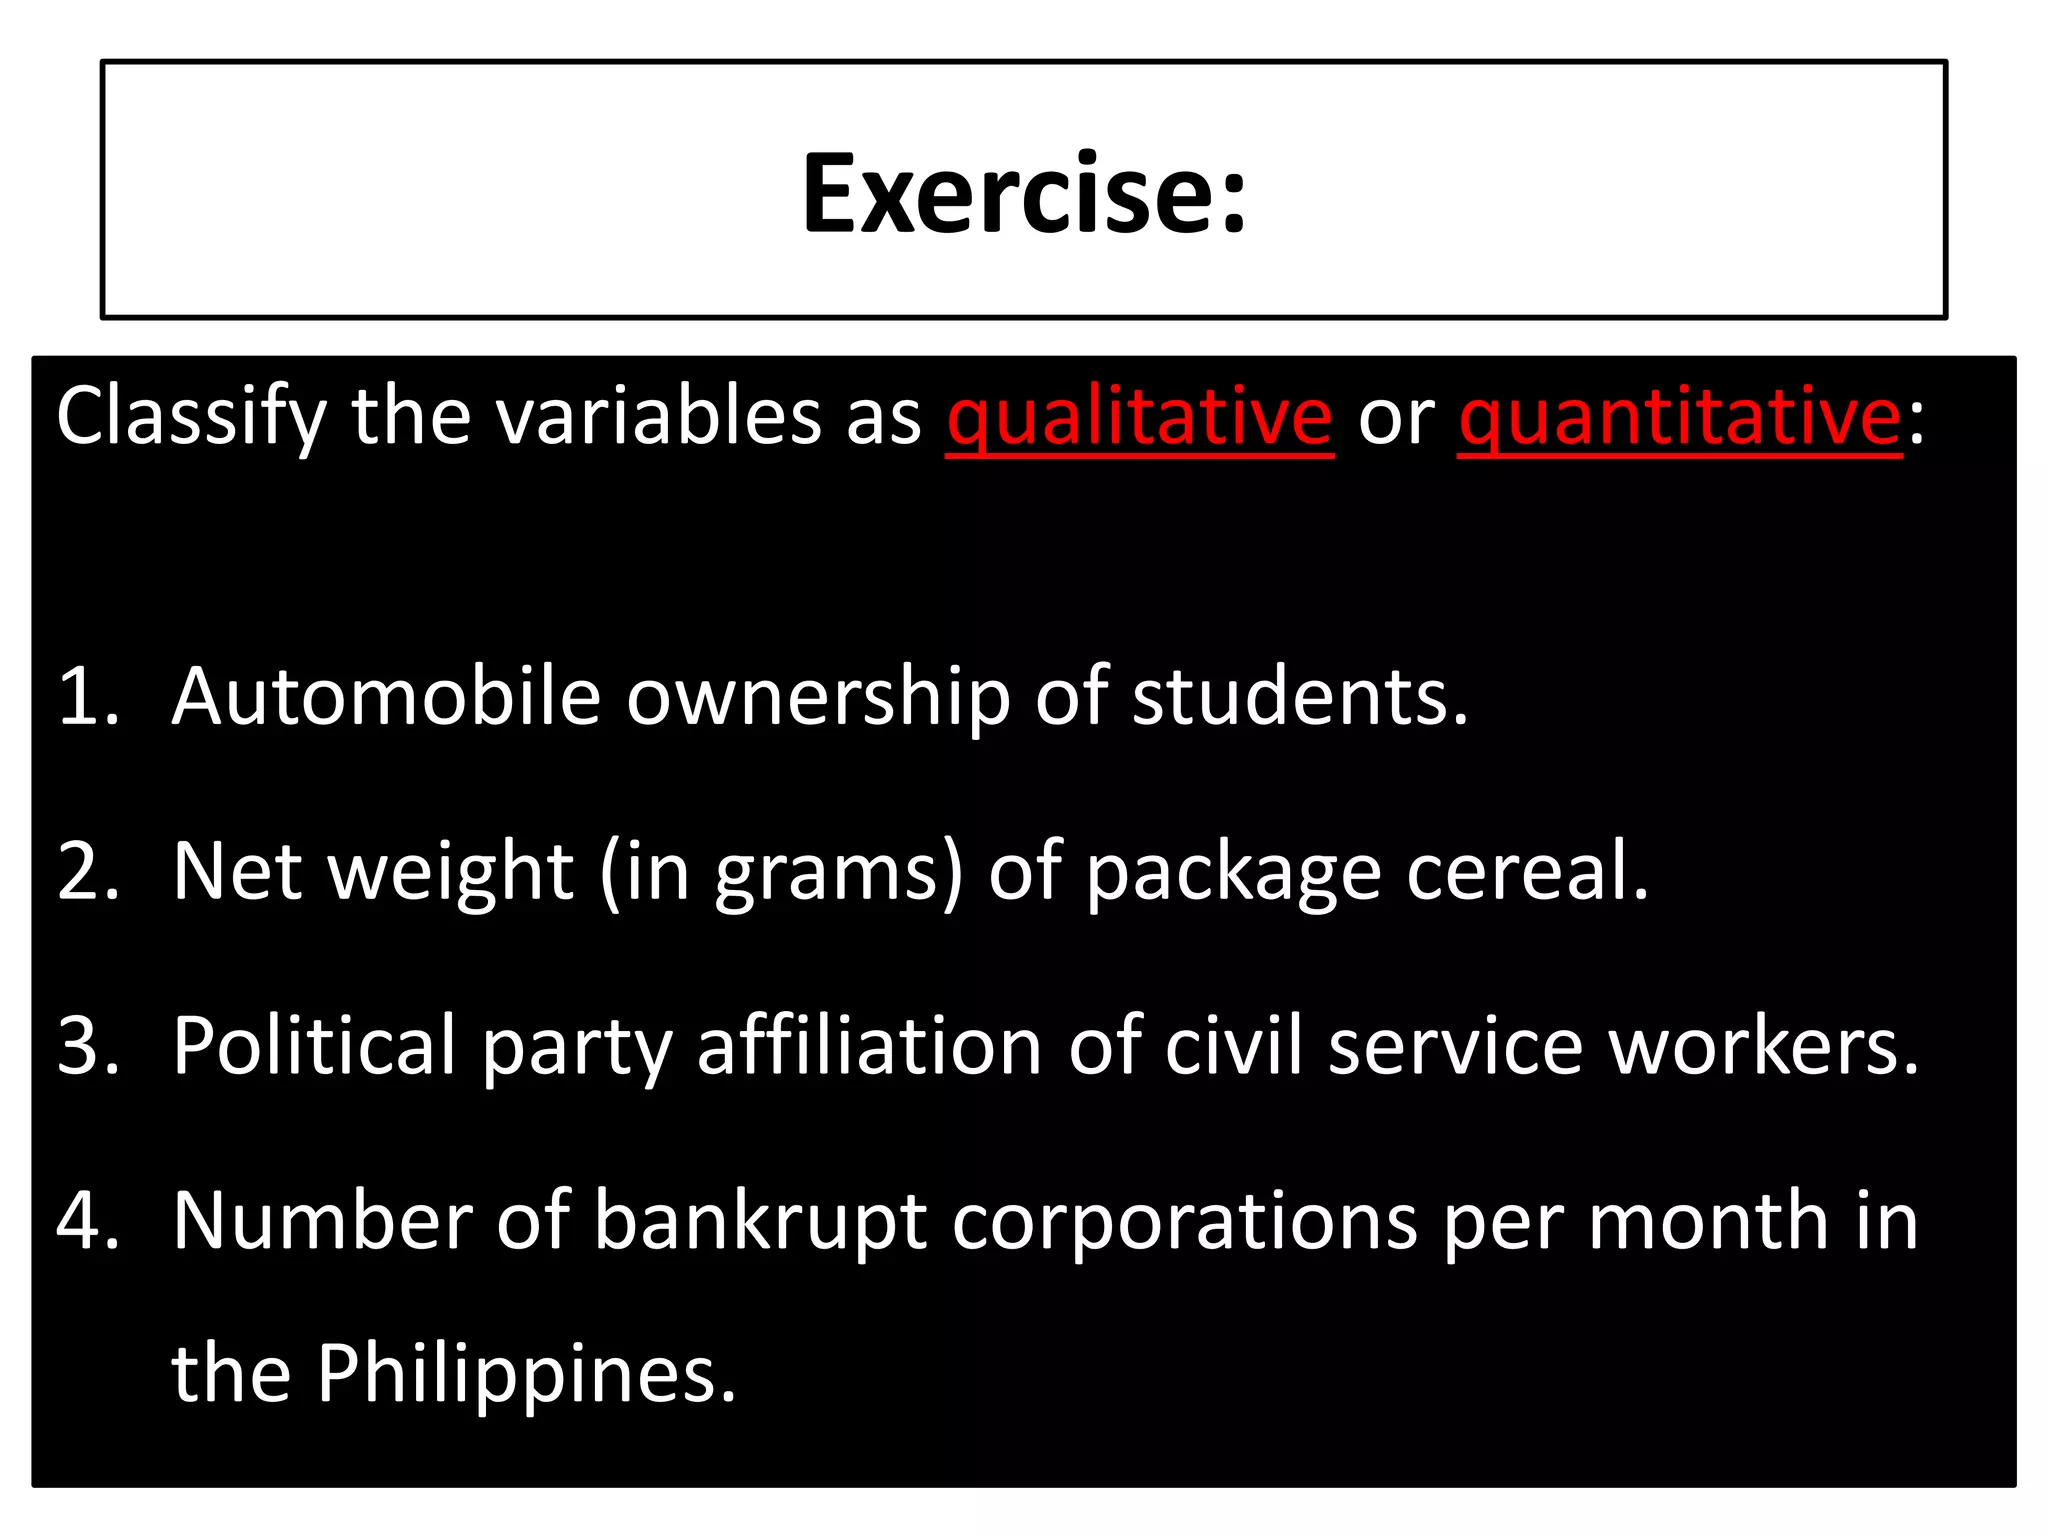
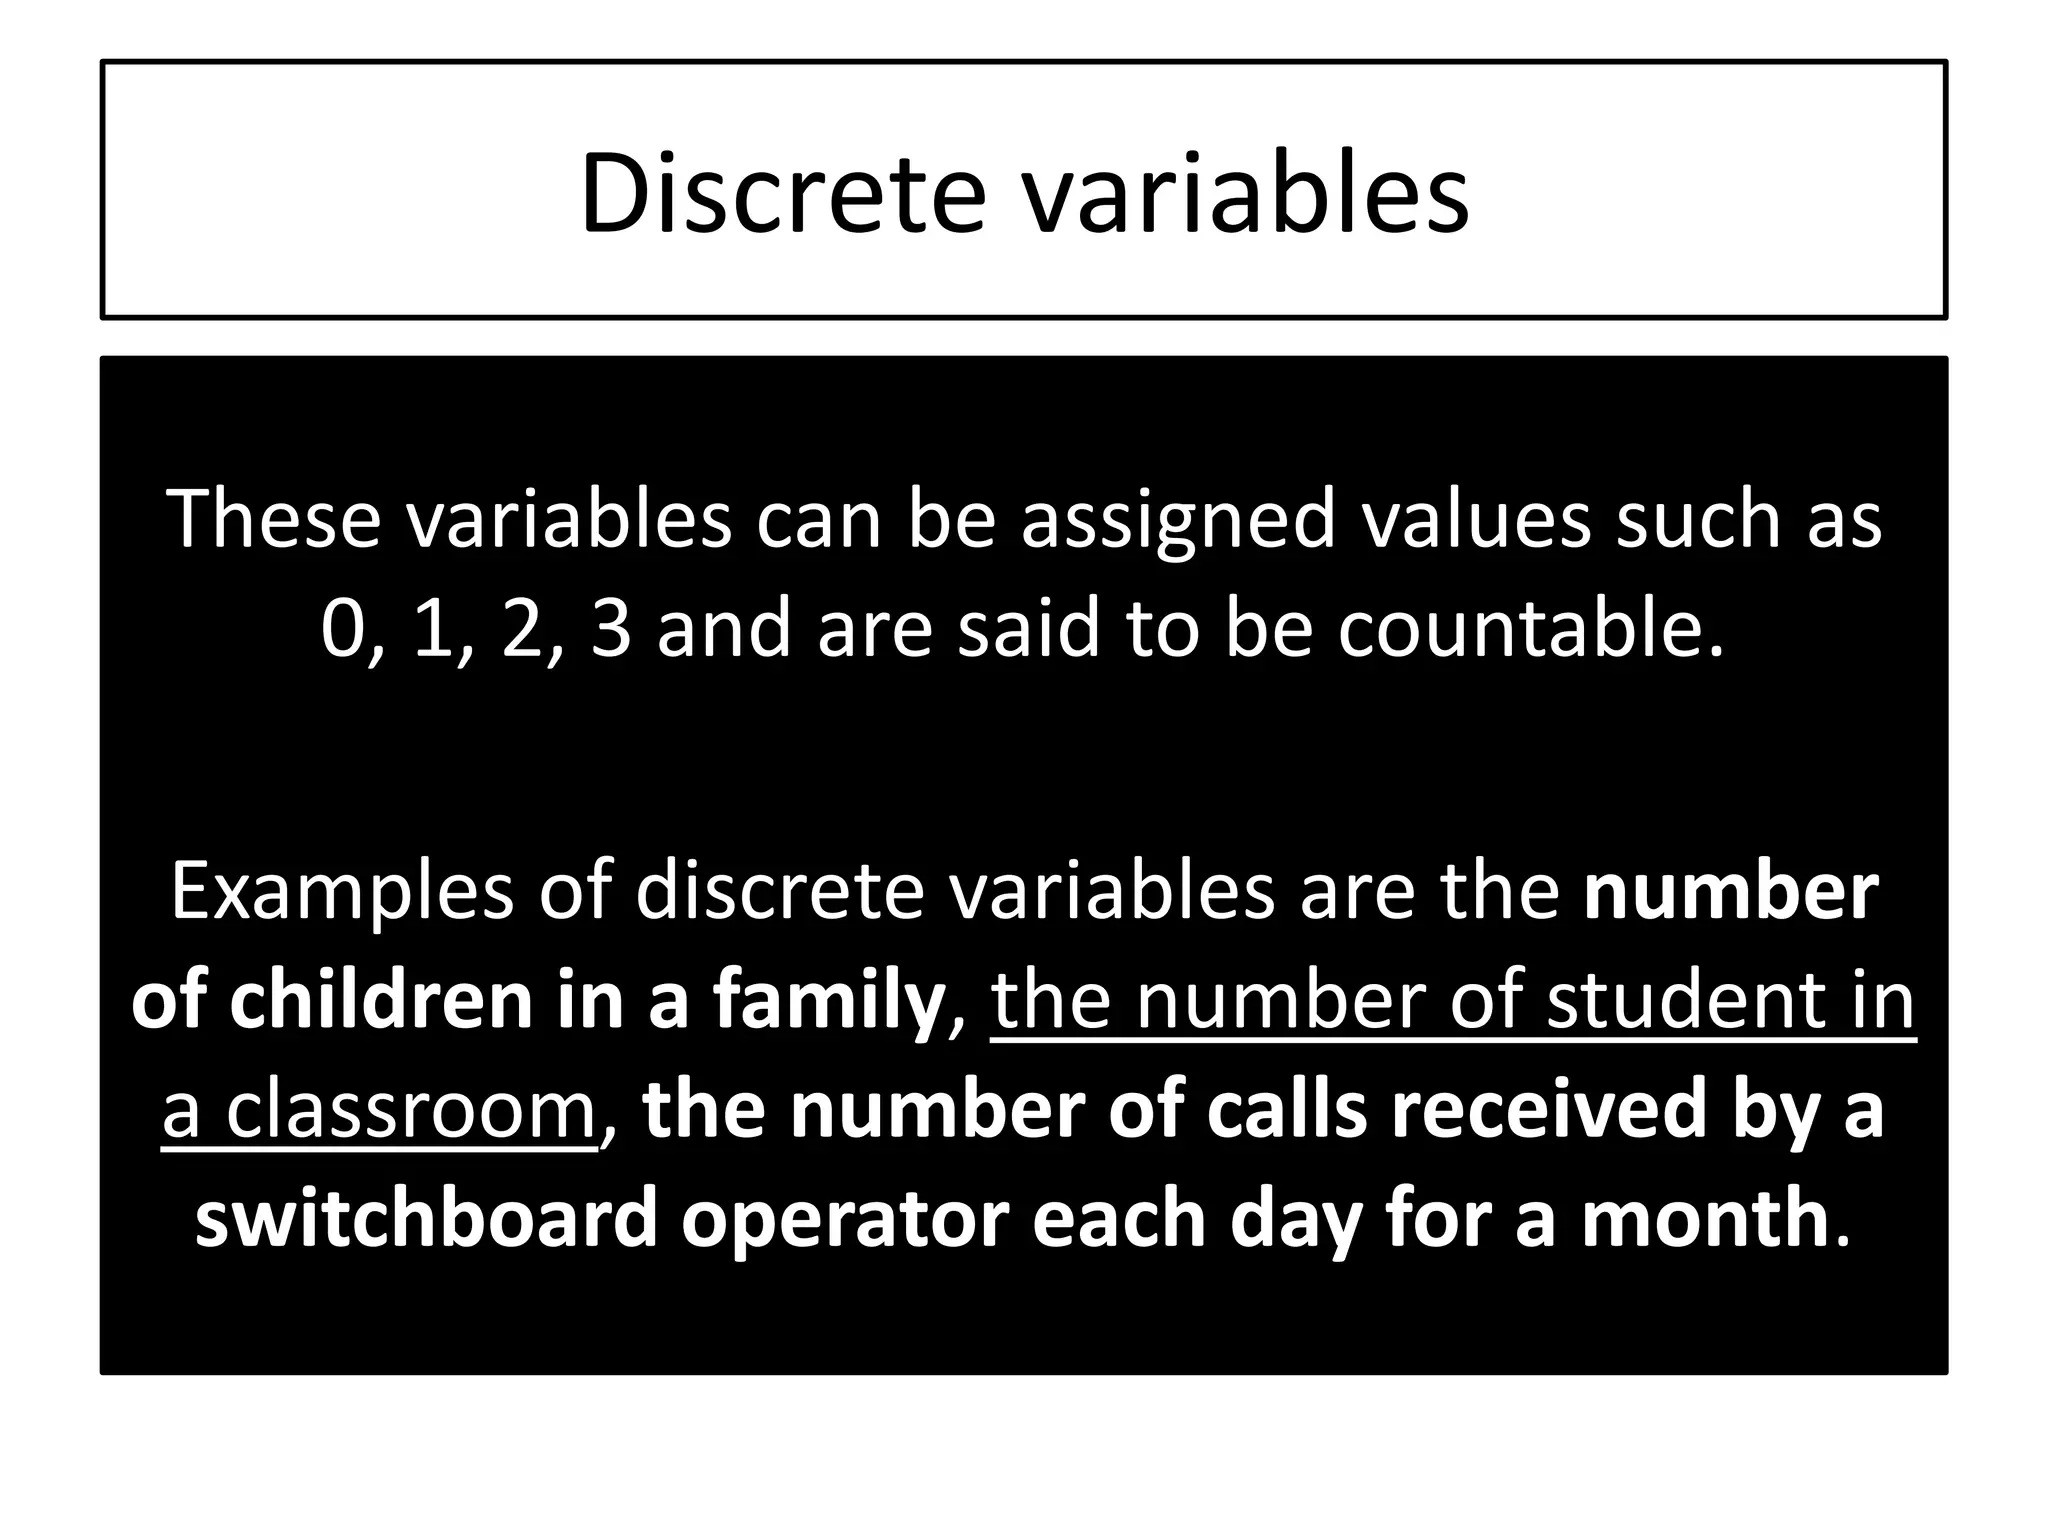
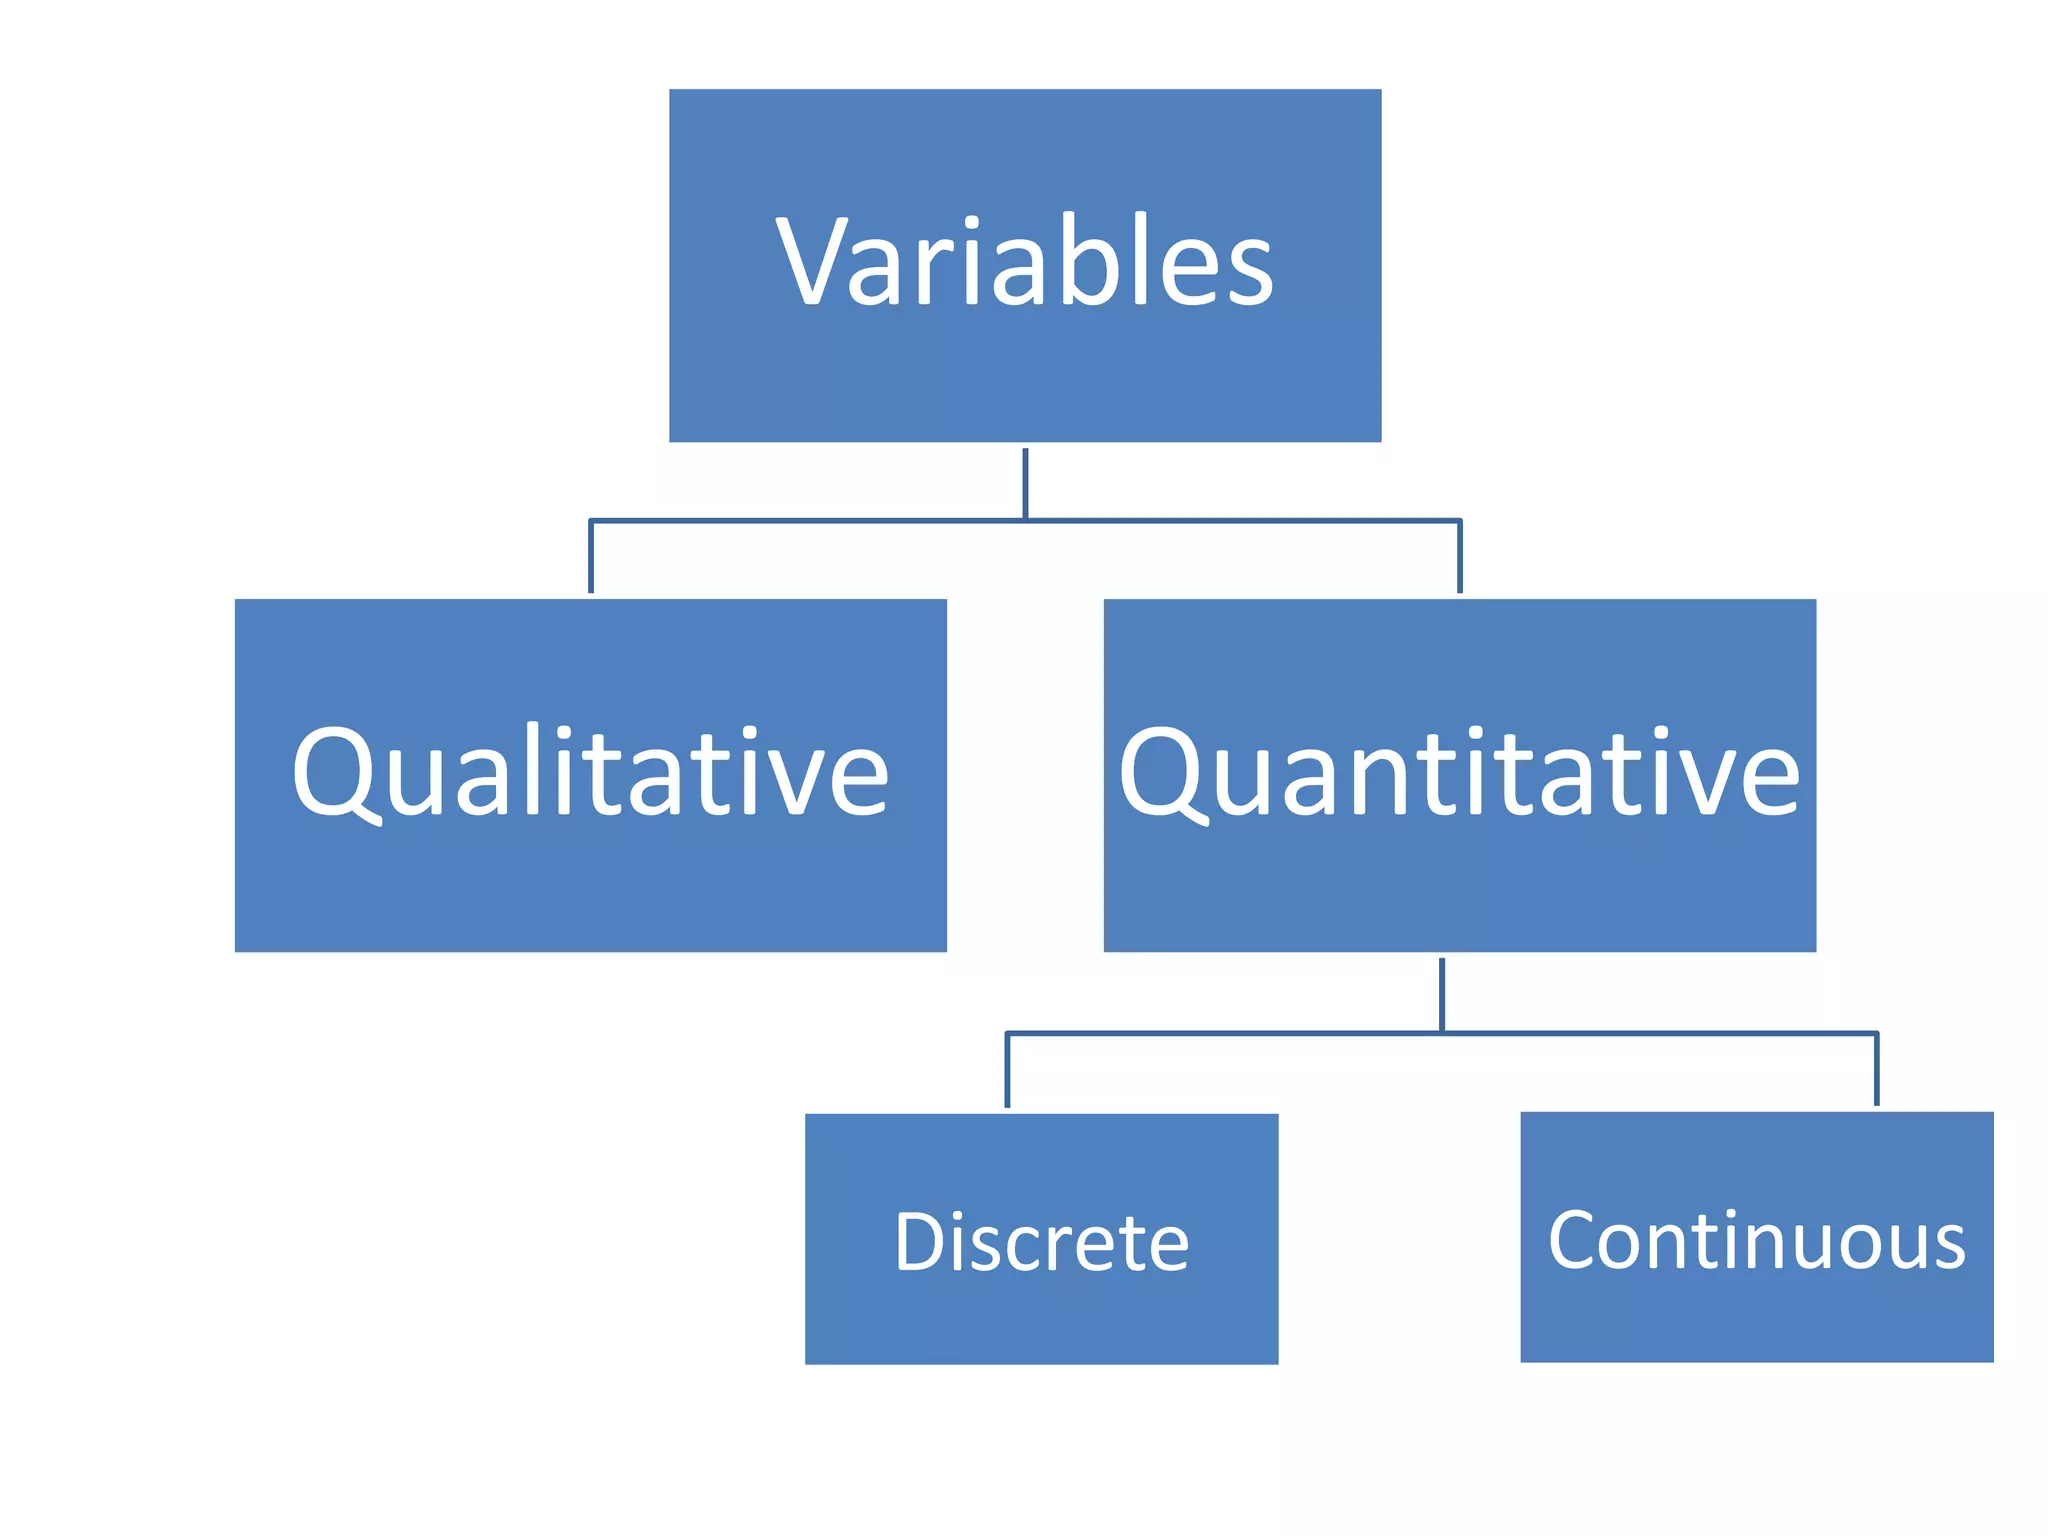
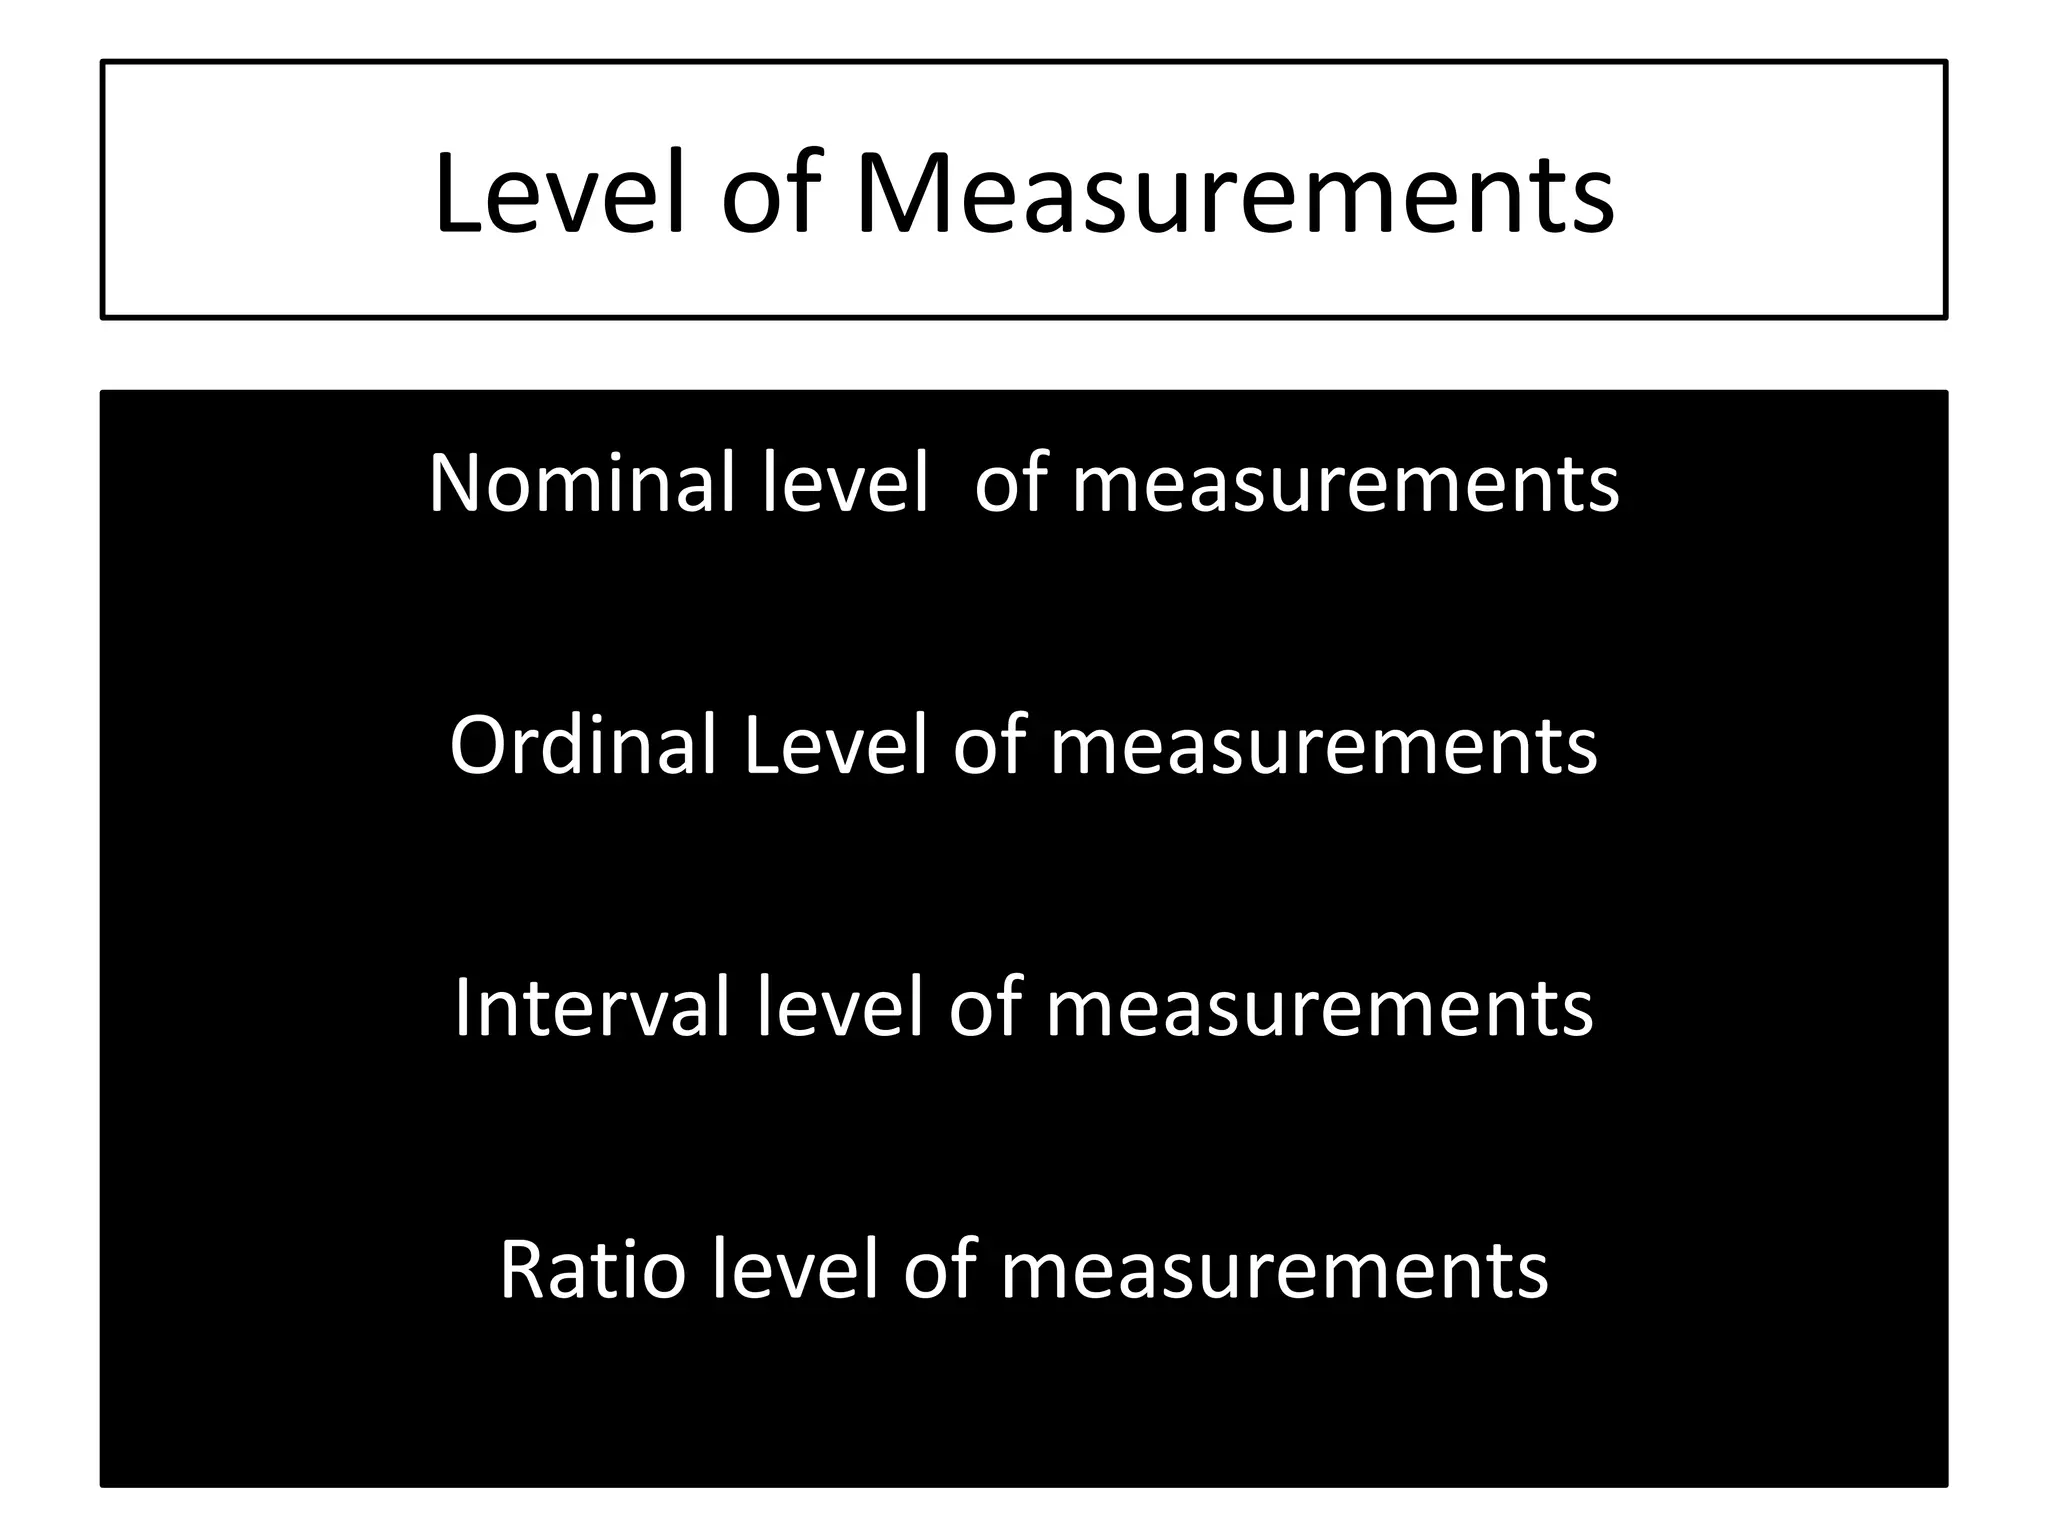
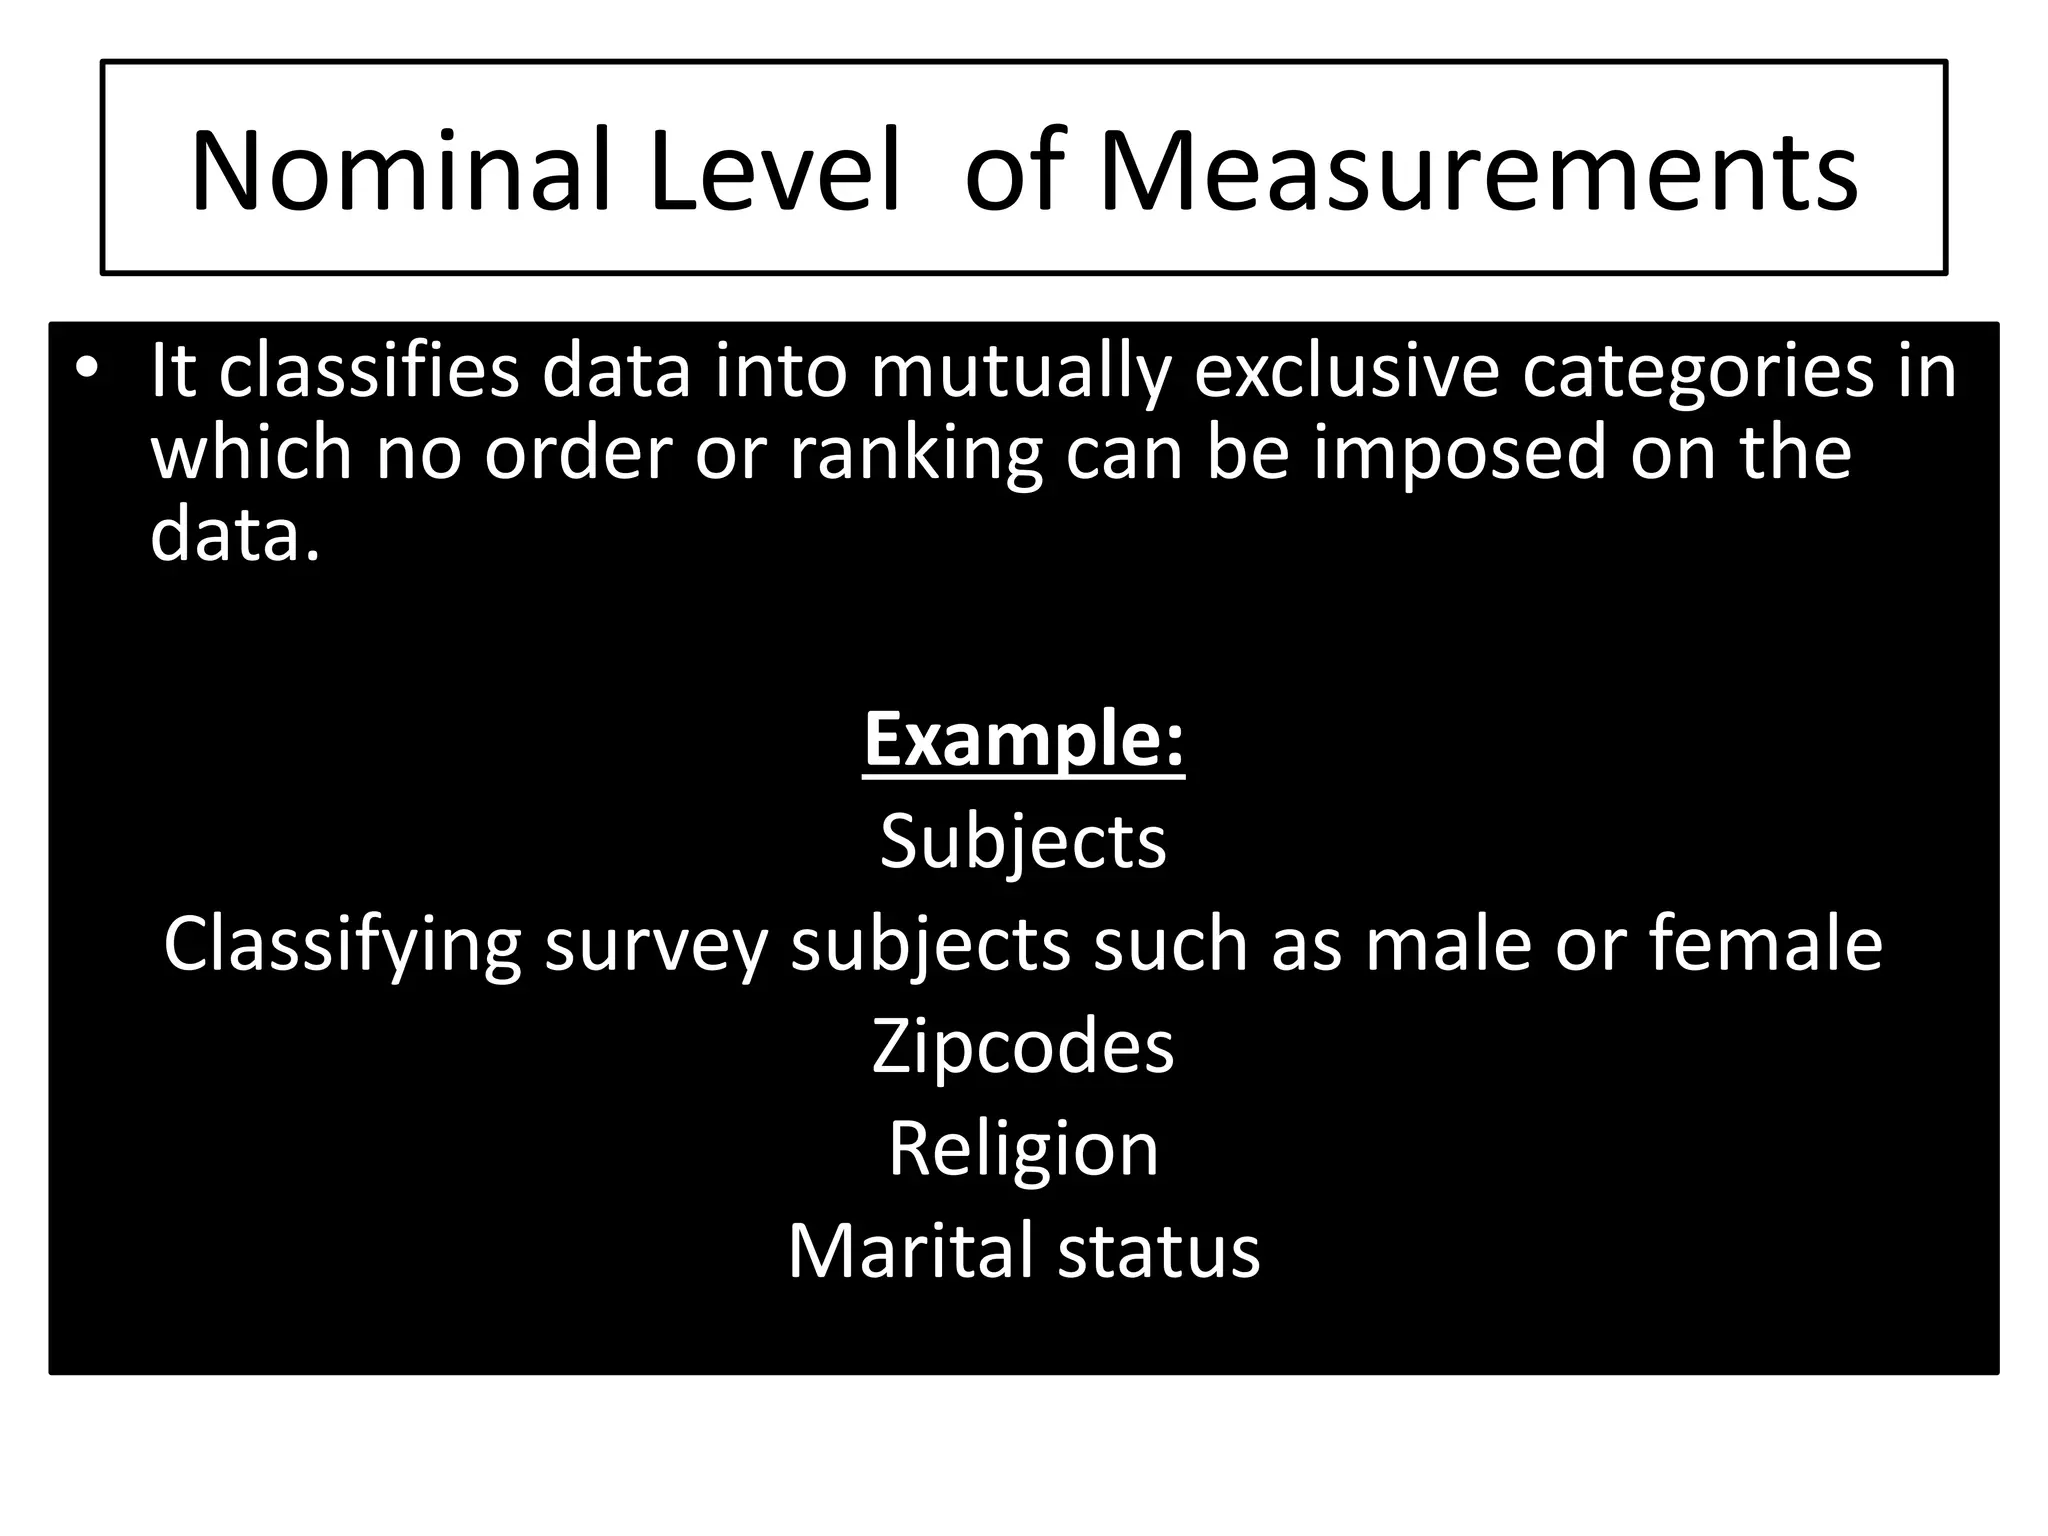
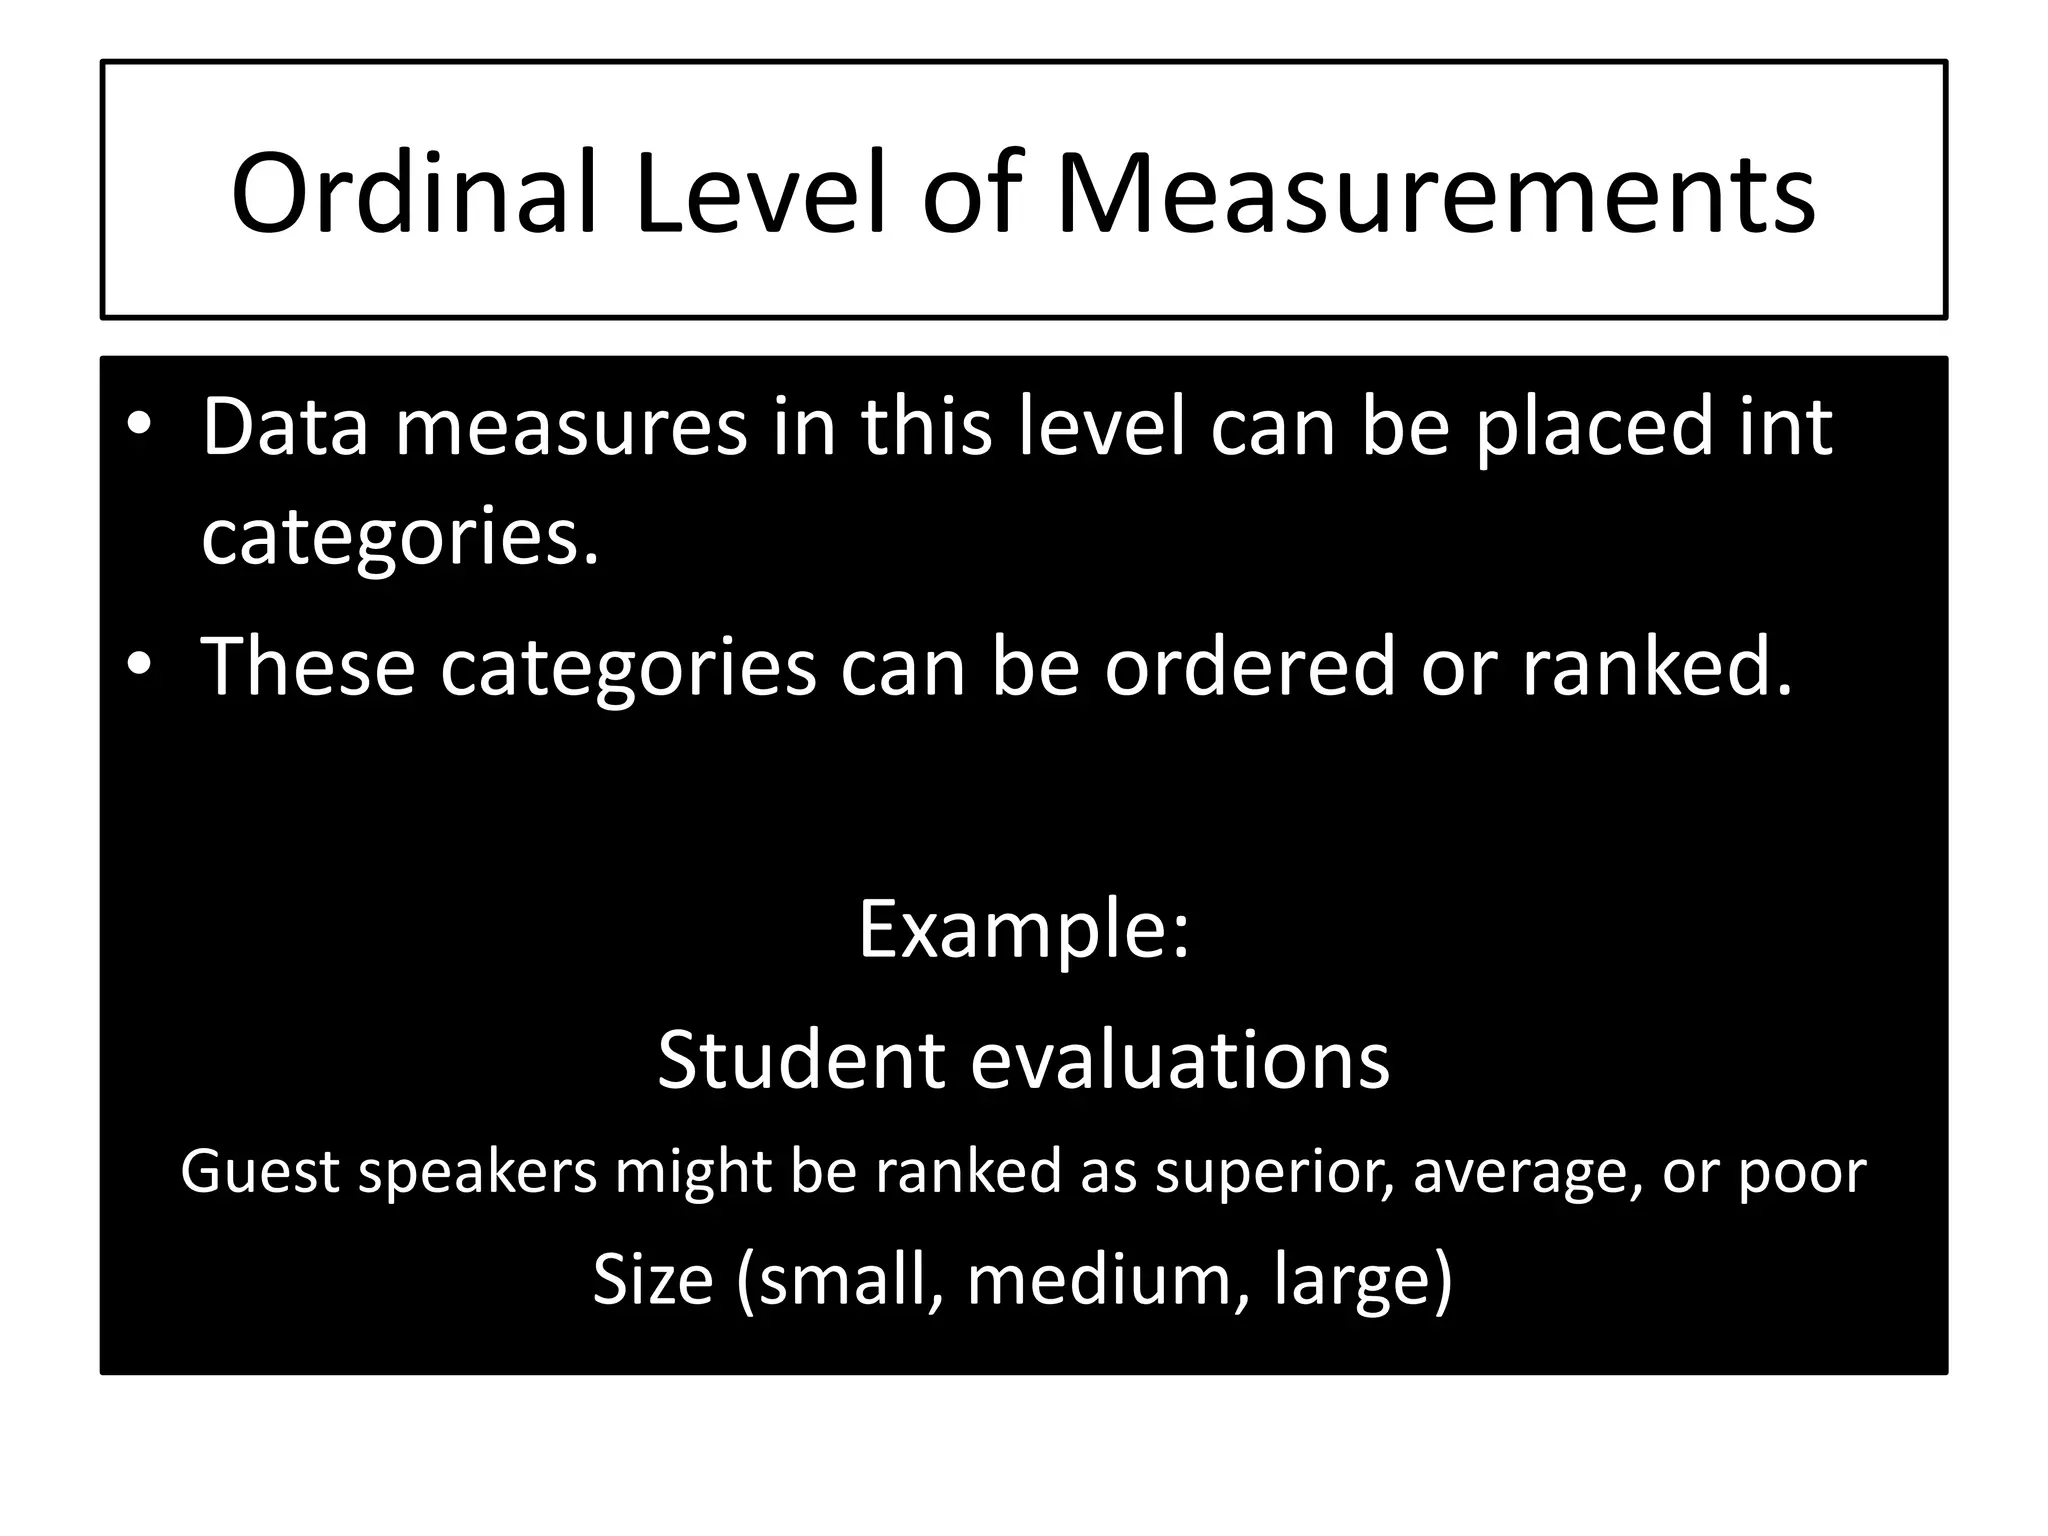
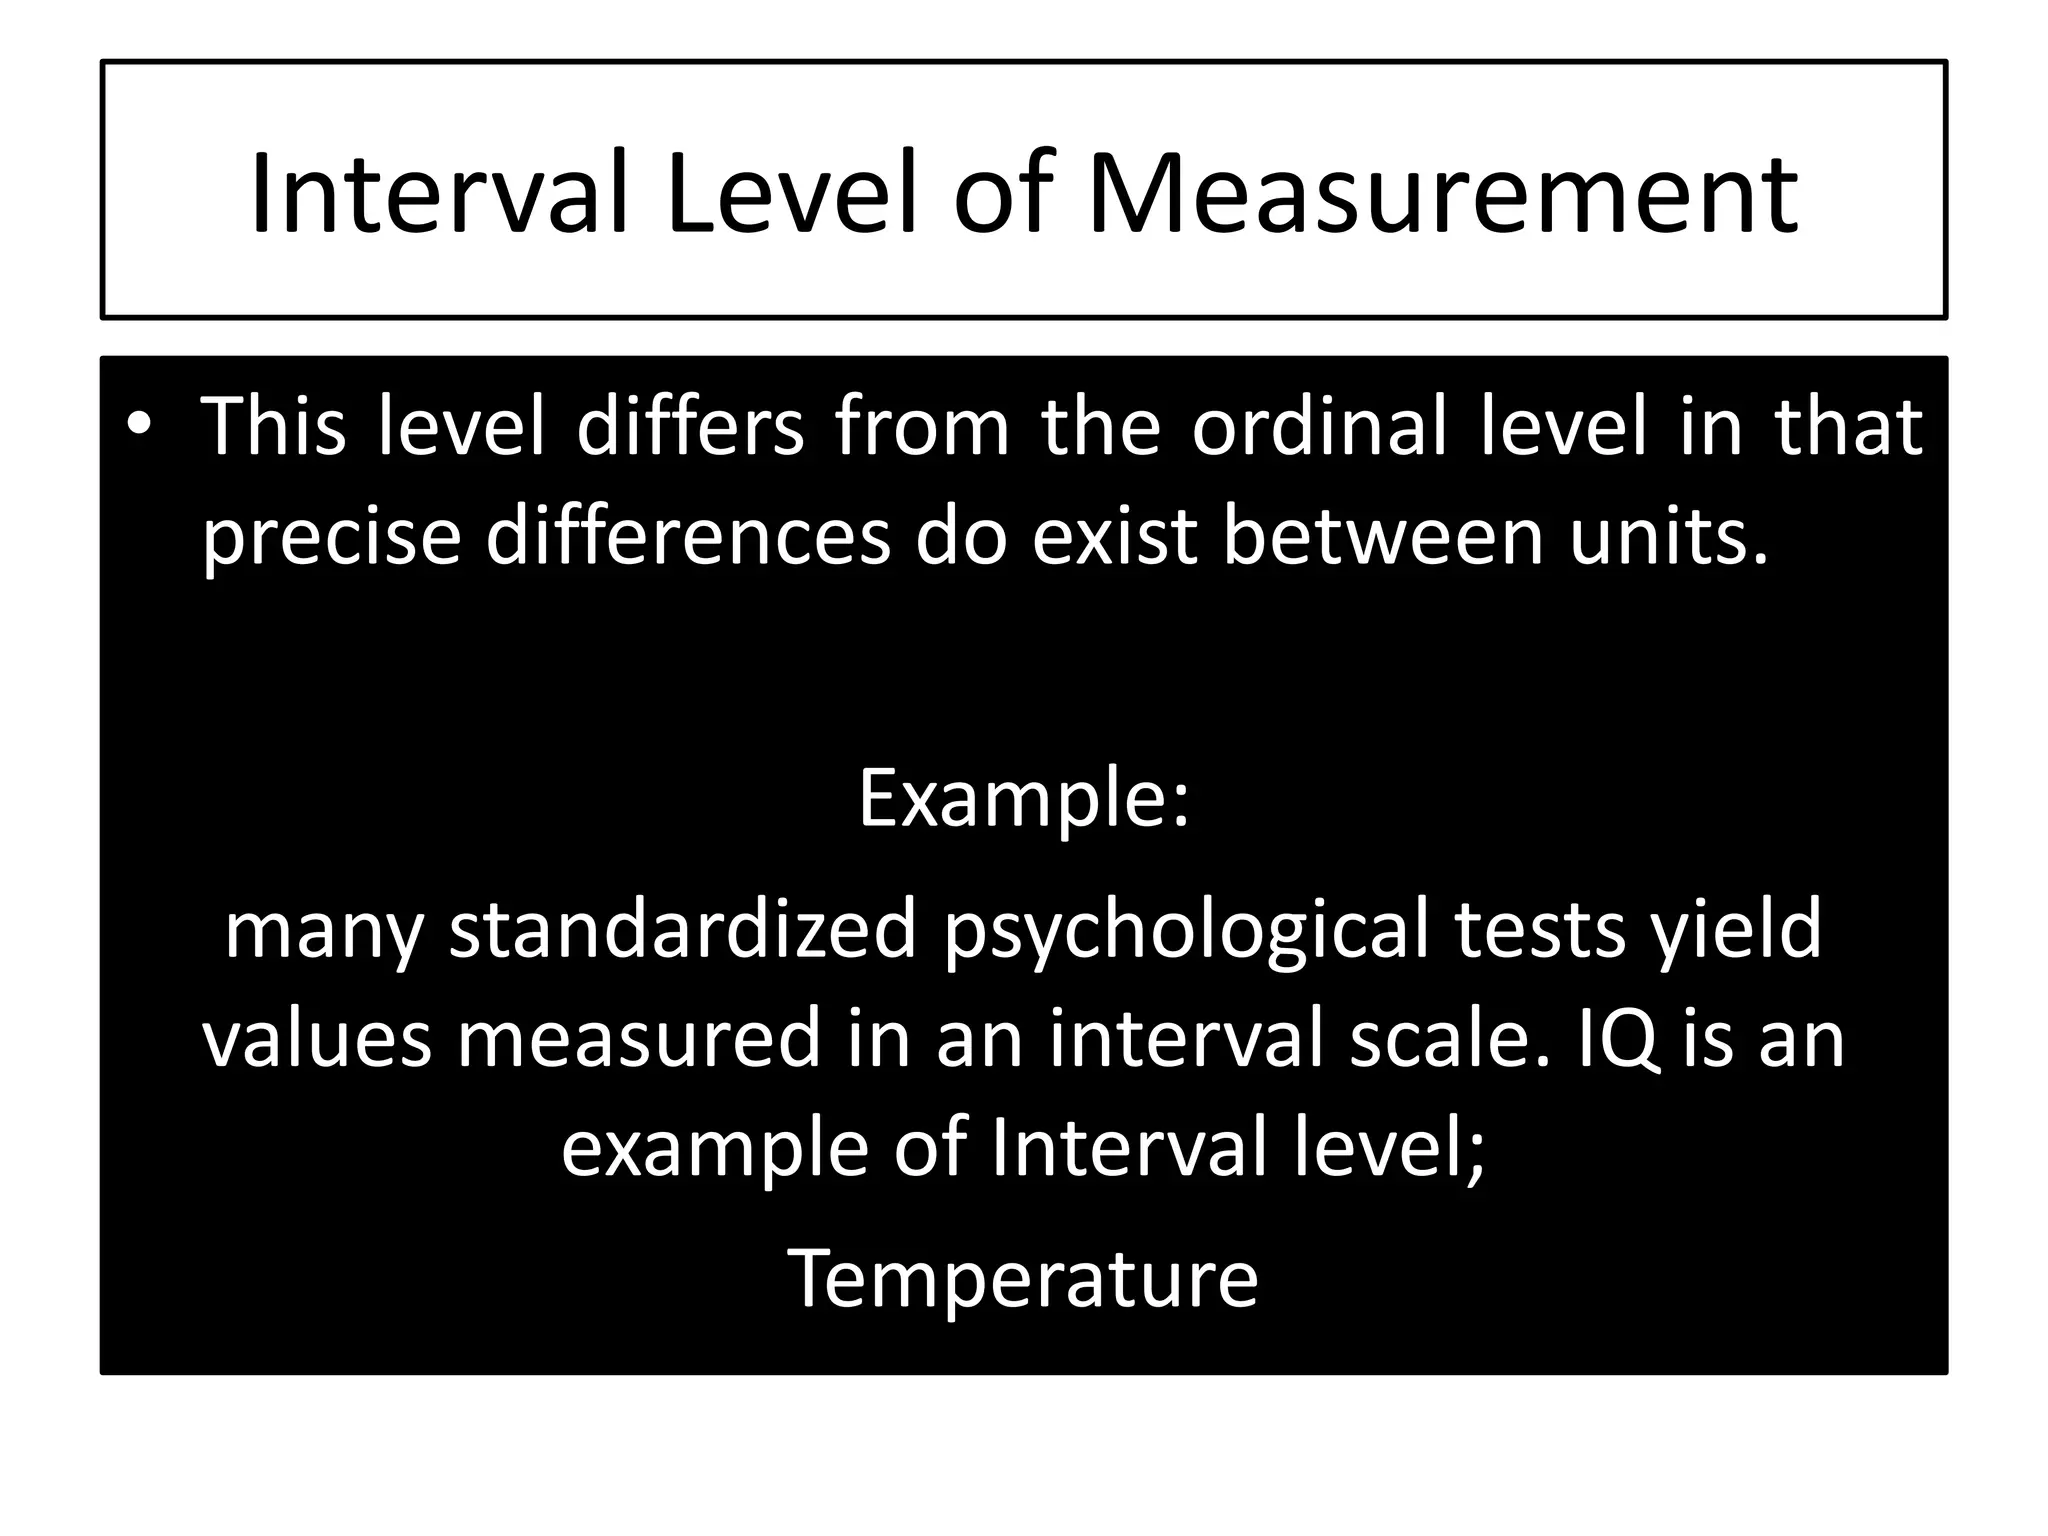
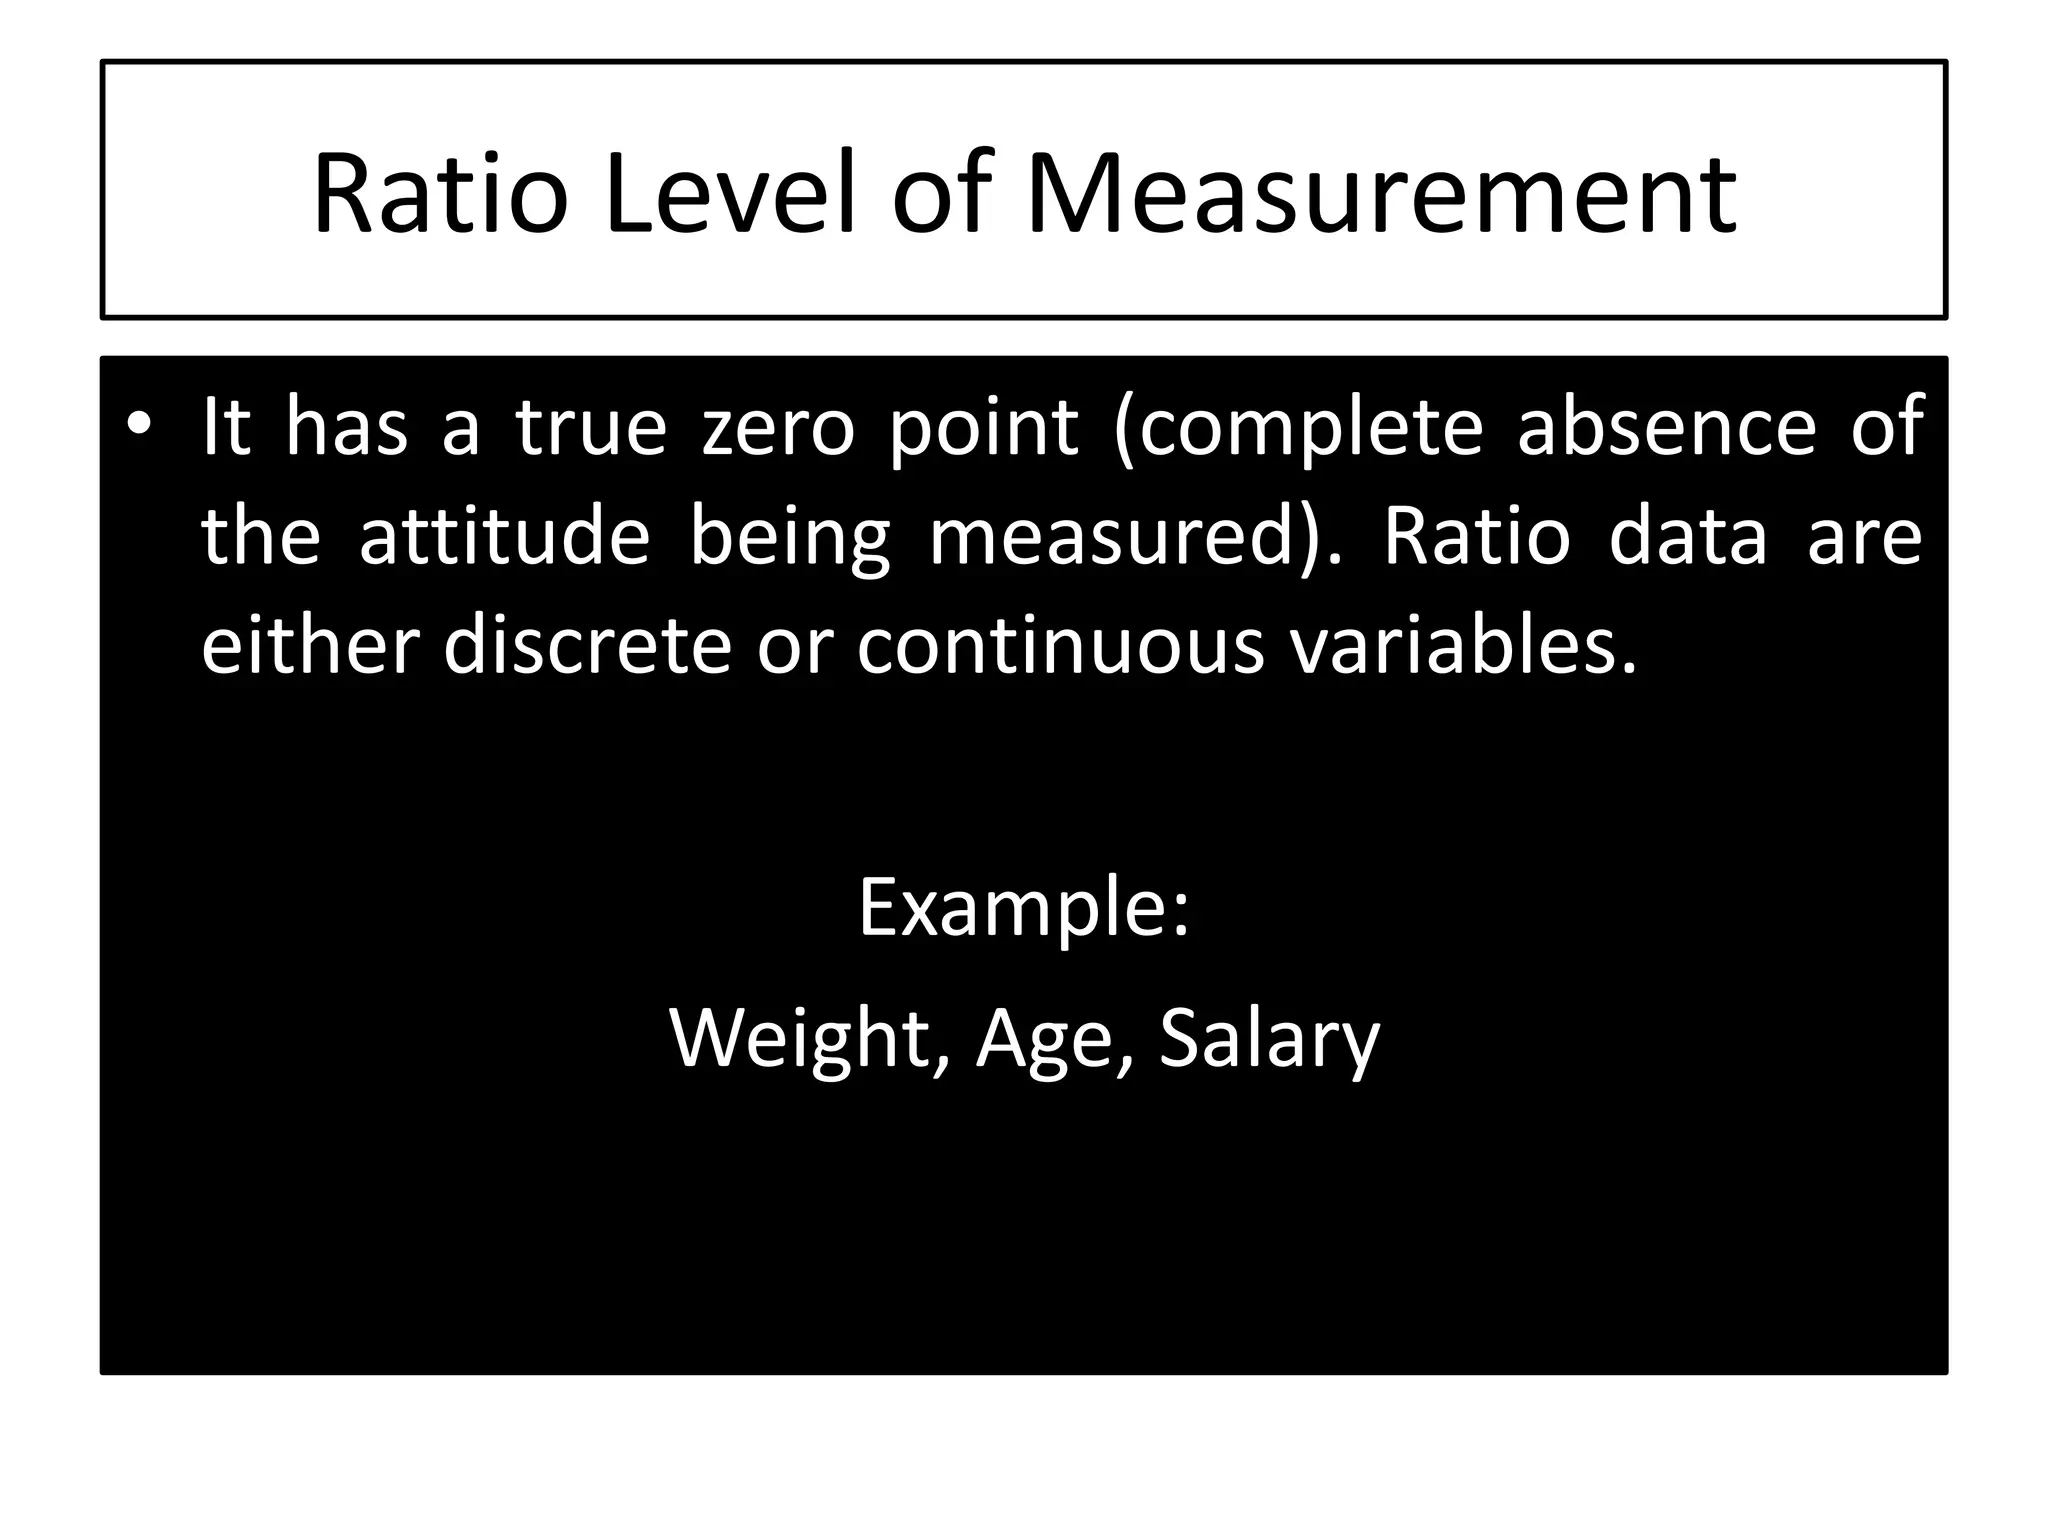
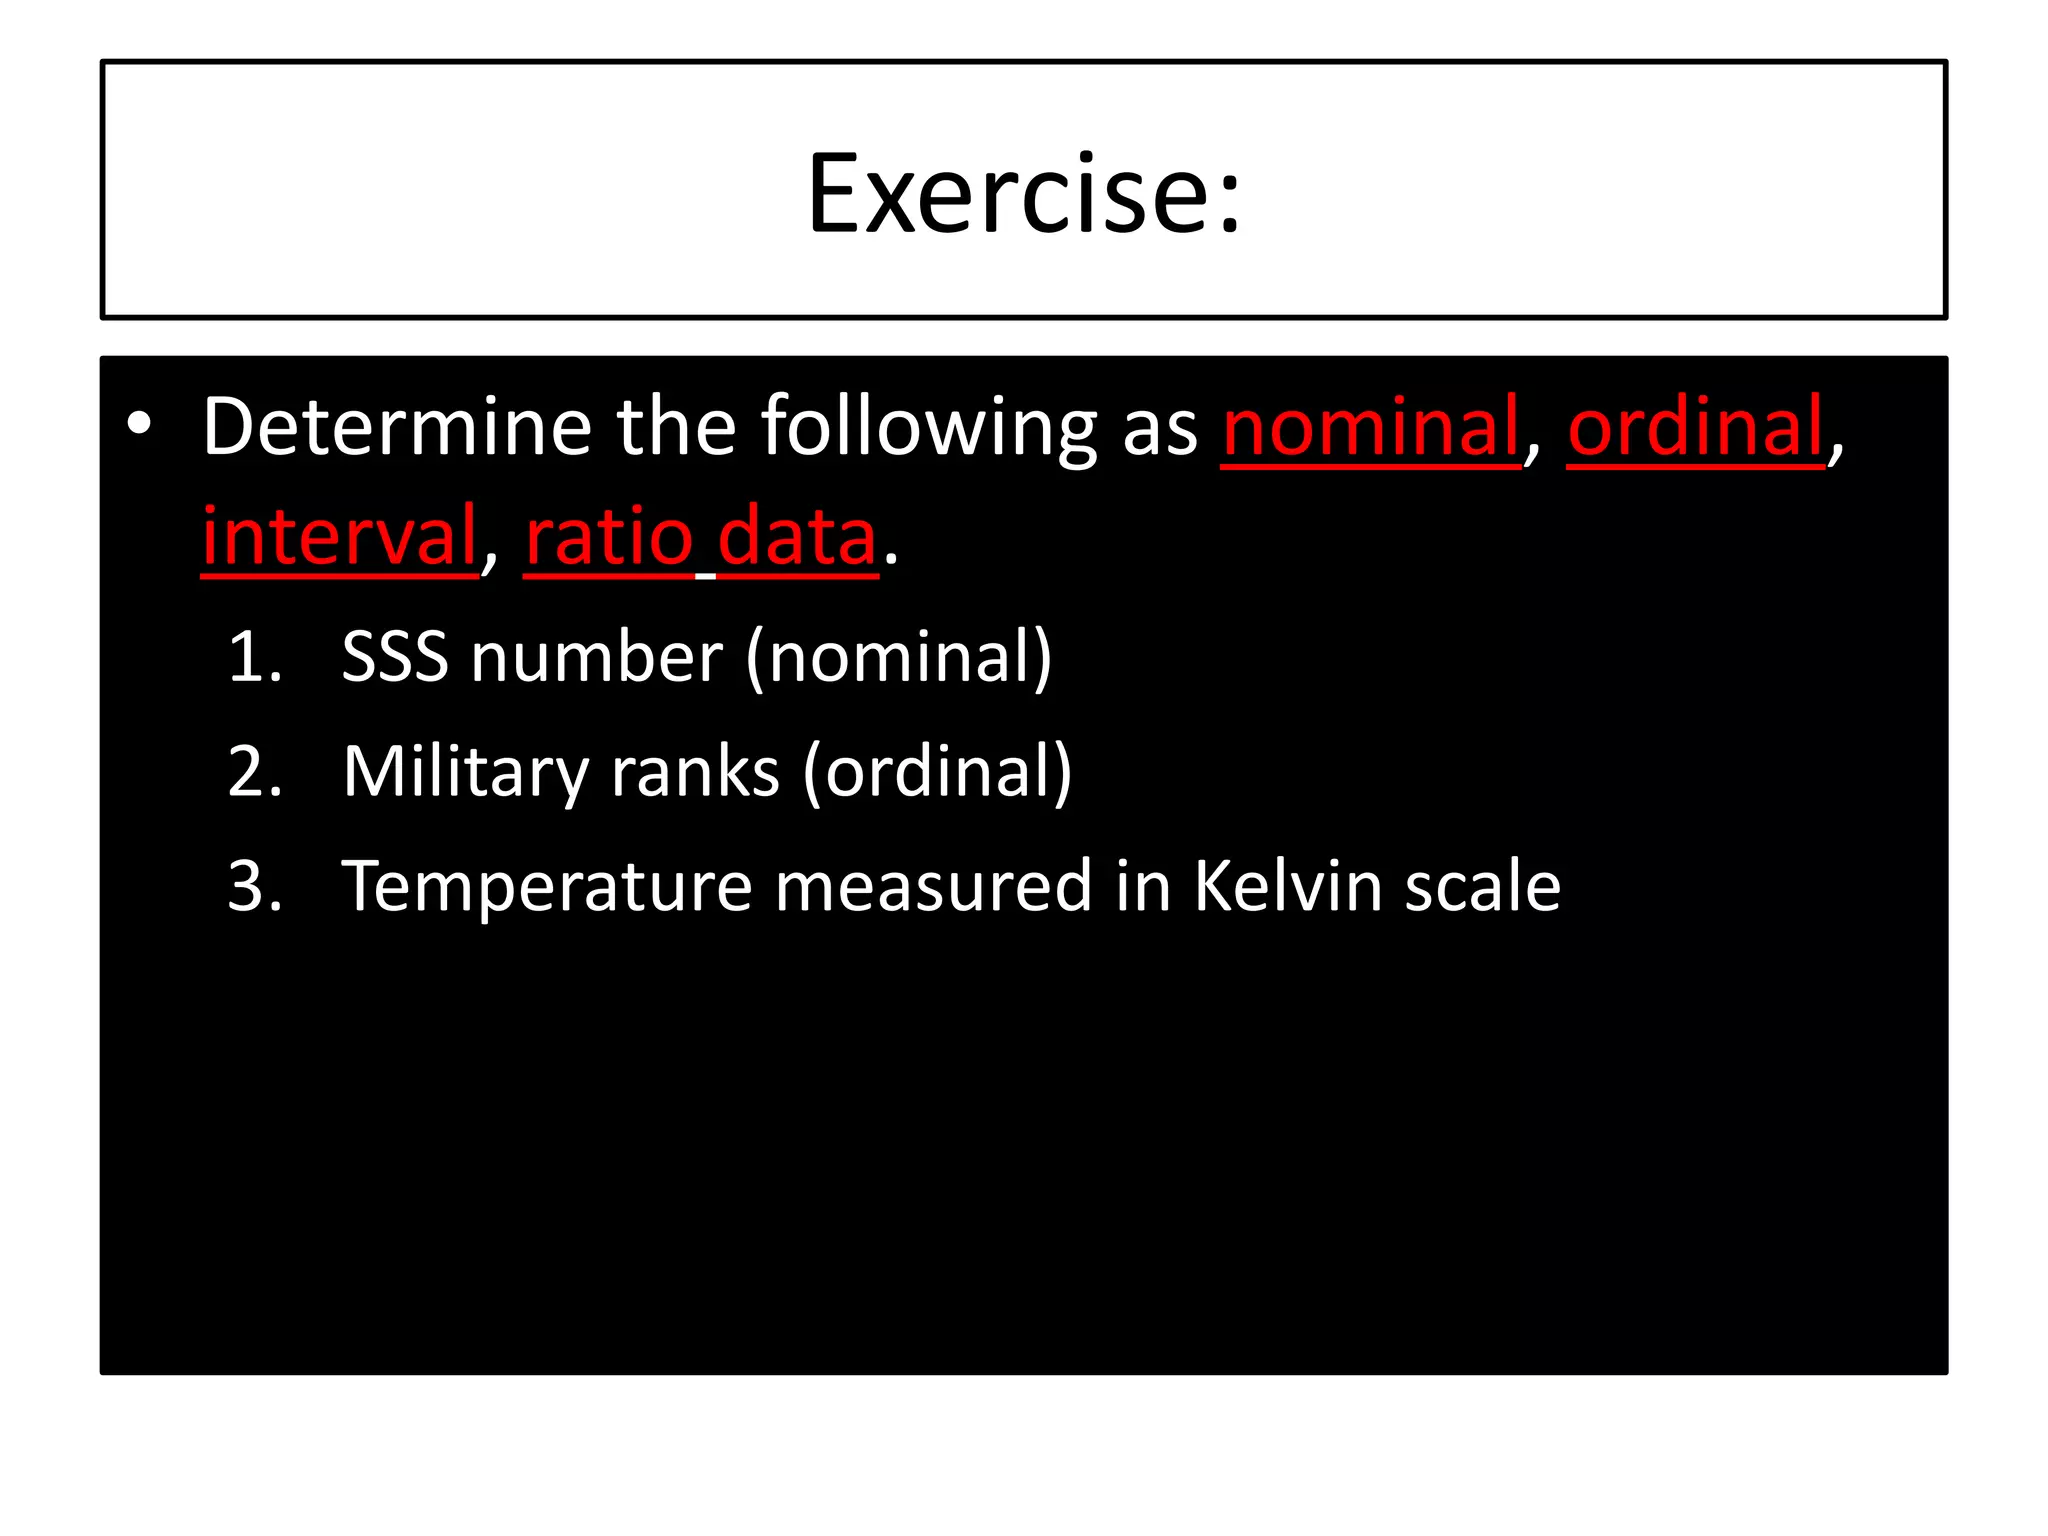
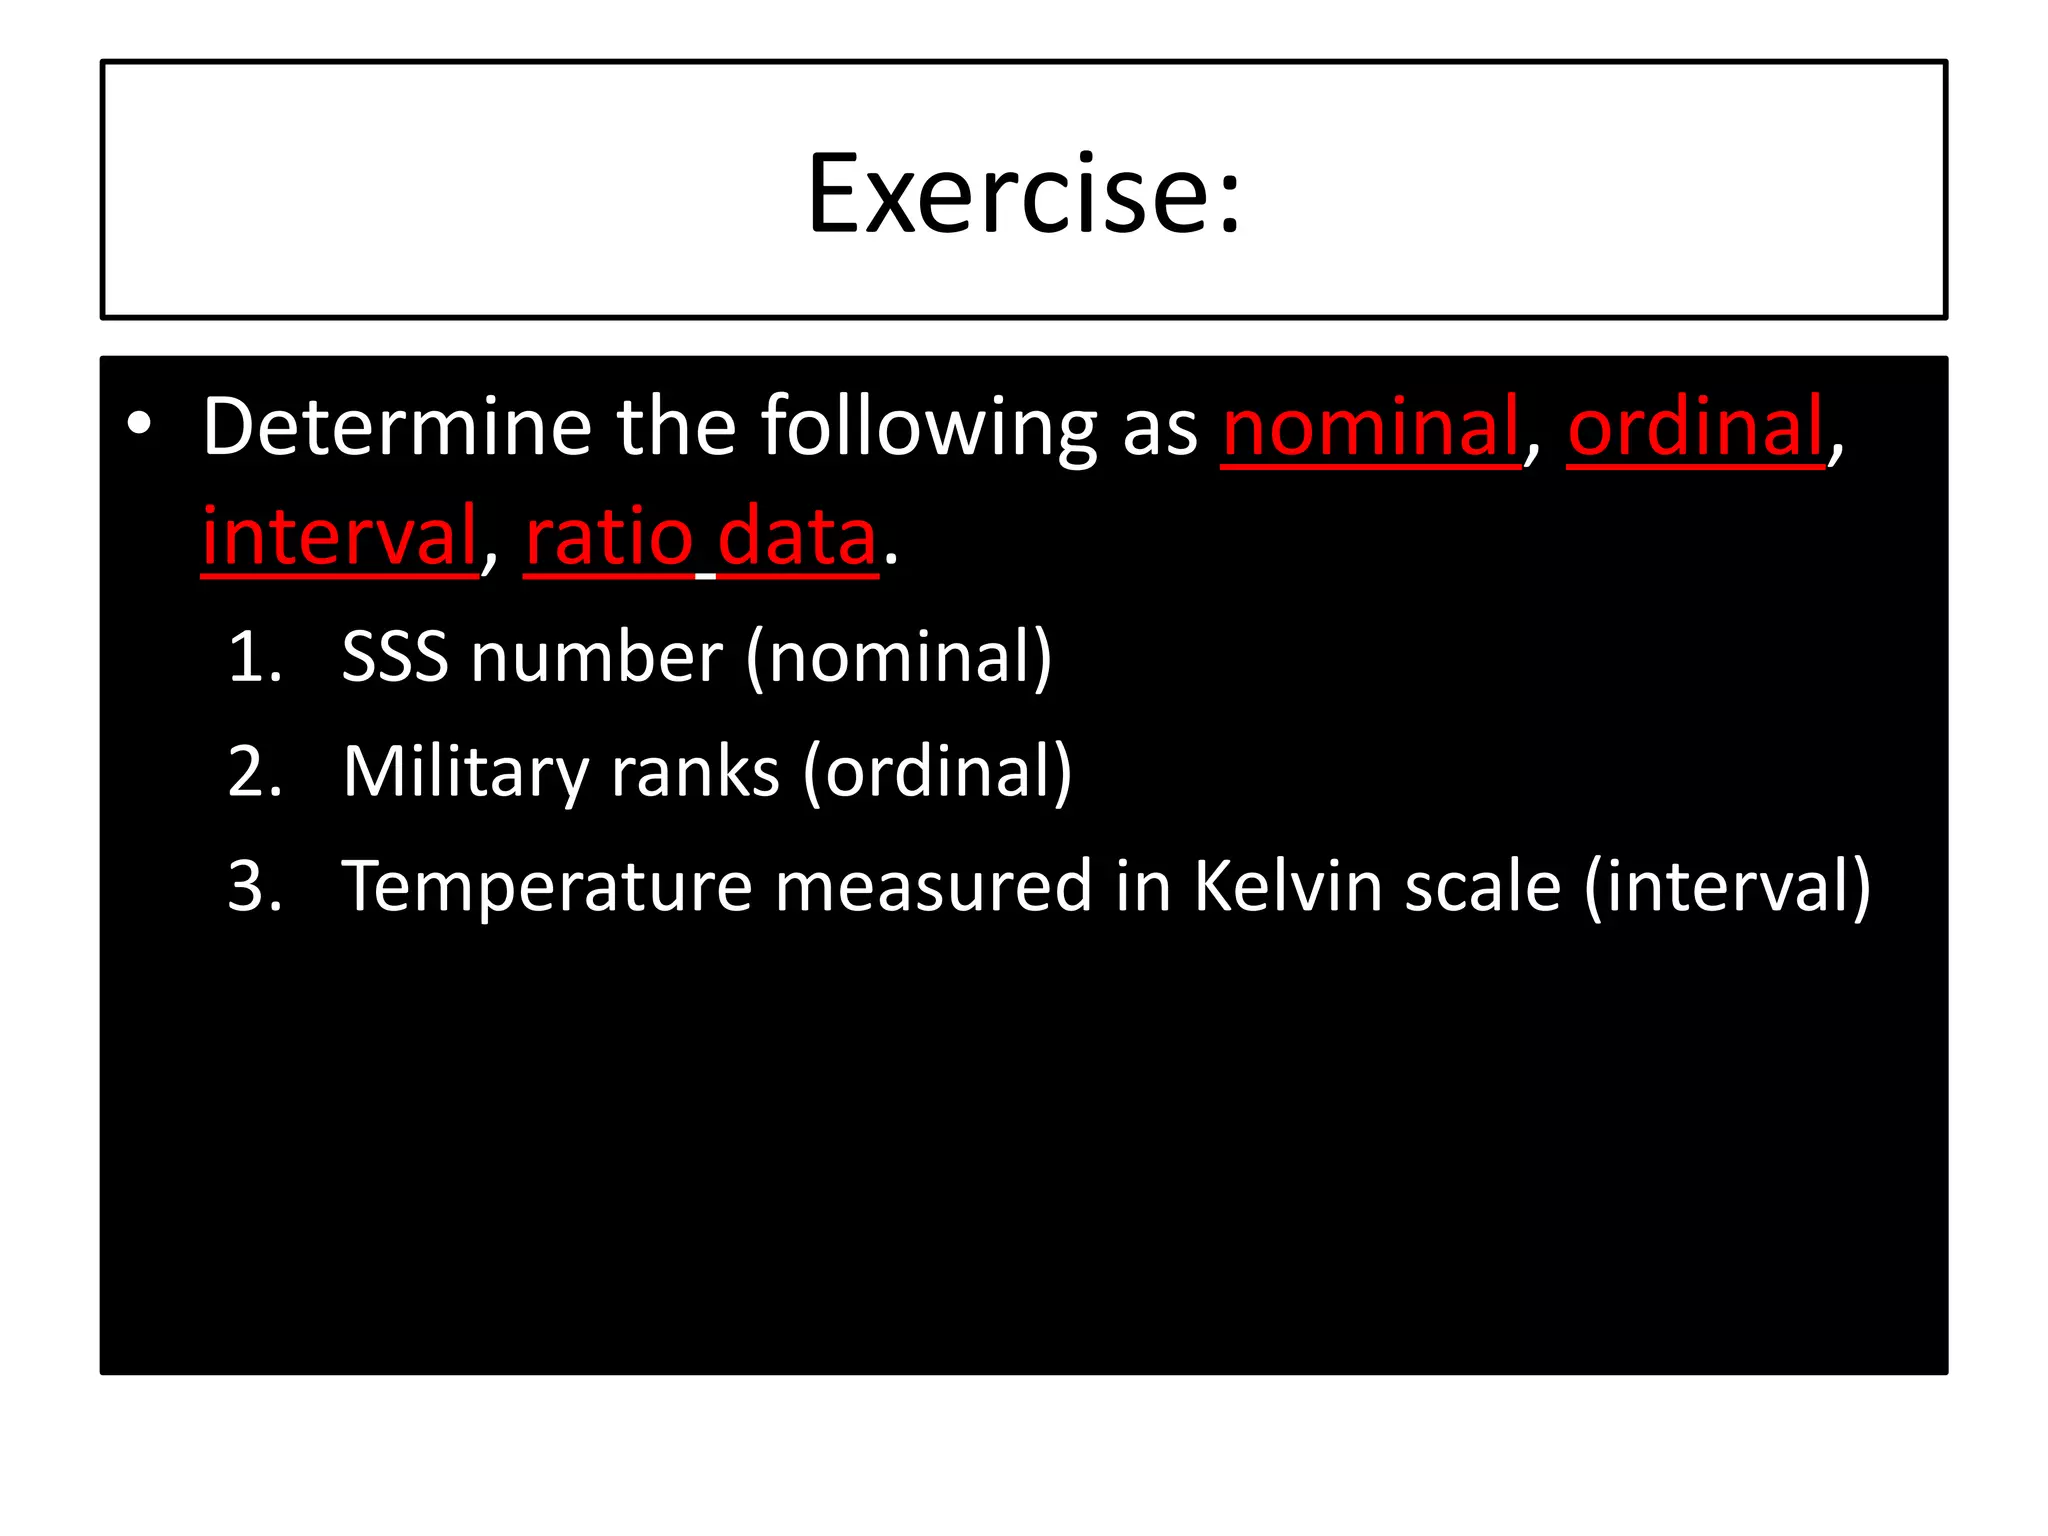
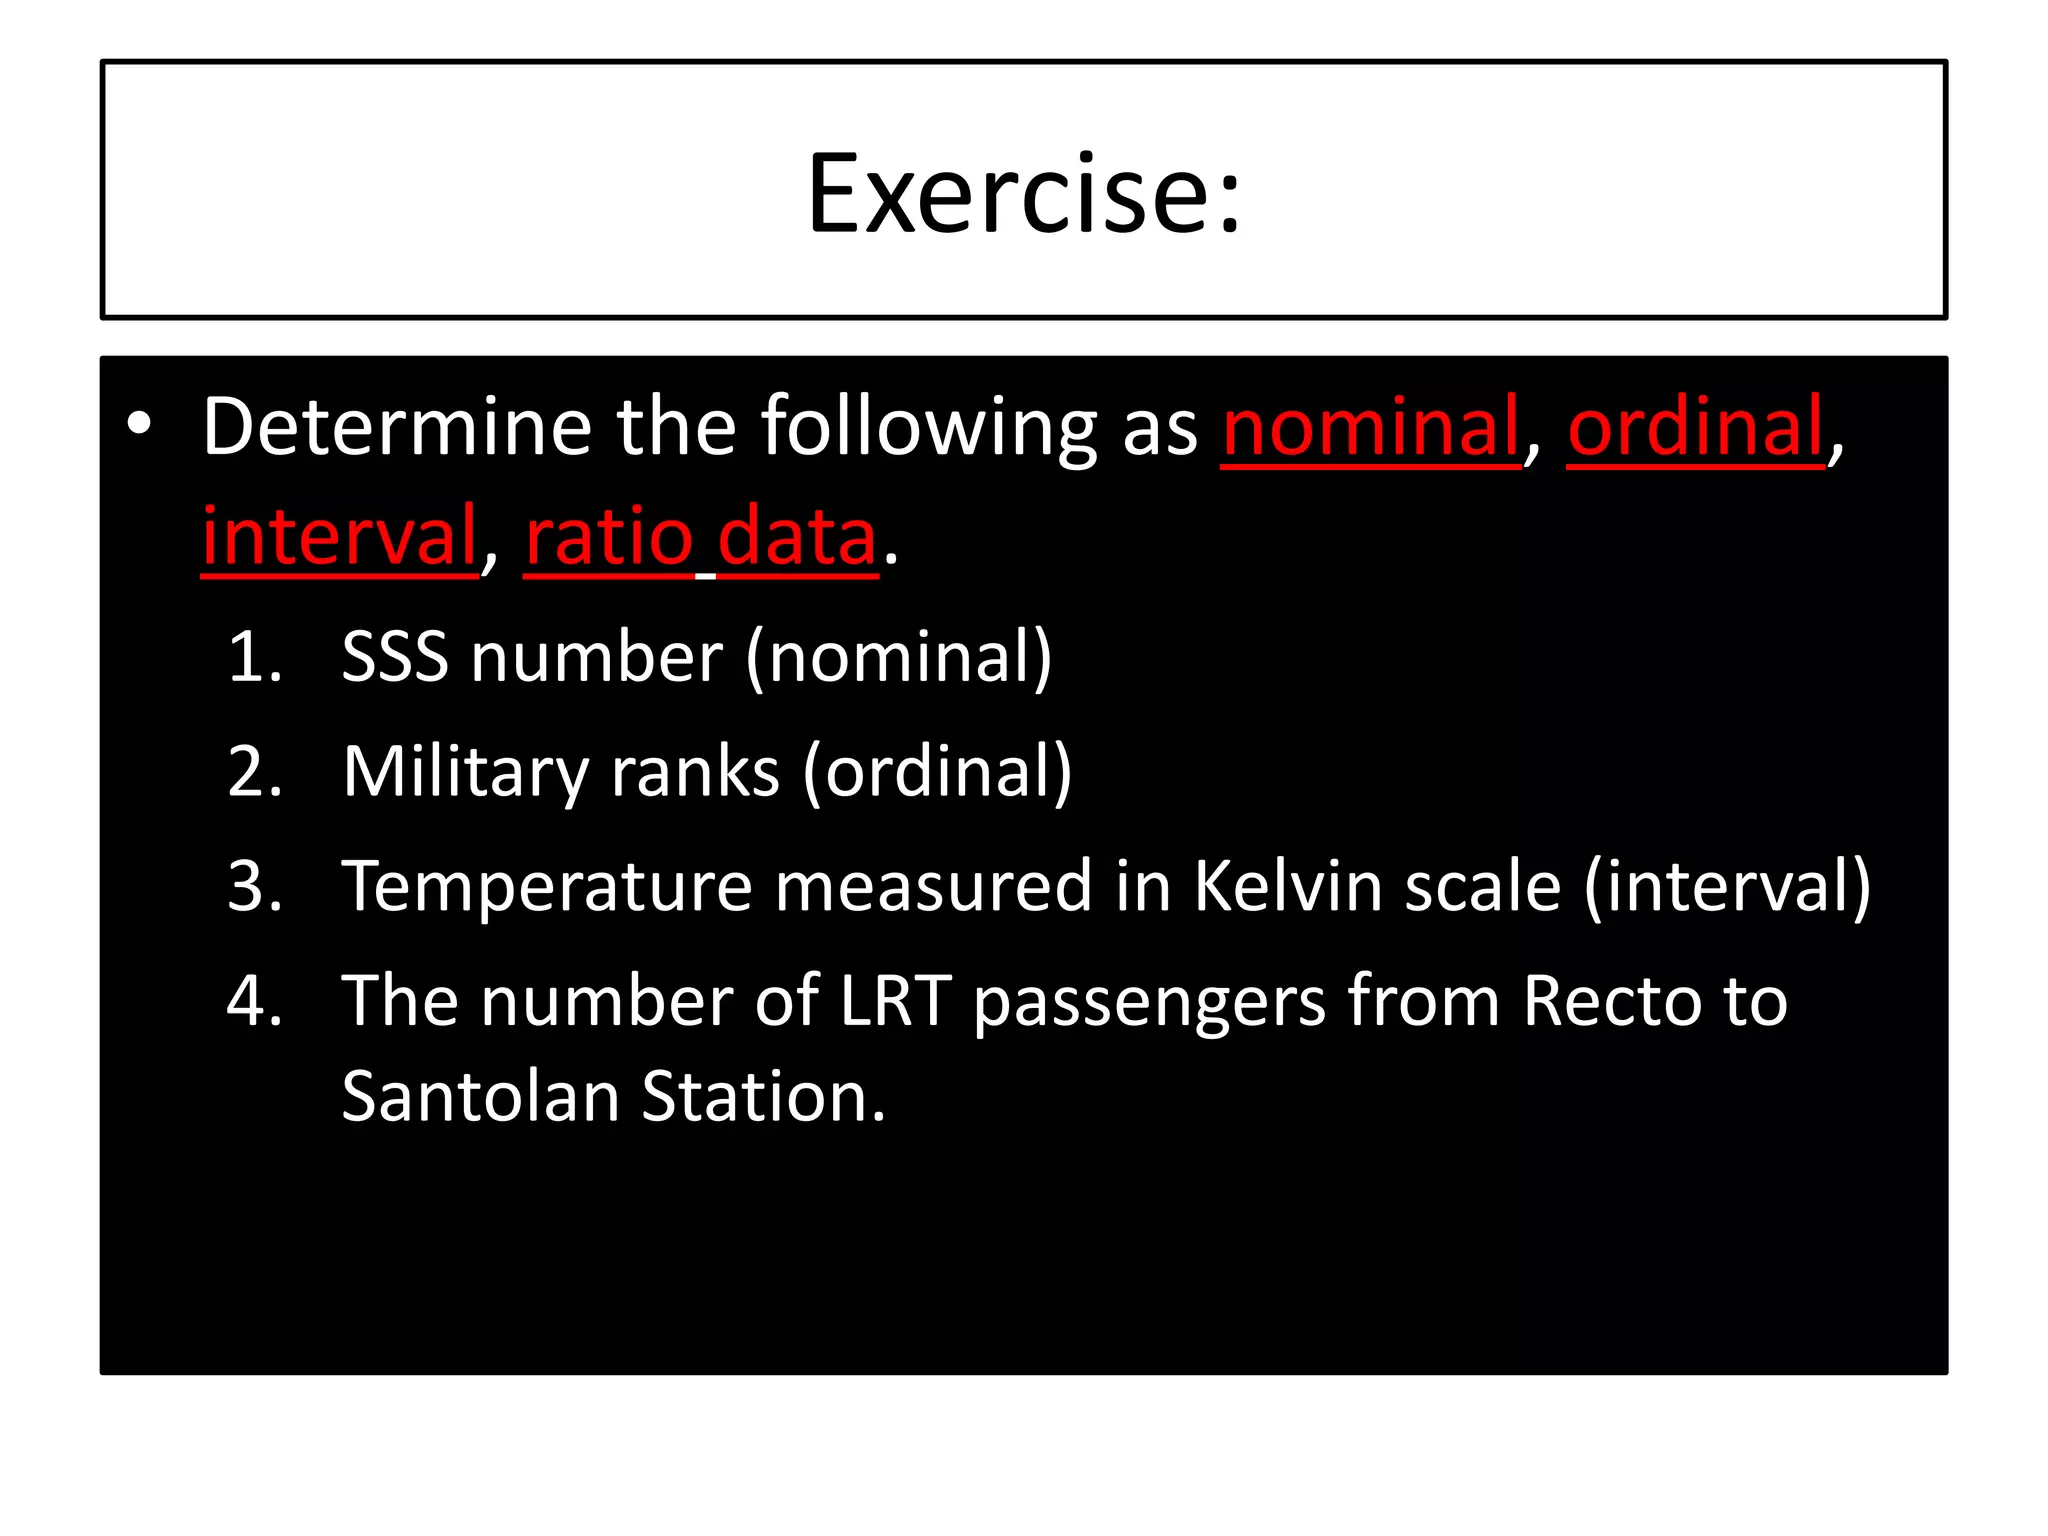
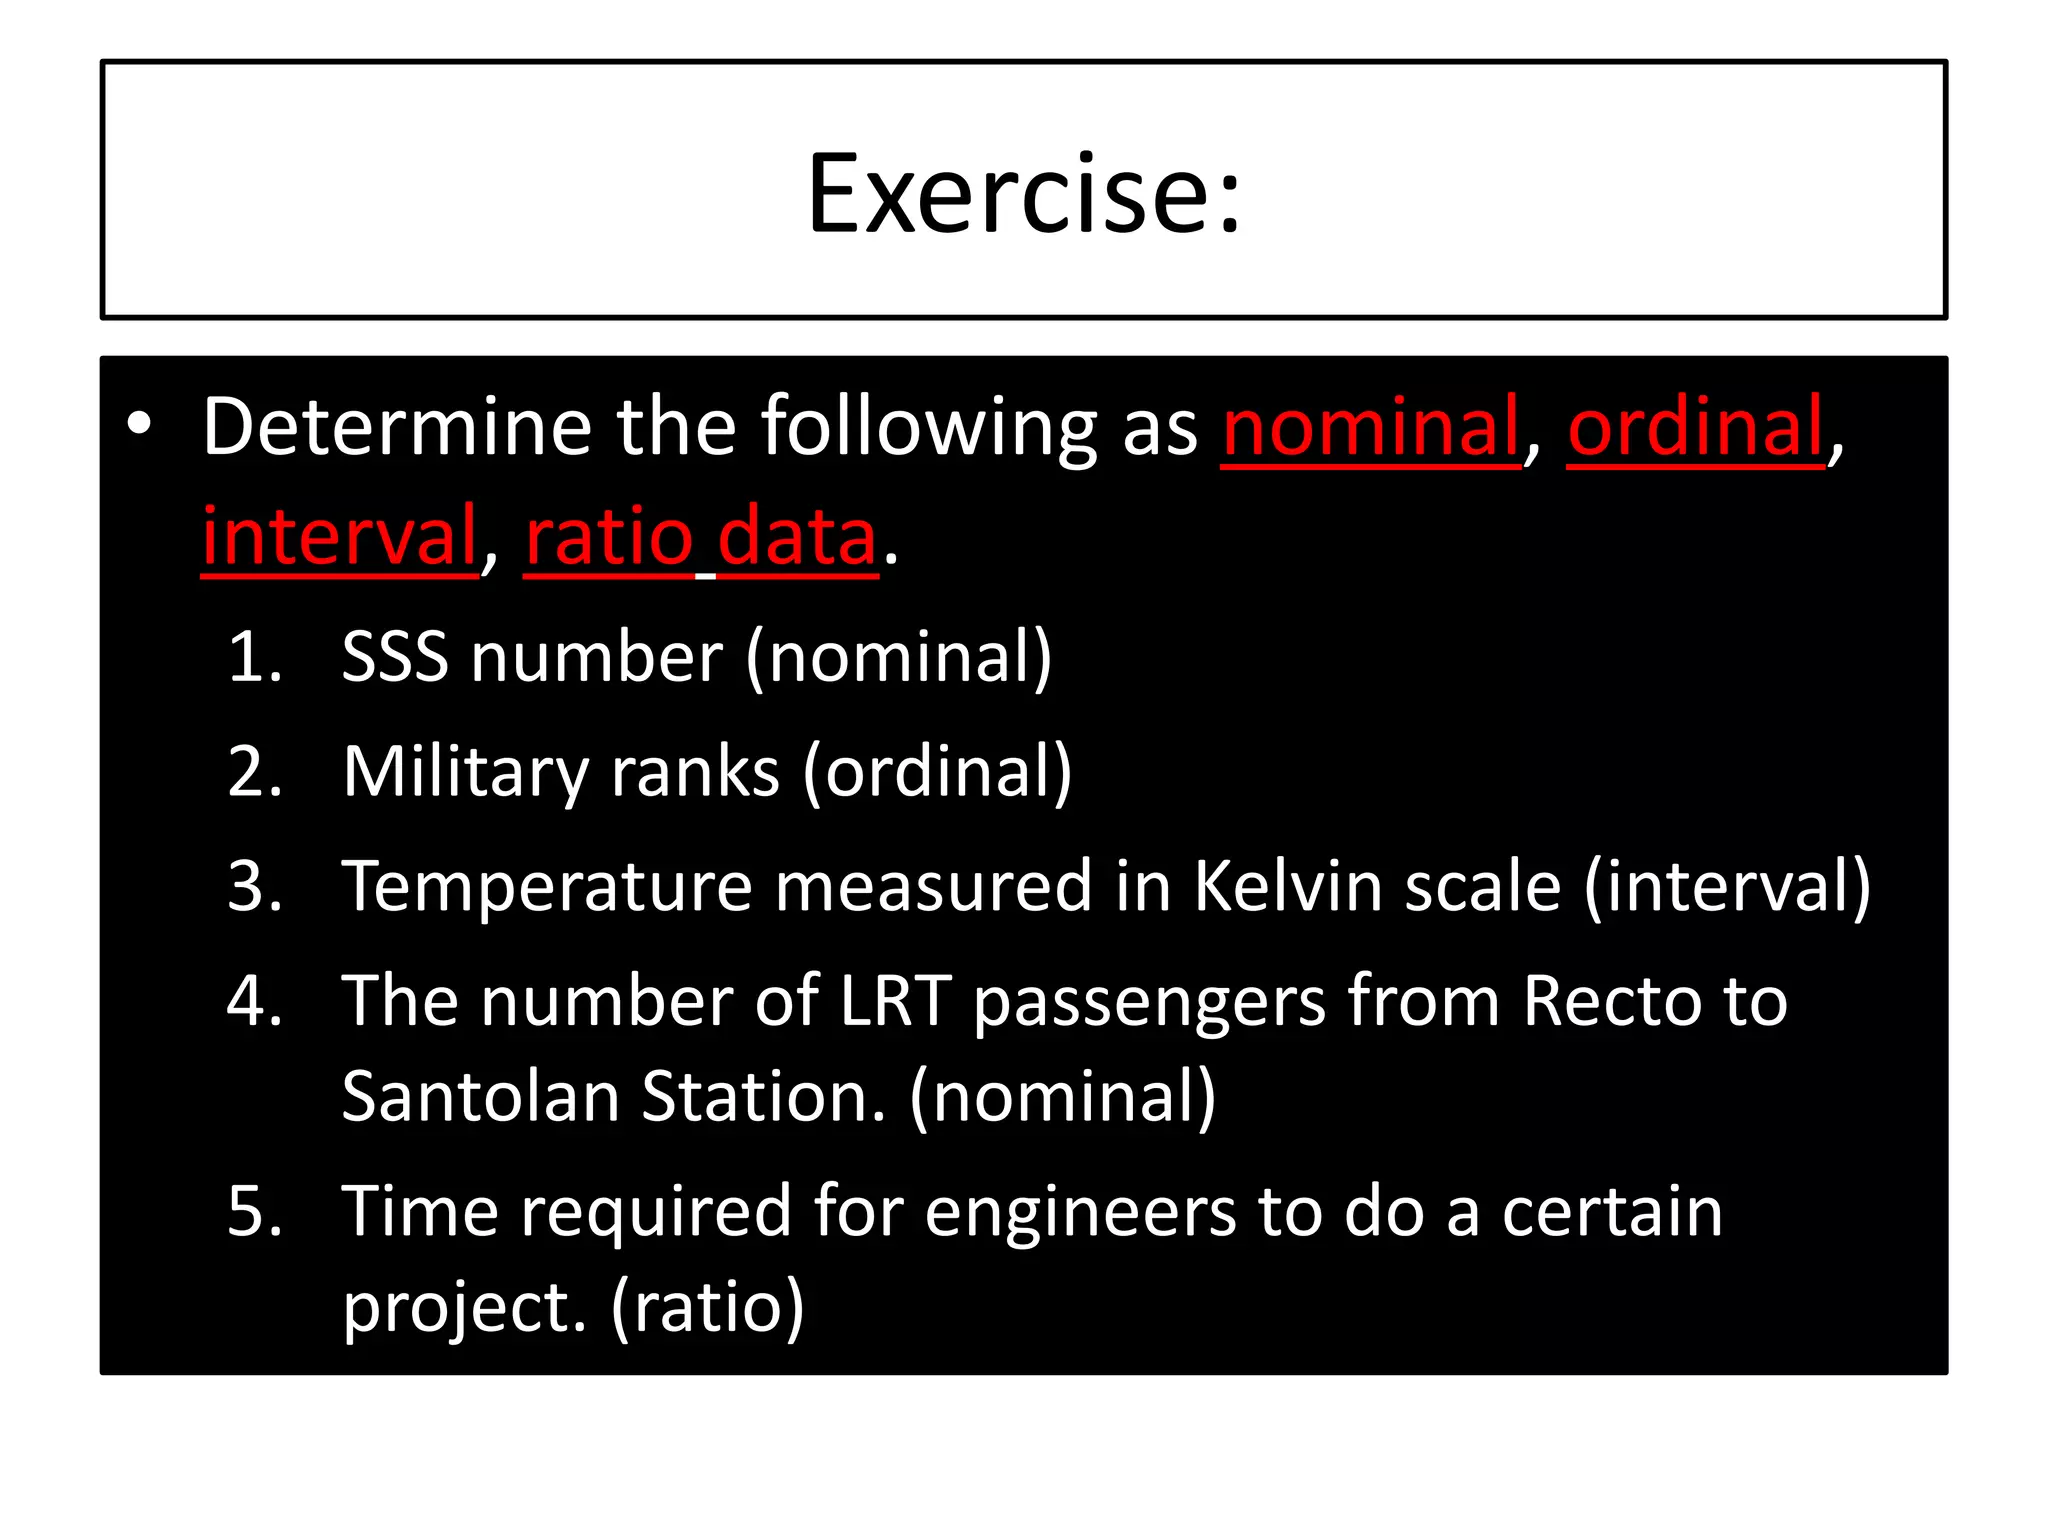
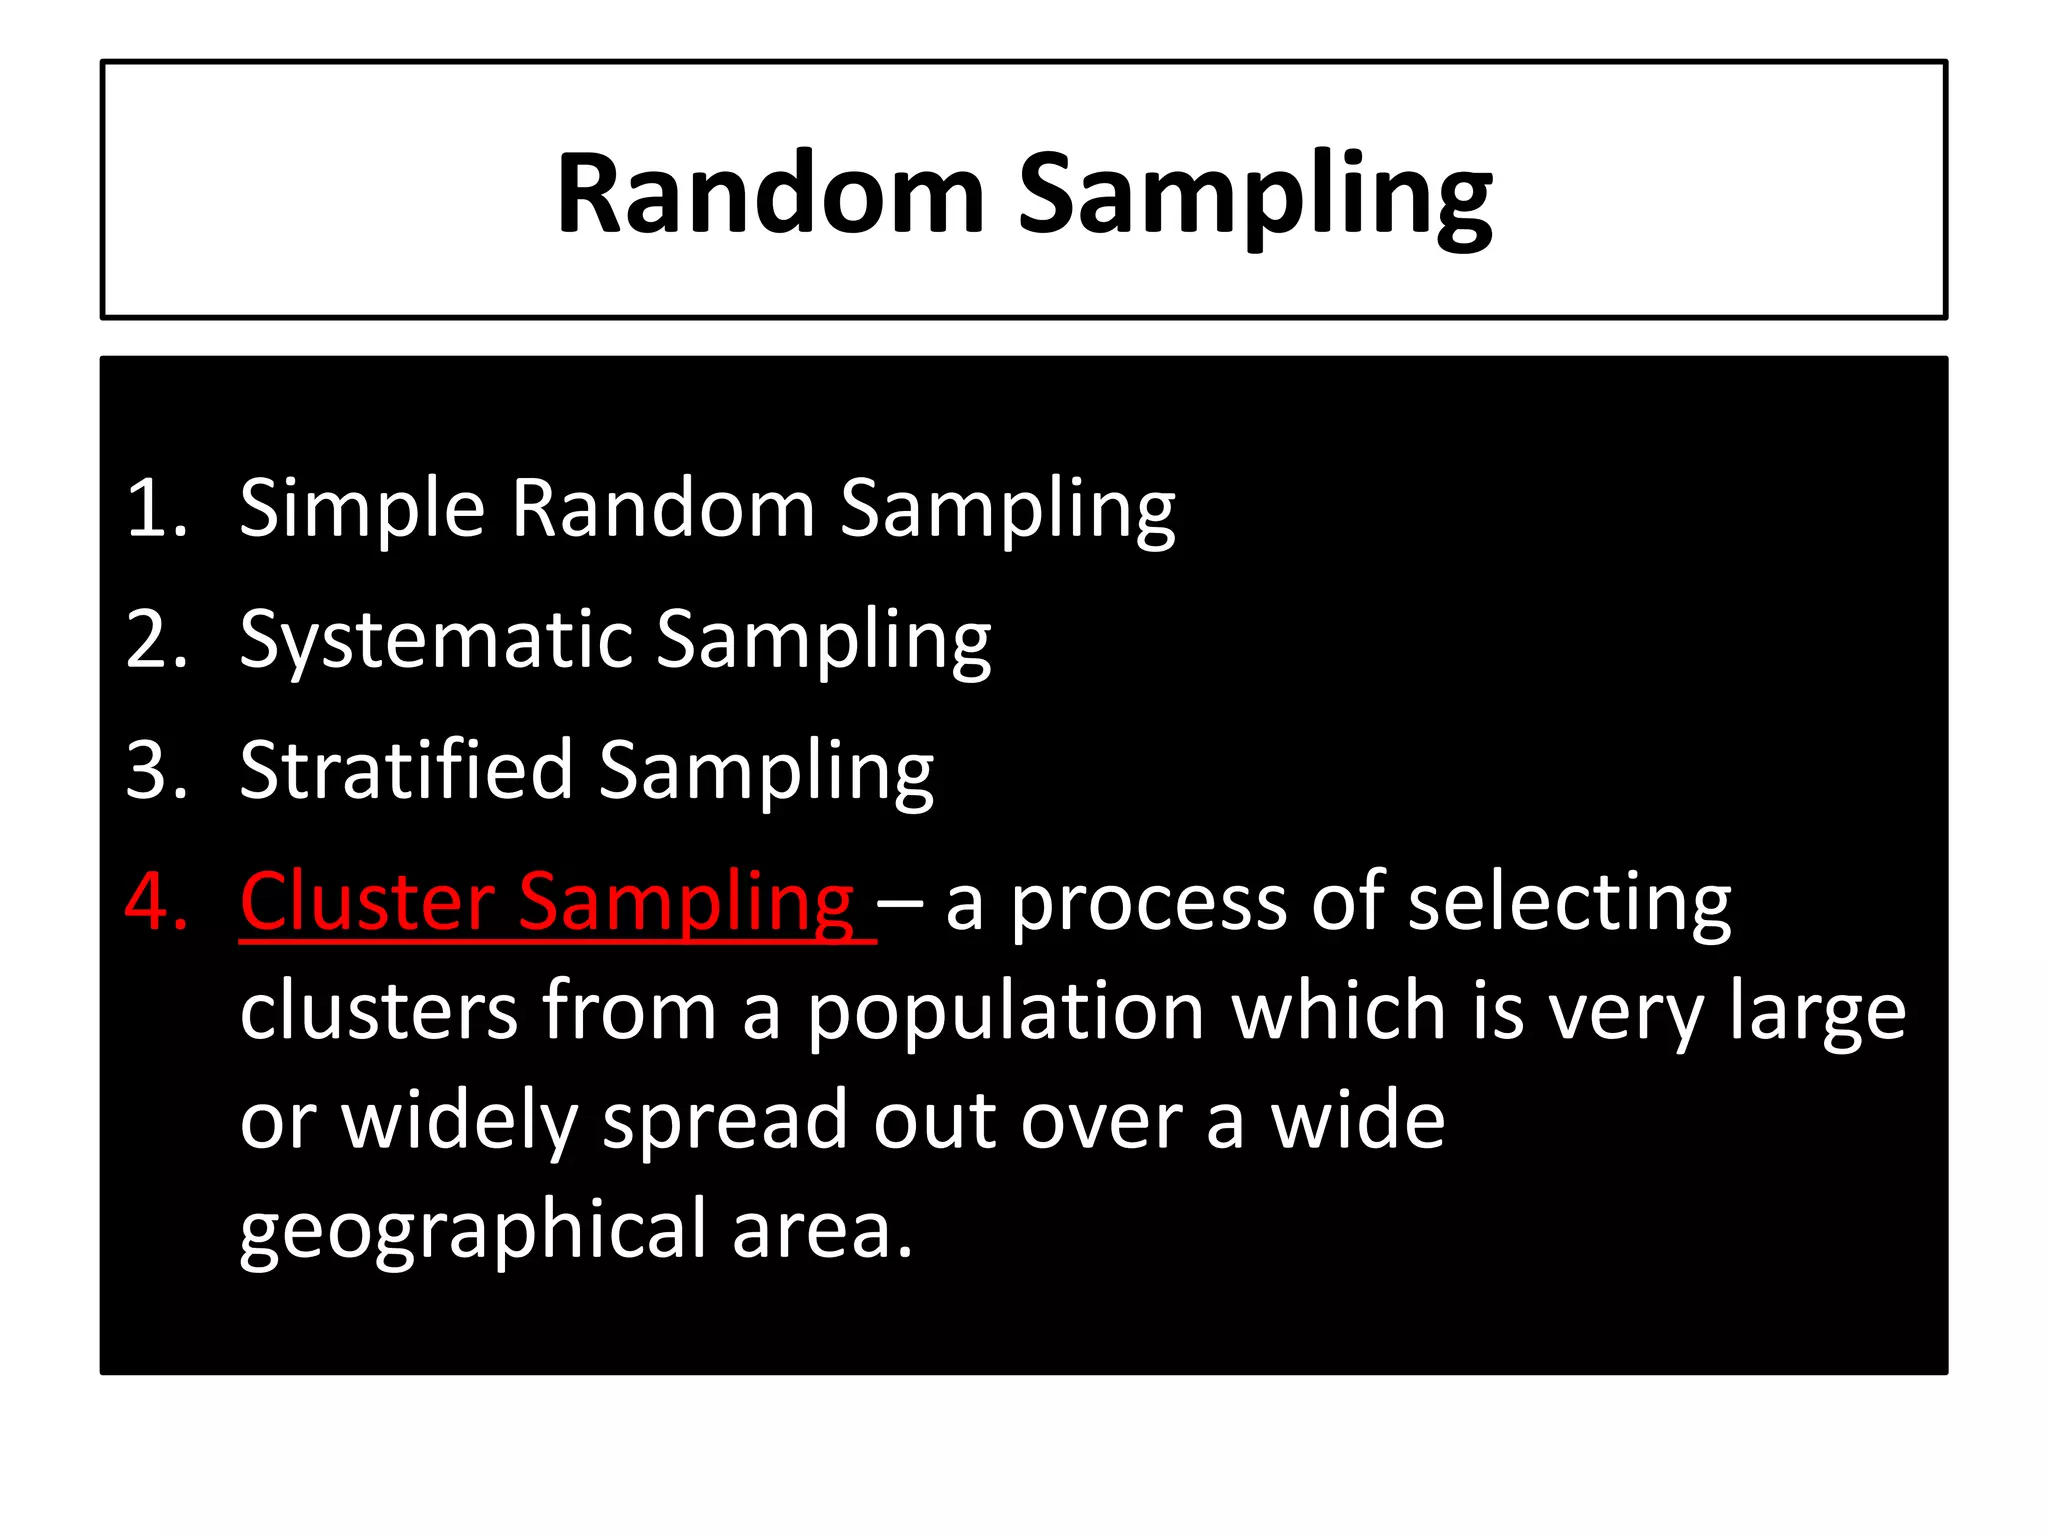
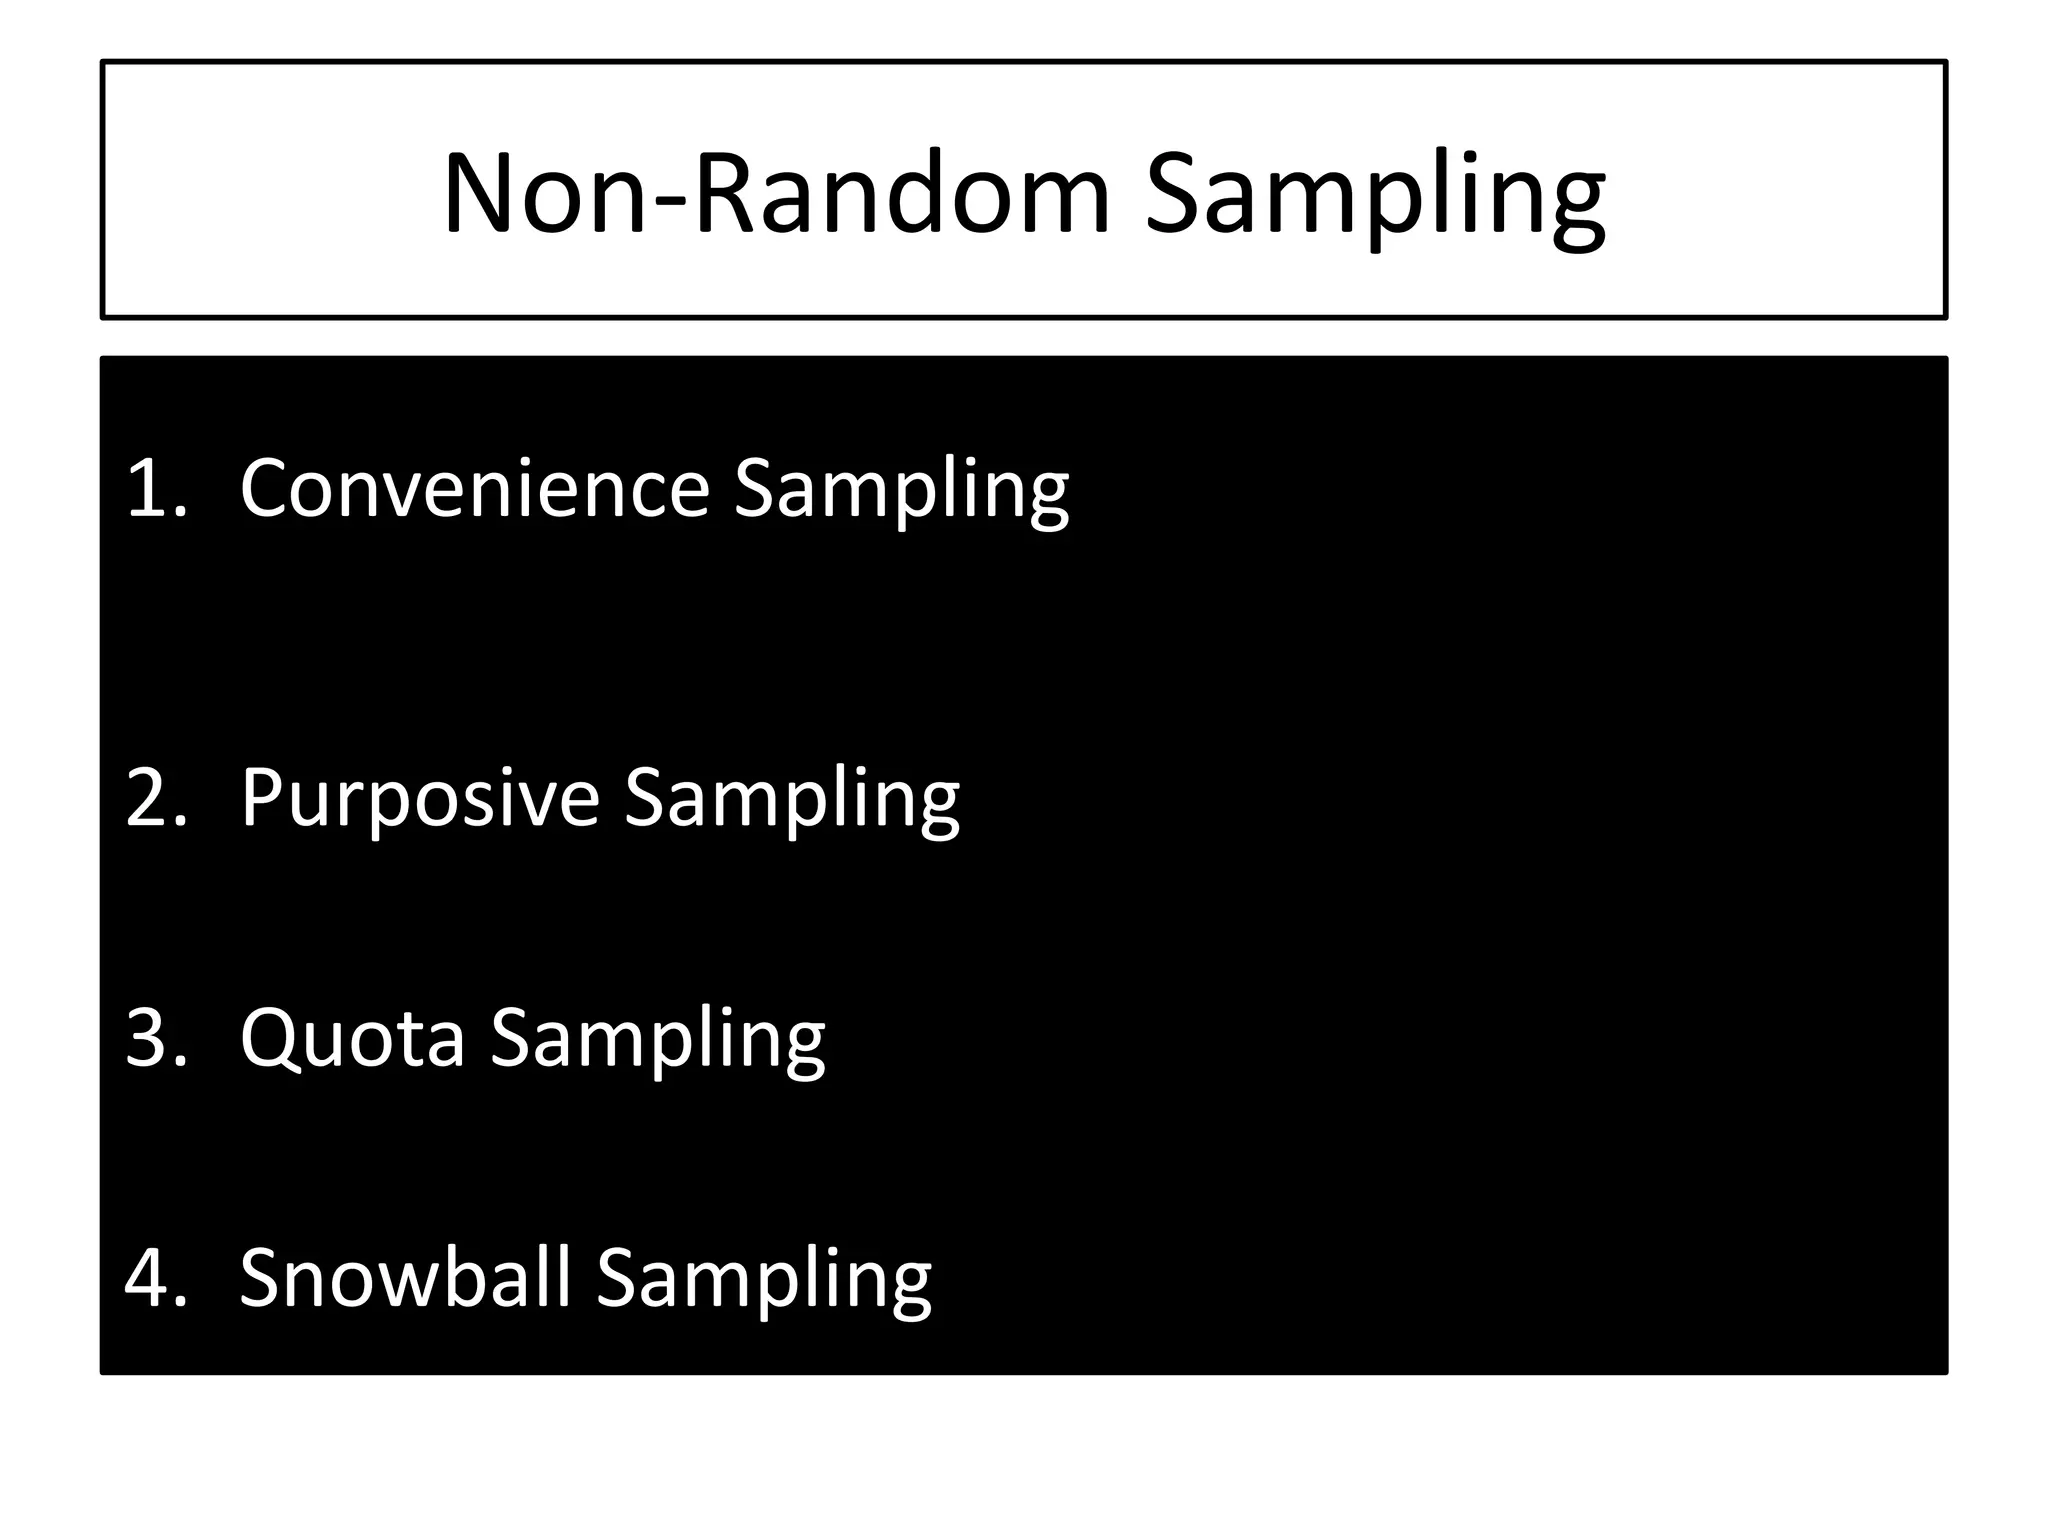
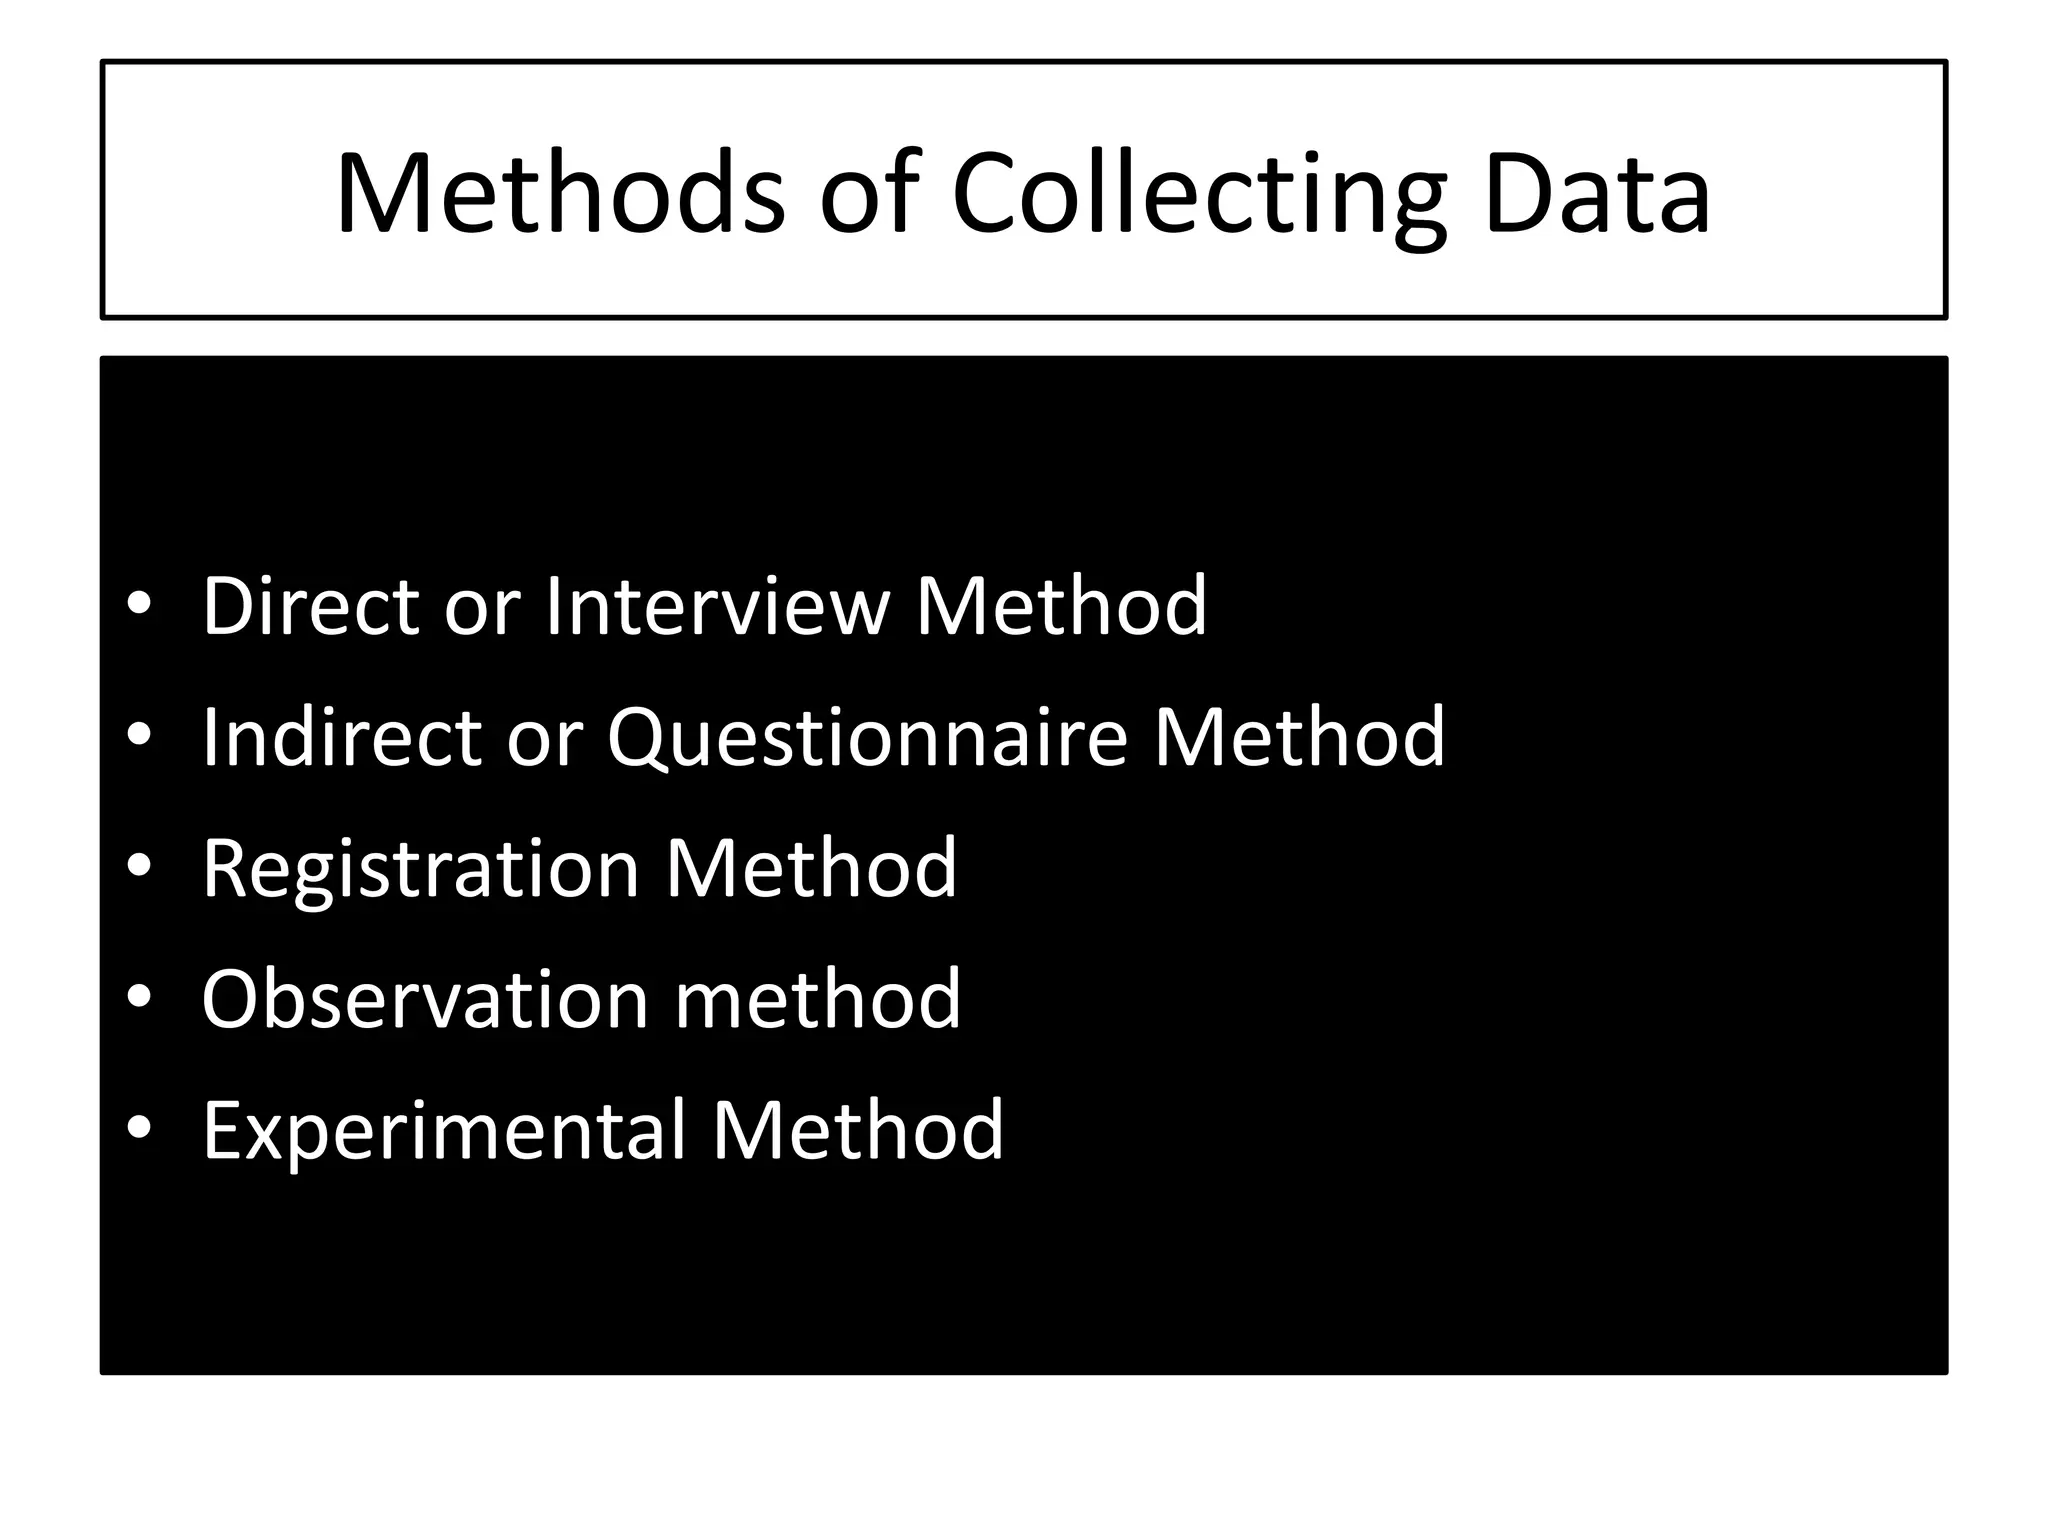
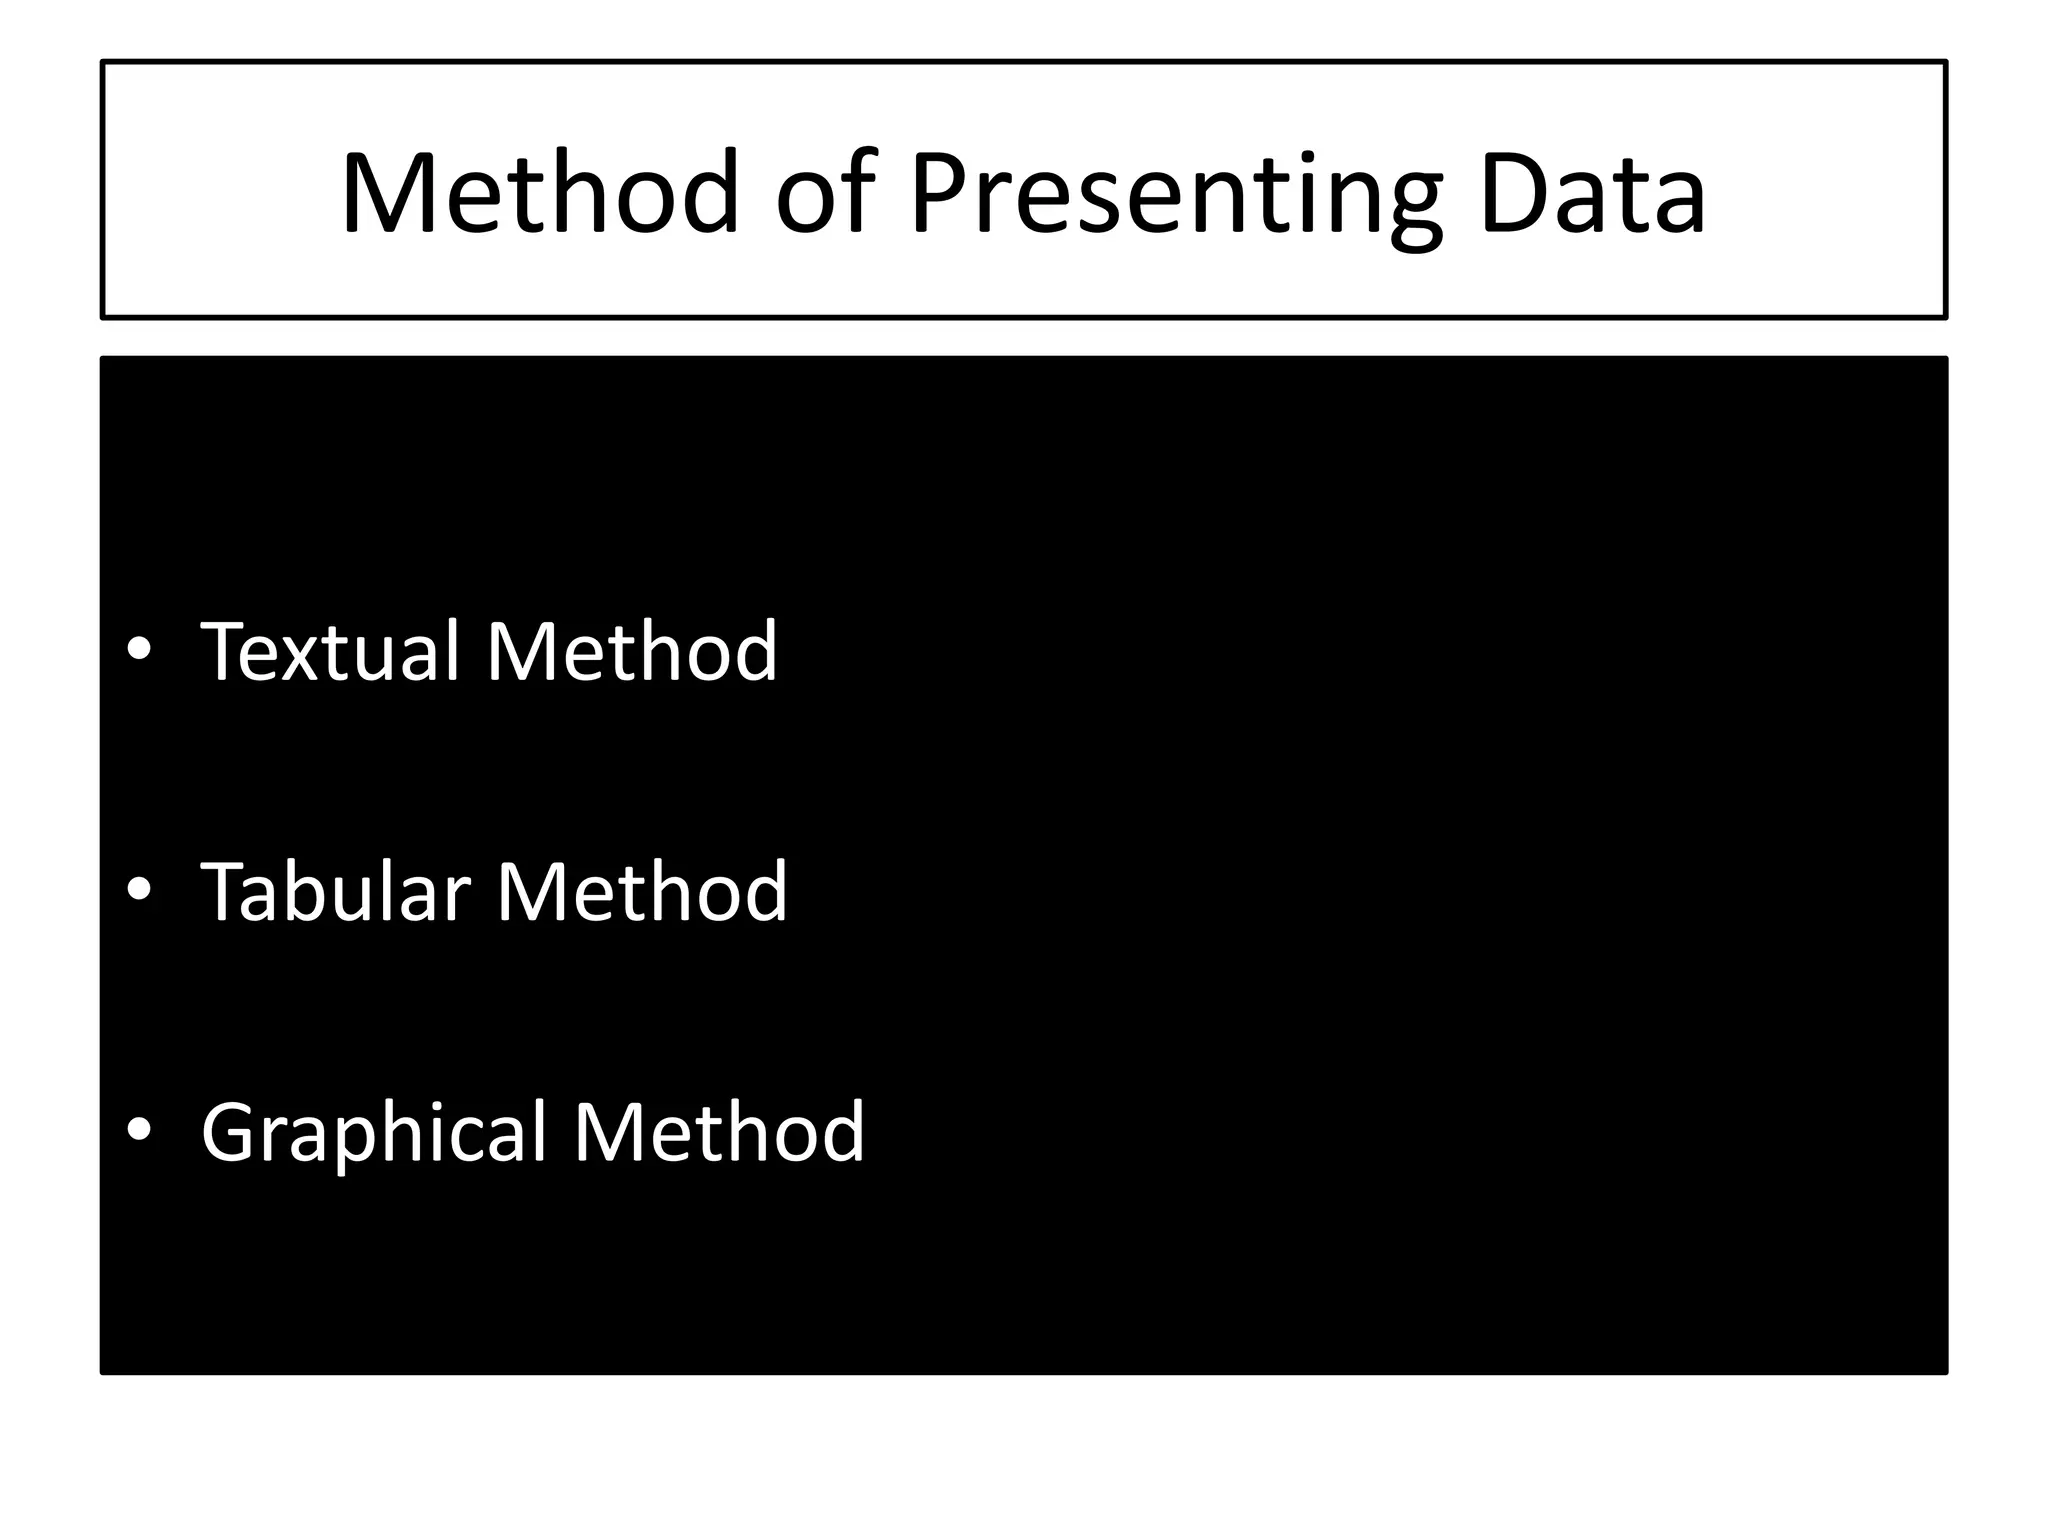
The Nature of Probability and
Statistics
Outline
• Descriptive and Inferential Statistics
• Variables and Types of Data
• Data Collection and Sampling techniques
Objectives
After the end of this chapter, you should be
able to
A. Demonstrate knowledge of statistical terms
B. Differentiate between the two branches of
statistics
C. Identify types of data
D. Identify the measurement level for each
variable
Statistics
It is the science of conducting studies to collect,
organize, summarize, analyze, and draw
conclusions from data.
Descriptive and Inferential
• Variable – a characteristic or attribute that can
assume different value.
• Data – are values that the variables can
assume.
• Random Variables – variables whose values
are determined by chance.
• Data set – a collection of data values.
• Data value – Each value in the data set.
Examples:
• Variables: a characteristic or attribute that can assume
different value.
– Grades, gender, height,…
• Data: are values that the variables can assume.
– {89,98,99,100}, {male, female}, {50cm, 100cm, 89cm,
…}
Examples:
• Random Variables: variables whose values are
determined by chance.
– Number of heads or tails in tossing a coin, results in
tossing a die/s…
• Data set: a collection of data values.
– {89,98,99,100}, {male, female}, {50cm, 100cm, 89cm,
…}.
Descriptive and Inferential
Data can be used in different ways. The body of
knowledge called statistics is divided into two
main areas, depending on how data are used.
The two areas are:
•Descriptive statistics
•Inferential statistics
Descriptive and Inferential
• Descriptive Statistics – consists of the
collection, organization, summarization and
presentation of data.
Examples:
Nine out of ten on-the-job fatalities are men.
Expenditures for the cable industry were $5.66
billion in 1996.
The national average annual medicine expenditure
per person is $1052.
• Inferential Statistics – it consist of generalizing
from samples to populations, performing
estimations and hypothesis tests, determining
relationships among variables, and making
predictions.
– Example:
• The chances of winning the California Lottery are one
chance in twenty-two million.
• There is a relationship between smoking cigarettes and
getting emphysema.
Descriptive and Inferential
Exercise:
1. Financial analysts say that mortgage may son hit
bottom.
2. The monthly average expenditures of per
household is P10,000.
3. The guard in the SM Megamall records the
number of shoppers for the past 15 days.
4. The Philippine Regulation Commission (PRC)
ranks the result of the Certified Public
Accountants professional examination in 2010.
Population
It consists of all subjects (human or
otherwise) that are being studied.
Example:
BISU Students
Filipino
Tourists
Boholana
…
Sample
A group of subjects selected from a population
Example:
Population Sample
Sample
A group of subjects selected from a population
Example:
Population Sample
BISU students
Filipino
Tourists
Boholana
Sample
A group of subjects selected from a population
Example:
Population Sample
BISU students Tourism students
Filipino Igorots
Tourists Korean who visits in 2018
Boholana Female Tagbilaranon
Variables and Types of Data
As stated in the first section, statisticians gain
information about a particular situation by
collecting data for random variables.
This section will explore greater detail the nature
of variables and types of data
Variables and Types of Data
Variables can be classified
as
Quantitative or Qualitative.
Qualitative Data
These are variables that can be placed into
distinct categories, according to some
characteristic or attributes.
Example
Gender (feminine, masculine, bisexual)
Sex(male, female)
…
Quantitative Data
These are variables are numerical and can be
ordered or ranked.
Example
Age, heights, weights, body temperatures
…
Exercise:
Classify the variables as qualitative or quantitative:
1. Automobile ownership of students.
2. Net weight (in grams) of package cereal.
3. Political party affiliation of civil service workers.
4. Number of bankrupt corporations per month in
the Philippines.
Quantitative Data
Quantitative variables can be further classified
into two groups:
Discrete and Continuous variables.
Discrete variables
These variables can be assigned values such as
0, 1, 2, 3 and are said to be countable.
Examples of discrete variables are the number
of children in a family, the number of student in
a classroom, the number of calls received by a
switchboard operator each day for a month.
Discrete variables
Assume values that can be
counted.
Continuous variables
These variables can assume an infinite
number of values between any two
specific values.
They are obtained by measuring.
They often include fractions and
decimals.
Exercise:
• Identify each item as discrete or continuous:
1. Outcomes in rolling a pair of dice.
2. Square root of two.
3. f(x)=x+3
4. Number of online purchases made in a week.
Variables
Qualitative Quantitative
ContinuousDiscrete
Level of Measurements
Nominal level of measurements
Ordinal Level of measurements
Interval level of measurements
Ratio level of measurements
Nominal Level of Measurements
• It classifies data into mutually exclusive categories in
which no order or ranking can be imposed on the
data.
Example:
Subjects
Classifying survey subjects such as male or female
Zipcodes
Religion
Marital status
Ordinal Level of Measurements
• Data measures in this level can be placed int
categories.
• These categories can be ordered or ranked.
Example:
Student evaluations
Guest speakers might be ranked as superior, average, or poor
Size (small, medium, large)
Interval Level of Measurement
• This level differs from the ordinal level in that
precise differences do exist between units.
Example:
many standardized psychological tests yield
values measured in an interval scale. IQ is an
example of Interval level;
Temperature
Ratio Level of Measurement
• It has a true zero point (complete absence of
the attitude being measured). Ratio data are
either discrete or continuous variables.
Example:
Weight, Age, Salary
Exercise:
• Determine the following as nominal, ordinal,
interval, ratio data.
1. SSS number
Exercise:
• Determine the following as nominal, ordinal,
interval, ratio data.
1. SSS number (nominal)
Exercise:
• Determine the following as nominal, ordinal,
interval, ratio data.
1. SSS number (nominal)
2. Military ranks
Exercise:
• Determine the following as nominal, ordinal,
interval, ratio data.
1. SSS number (nominal)
2. Military ranks (ordinal)
Exercise:
• Determine the following as nominal, ordinal,
interval, ratio data.
1. SSS number (nominal)
2. Military ranks (ordinal)
3. Temperature measured in Kelvin scale
Exercise:
• Determine the following as nominal, ordinal,
interval, ratio data.
1. SSS number (nominal)
2. Military ranks (ordinal)
3. Temperature measured in Kelvin scale (interval)
Exercise:
• Determine the following as nominal, ordinal,
interval, ratio data.
1. SSS number (nominal)
2. Military ranks (ordinal)
3. Temperature measured in Kelvin scale (interval)
4. The number of LRT passengers from Recto to
Santolan Station.
Exercise:
• Determine the following as nominal, ordinal,
interval, ratio data.
1. SSS number (nominal)
2. Military ranks (ordinal)
3. Temperature measured in Kelvin scale (interval)
4. The number of LRT passengers from Recto to
Santolan Station. (nominal)
5. Time required for engineers to do a certain
project. (ratio)
Random Sampling
1. Simple Random Sampling
2. Systematic Sampling
3. Stratified Sampling
4. Cluster Sampling
Random Sampling
1. Simple Random Sampling – a process of
selecting n sample size in the population via
random numbers or through lottery.
Random Sampling
1. Simple Random Sampling
2. Systematic Sampling – is a process of
selecting the kth element in the population
until the desired number of subjects or
respondents is attained.
Random Sampling
1. Simple Random Sampling
2. Systematic Sampling
3. Stratified Sampling – a process of subdividing
the population into subgroups or strata and
drawing members at random from each
subgroup or stratum.
Random Sampling
1. Simple Random Sampling
2. Systematic Sampling
3. Stratified Sampling
4. Cluster Sampling – a process of selecting
clusters from a population which is very large
or widely spread out over a wide
geographical area.
Non-Random Sampling
1. Convenience Sampling
2. Purposive Sampling
3. Quota Sampling
4. Snowball Sampling
Methods of Collecting Data
• Direct or Interview Method
• Indirect or Questionnaire Method
• Registration Method
• Observation method
• Experimental Method
Method of Presenting Data
• Textual Method
• Tabular Method
• Graphical Method
End of Chapter 1
“I hope you gained a lot”
Prepare for Chapter Quiz
Next meeting.
God Bless You!!!

statistics Lesson 1

  • 1.
    The Nature ofProbability and Statistics
  • 2.
    Outline • Descriptive andInferential Statistics • Variables and Types of Data • Data Collection and Sampling techniques
  • 3.
    Objectives After the endof this chapter, you should be able to A. Demonstrate knowledge of statistical terms B. Differentiate between the two branches of statistics C. Identify types of data D. Identify the measurement level for each variable
  • 4.
    Statistics It is thescience of conducting studies to collect, organize, summarize, analyze, and draw conclusions from data.
  • 5.
    Descriptive and Inferential •Variable – a characteristic or attribute that can assume different value. • Data – are values that the variables can assume. • Random Variables – variables whose values are determined by chance. • Data set – a collection of data values. • Data value – Each value in the data set.
  • 6.
    Examples: • Variables: acharacteristic or attribute that can assume different value. – Grades, gender, height,… • Data: are values that the variables can assume. – {89,98,99,100}, {male, female}, {50cm, 100cm, 89cm, …}
  • 7.
    Examples: • Random Variables:variables whose values are determined by chance. – Number of heads or tails in tossing a coin, results in tossing a die/s… • Data set: a collection of data values. – {89,98,99,100}, {male, female}, {50cm, 100cm, 89cm, …}.
  • 8.
    Descriptive and Inferential Datacan be used in different ways. The body of knowledge called statistics is divided into two main areas, depending on how data are used. The two areas are: •Descriptive statistics •Inferential statistics
  • 9.
    Descriptive and Inferential •Descriptive Statistics – consists of the collection, organization, summarization and presentation of data. Examples: Nine out of ten on-the-job fatalities are men. Expenditures for the cable industry were $5.66 billion in 1996. The national average annual medicine expenditure per person is $1052.
  • 10.
    • Inferential Statistics– it consist of generalizing from samples to populations, performing estimations and hypothesis tests, determining relationships among variables, and making predictions. – Example: • The chances of winning the California Lottery are one chance in twenty-two million. • There is a relationship between smoking cigarettes and getting emphysema. Descriptive and Inferential
  • 11.
    Exercise: 1. Financial analystssay that mortgage may son hit bottom. 2. The monthly average expenditures of per household is P10,000. 3. The guard in the SM Megamall records the number of shoppers for the past 15 days. 4. The Philippine Regulation Commission (PRC) ranks the result of the Certified Public Accountants professional examination in 2010.
  • 12.
    Population It consists ofall subjects (human or otherwise) that are being studied. Example: BISU Students Filipino Tourists Boholana …
  • 13.
    Sample A group ofsubjects selected from a population Example: Population Sample
  • 14.
    Sample A group ofsubjects selected from a population Example: Population Sample BISU students Filipino Tourists Boholana
  • 15.
    Sample A group ofsubjects selected from a population Example: Population Sample BISU students Tourism students Filipino Igorots Tourists Korean who visits in 2018 Boholana Female Tagbilaranon
  • 17.
    Variables and Typesof Data As stated in the first section, statisticians gain information about a particular situation by collecting data for random variables. This section will explore greater detail the nature of variables and types of data
  • 18.
    Variables and Typesof Data Variables can be classified as Quantitative or Qualitative.
  • 19.
    Qualitative Data These arevariables that can be placed into distinct categories, according to some characteristic or attributes. Example Gender (feminine, masculine, bisexual) Sex(male, female) …
  • 20.
    Quantitative Data These arevariables are numerical and can be ordered or ranked. Example Age, heights, weights, body temperatures …
  • 21.
    Exercise: Classify the variablesas qualitative or quantitative: 1. Automobile ownership of students. 2. Net weight (in grams) of package cereal. 3. Political party affiliation of civil service workers. 4. Number of bankrupt corporations per month in the Philippines.
  • 22.
    Quantitative Data Quantitative variablescan be further classified into two groups: Discrete and Continuous variables.
  • 23.
    Discrete variables These variablescan be assigned values such as 0, 1, 2, 3 and are said to be countable. Examples of discrete variables are the number of children in a family, the number of student in a classroom, the number of calls received by a switchboard operator each day for a month.
  • 24.
  • 25.
    Continuous variables These variablescan assume an infinite number of values between any two specific values. They are obtained by measuring. They often include fractions and decimals.
  • 26.
    Exercise: • Identify eachitem as discrete or continuous: 1. Outcomes in rolling a pair of dice. 2. Square root of two. 3. f(x)=x+3 4. Number of online purchases made in a week.
  • 27.
  • 28.
    Level of Measurements Nominallevel of measurements Ordinal Level of measurements Interval level of measurements Ratio level of measurements
  • 29.
    Nominal Level ofMeasurements • It classifies data into mutually exclusive categories in which no order or ranking can be imposed on the data. Example: Subjects Classifying survey subjects such as male or female Zipcodes Religion Marital status
  • 30.
    Ordinal Level ofMeasurements • Data measures in this level can be placed int categories. • These categories can be ordered or ranked. Example: Student evaluations Guest speakers might be ranked as superior, average, or poor Size (small, medium, large)
  • 31.
    Interval Level ofMeasurement • This level differs from the ordinal level in that precise differences do exist between units. Example: many standardized psychological tests yield values measured in an interval scale. IQ is an example of Interval level; Temperature
  • 32.
    Ratio Level ofMeasurement • It has a true zero point (complete absence of the attitude being measured). Ratio data are either discrete or continuous variables. Example: Weight, Age, Salary
  • 33.
    Exercise: • Determine thefollowing as nominal, ordinal, interval, ratio data. 1. SSS number
  • 34.
    Exercise: • Determine thefollowing as nominal, ordinal, interval, ratio data. 1. SSS number (nominal)
  • 35.
    Exercise: • Determine thefollowing as nominal, ordinal, interval, ratio data. 1. SSS number (nominal) 2. Military ranks
  • 36.
    Exercise: • Determine thefollowing as nominal, ordinal, interval, ratio data. 1. SSS number (nominal) 2. Military ranks (ordinal)
  • 37.
    Exercise: • Determine thefollowing as nominal, ordinal, interval, ratio data. 1. SSS number (nominal) 2. Military ranks (ordinal) 3. Temperature measured in Kelvin scale
  • 38.
    Exercise: • Determine thefollowing as nominal, ordinal, interval, ratio data. 1. SSS number (nominal) 2. Military ranks (ordinal) 3. Temperature measured in Kelvin scale (interval)
  • 39.
    Exercise: • Determine thefollowing as nominal, ordinal, interval, ratio data. 1. SSS number (nominal) 2. Military ranks (ordinal) 3. Temperature measured in Kelvin scale (interval) 4. The number of LRT passengers from Recto to Santolan Station.
  • 40.
    Exercise: • Determine thefollowing as nominal, ordinal, interval, ratio data. 1. SSS number (nominal) 2. Military ranks (ordinal) 3. Temperature measured in Kelvin scale (interval) 4. The number of LRT passengers from Recto to Santolan Station. (nominal) 5. Time required for engineers to do a certain project. (ratio)
  • 41.
    Random Sampling 1. SimpleRandom Sampling 2. Systematic Sampling 3. Stratified Sampling 4. Cluster Sampling
  • 42.
    Random Sampling 1. SimpleRandom Sampling – a process of selecting n sample size in the population via random numbers or through lottery.
  • 43.
    Random Sampling 1. SimpleRandom Sampling 2. Systematic Sampling – is a process of selecting the kth element in the population until the desired number of subjects or respondents is attained.
  • 44.
    Random Sampling 1. SimpleRandom Sampling 2. Systematic Sampling 3. Stratified Sampling – a process of subdividing the population into subgroups or strata and drawing members at random from each subgroup or stratum.
  • 45.
    Random Sampling 1. SimpleRandom Sampling 2. Systematic Sampling 3. Stratified Sampling 4. Cluster Sampling – a process of selecting clusters from a population which is very large or widely spread out over a wide geographical area.
  • 46.
    Non-Random Sampling 1. ConvenienceSampling 2. Purposive Sampling 3. Quota Sampling 4. Snowball Sampling
  • 47.
    Methods of CollectingData • Direct or Interview Method • Indirect or Questionnaire Method • Registration Method • Observation method • Experimental Method
  • 48.
    Method of PresentingData • Textual Method • Tabular Method • Graphical Method
  • 49.
    End of Chapter1 “I hope you gained a lot” Prepare for Chapter Quiz Next meeting. God Bless You!!!