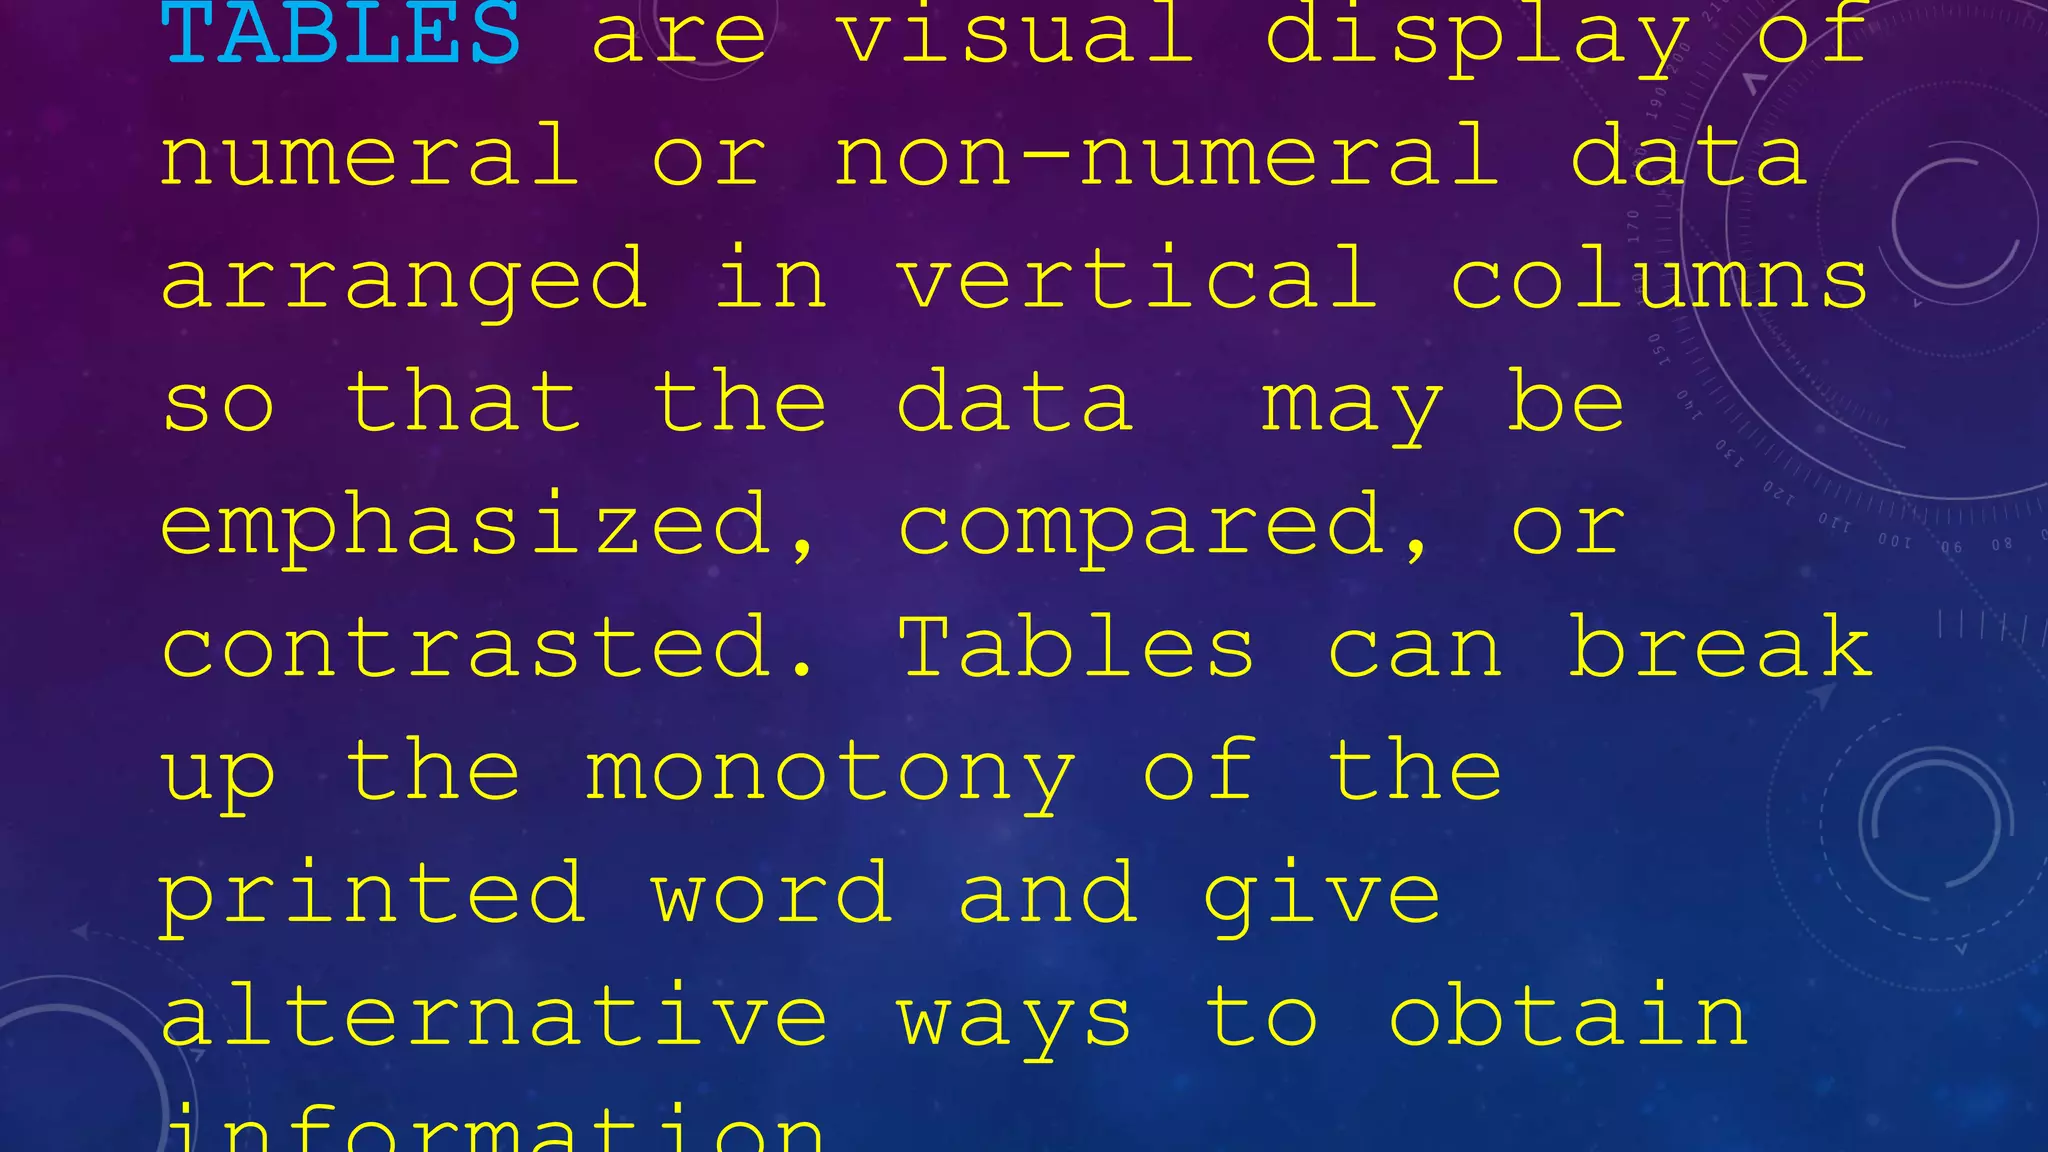
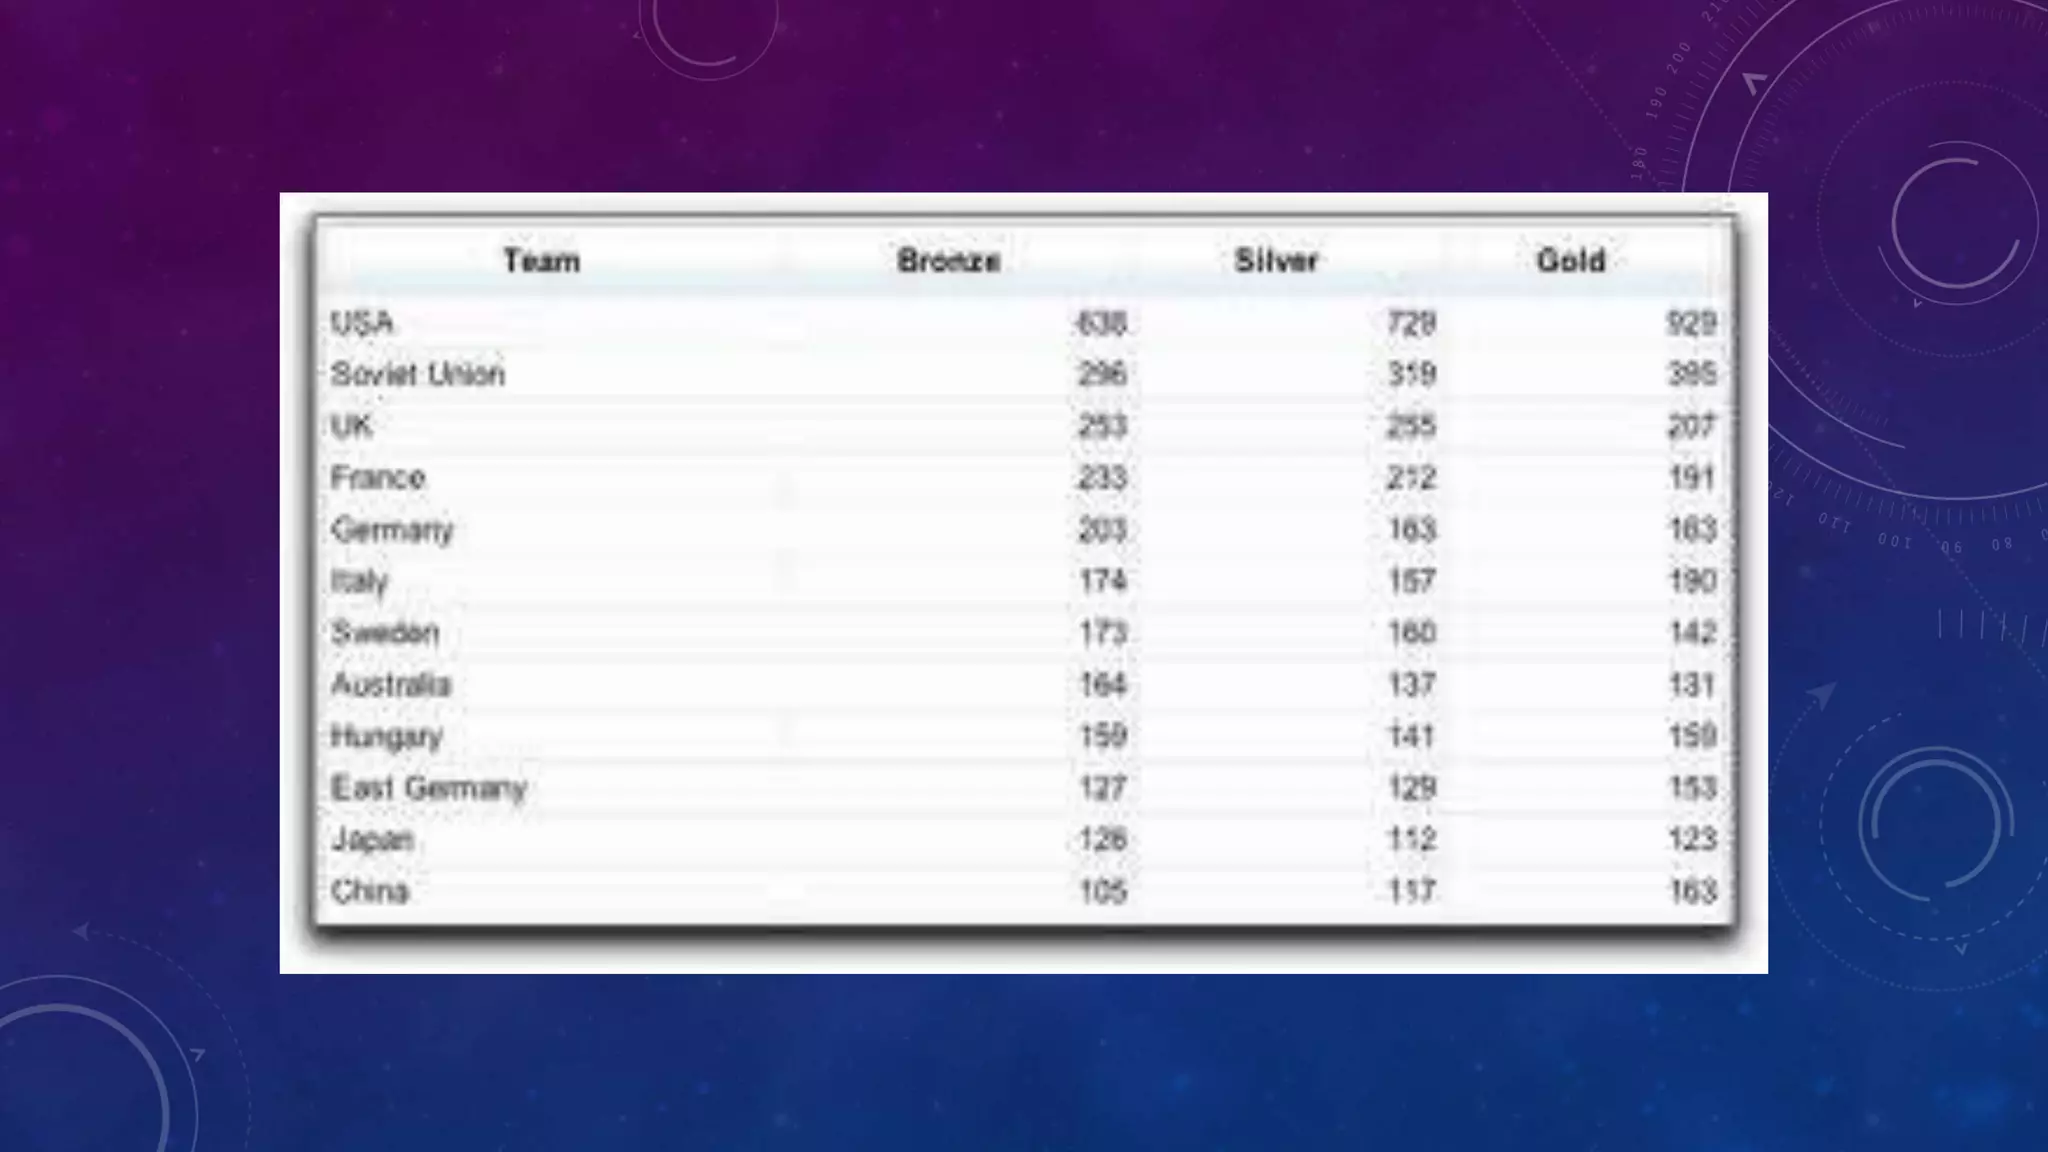
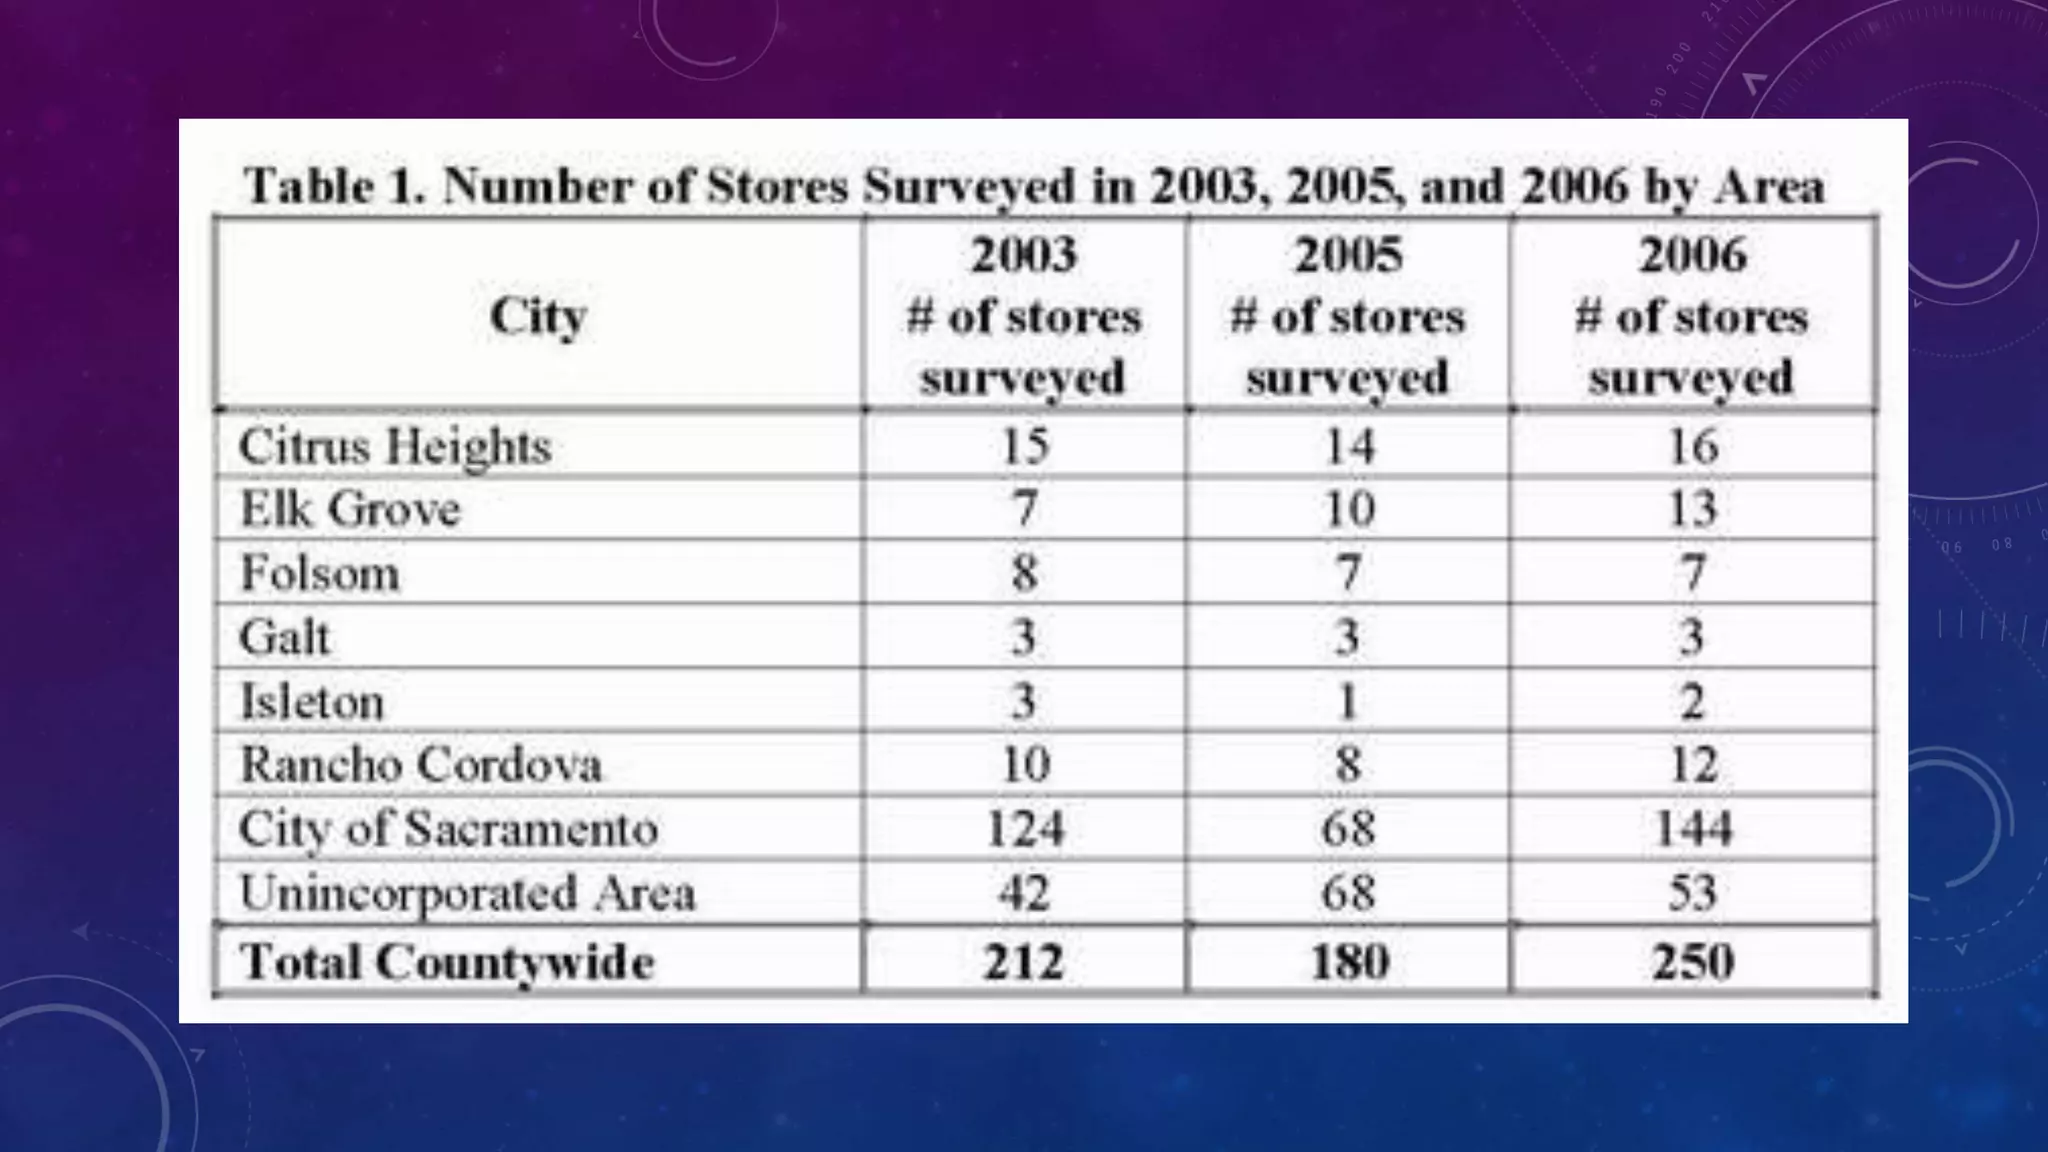
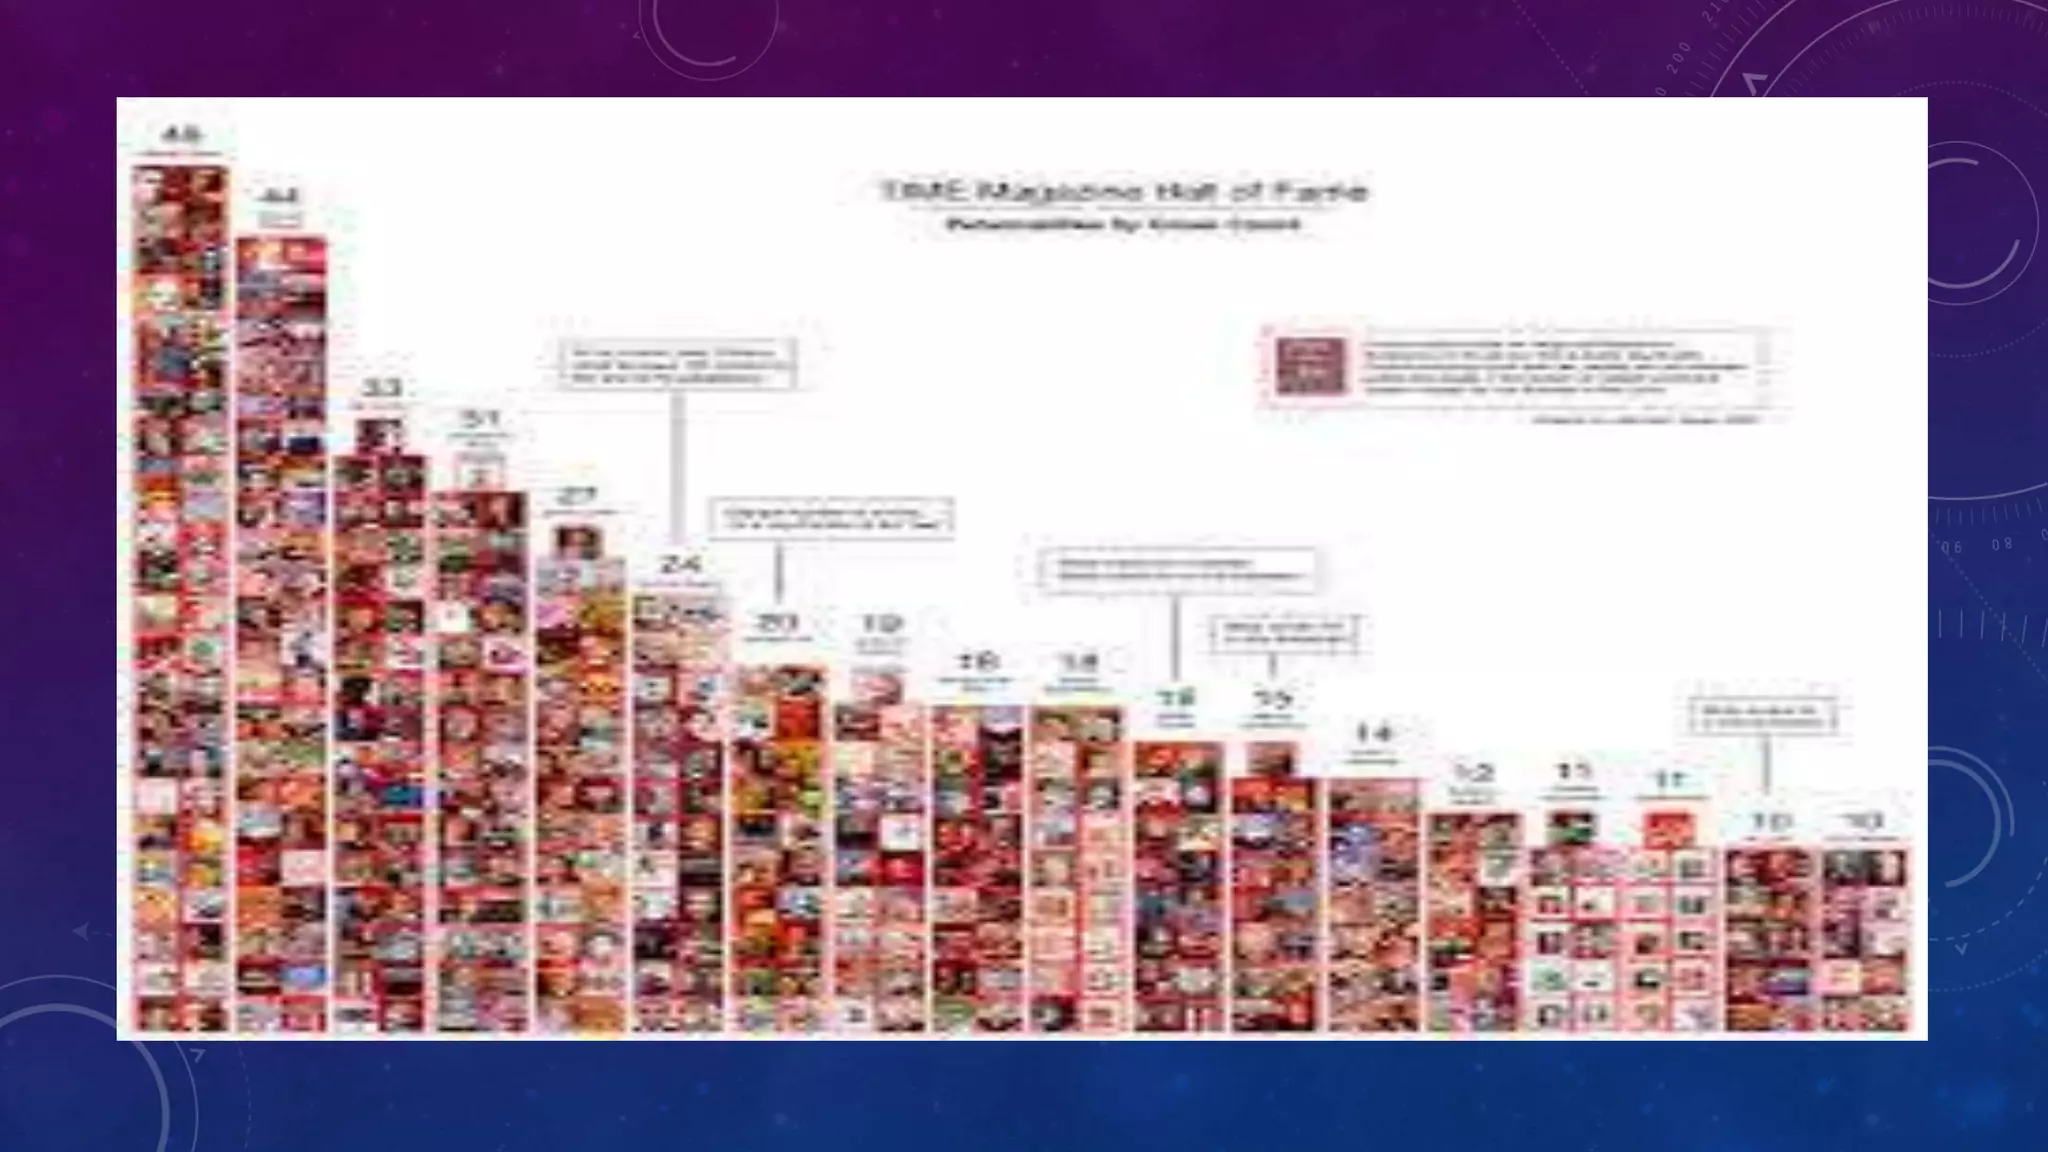
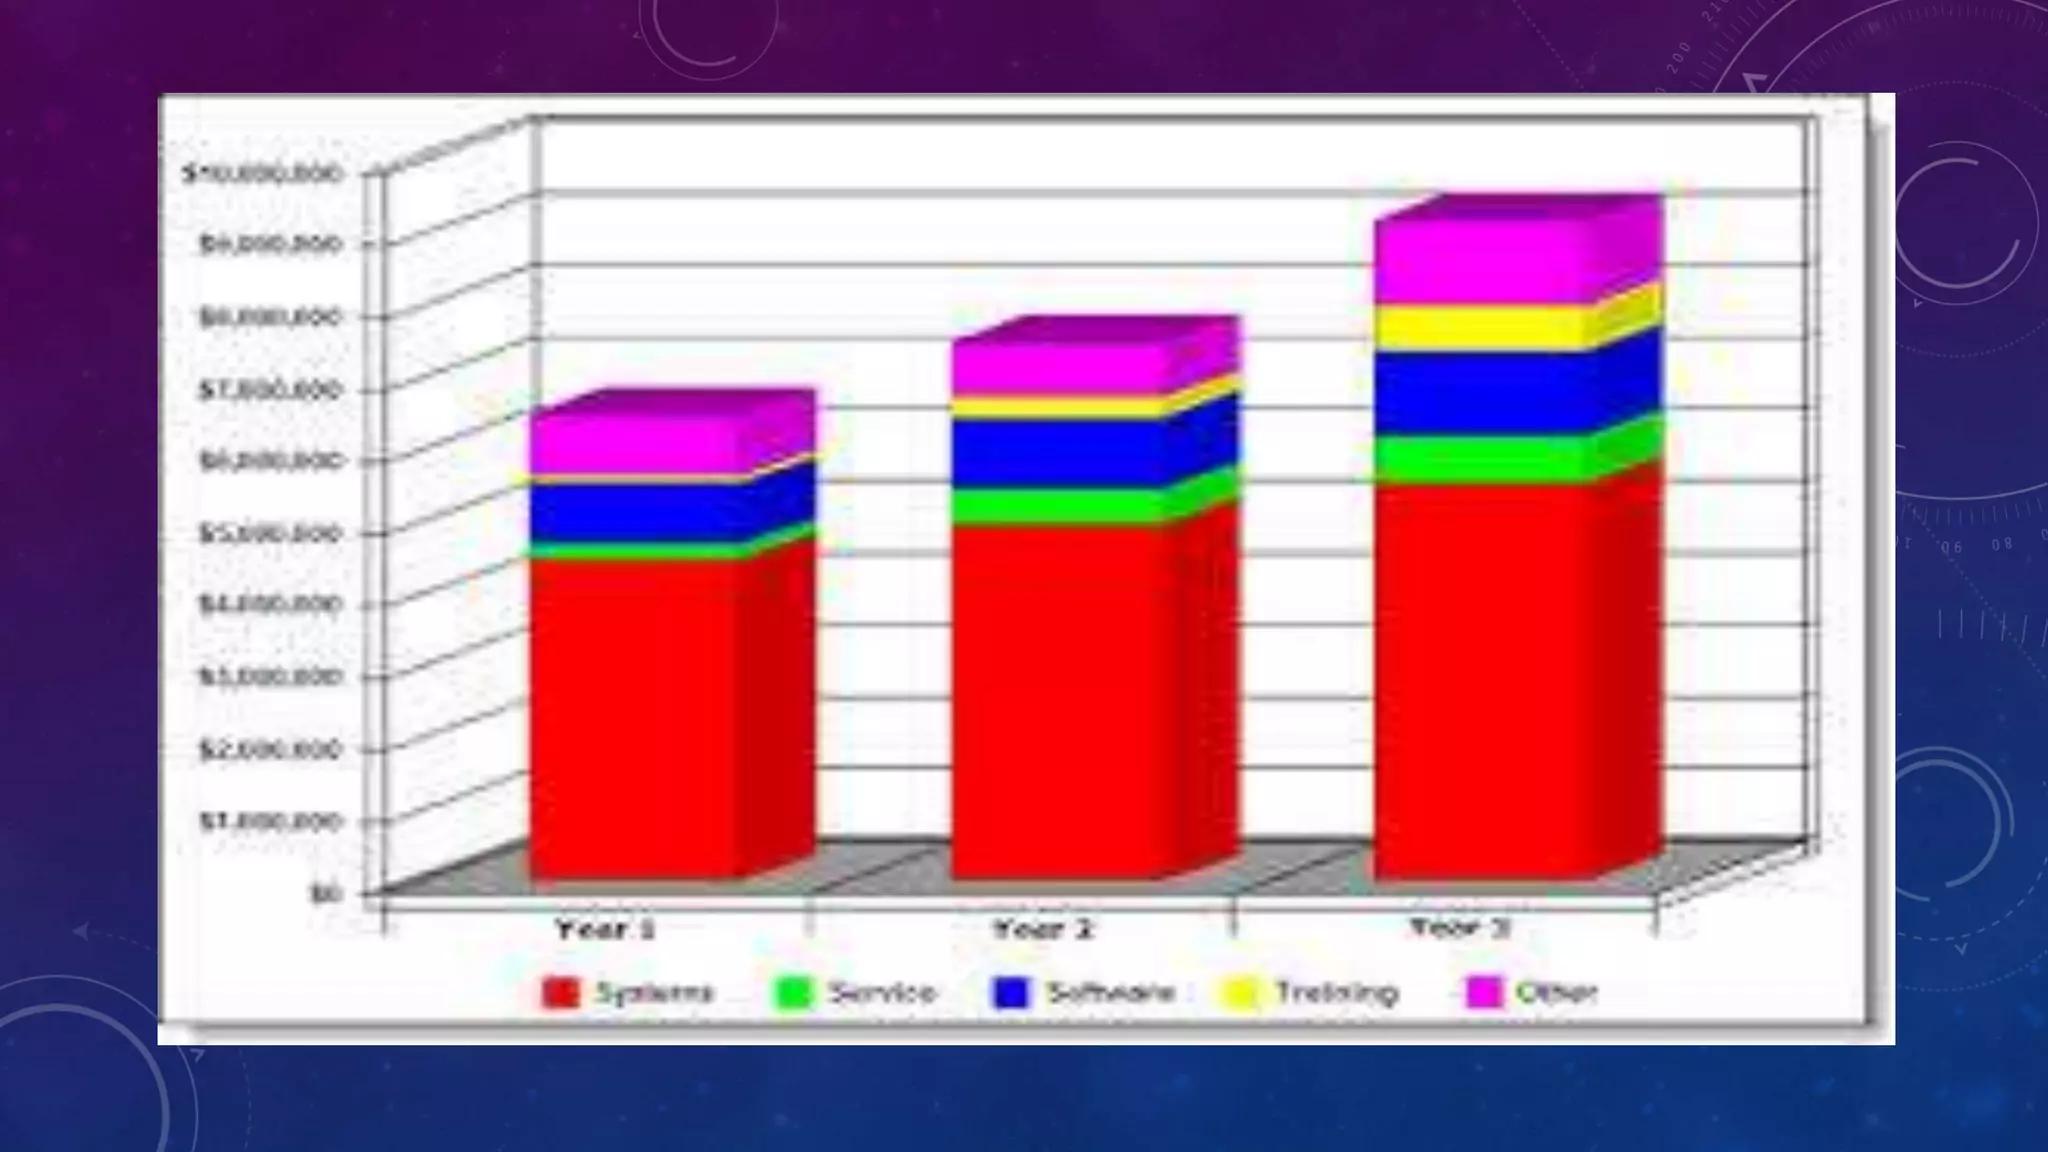
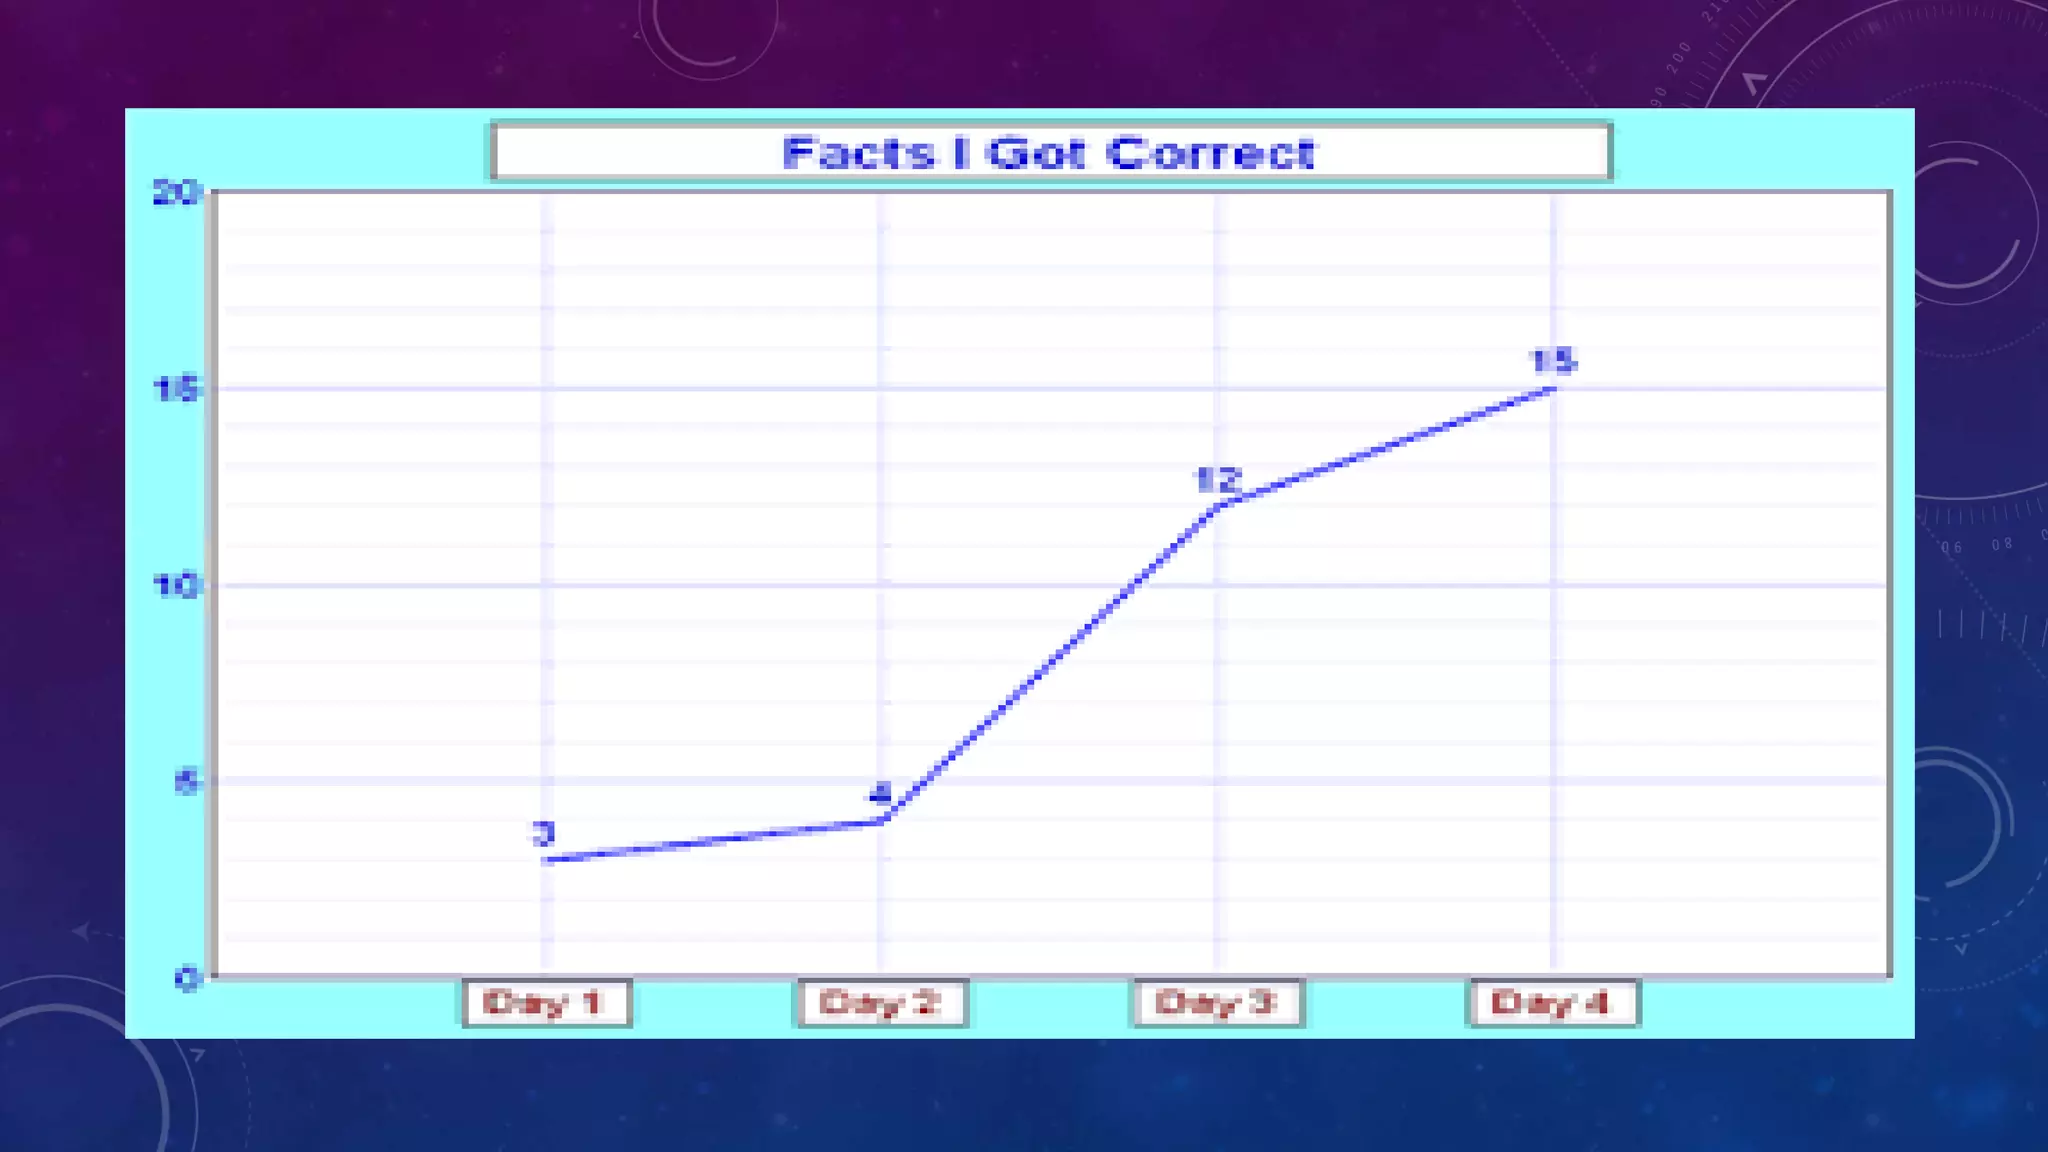
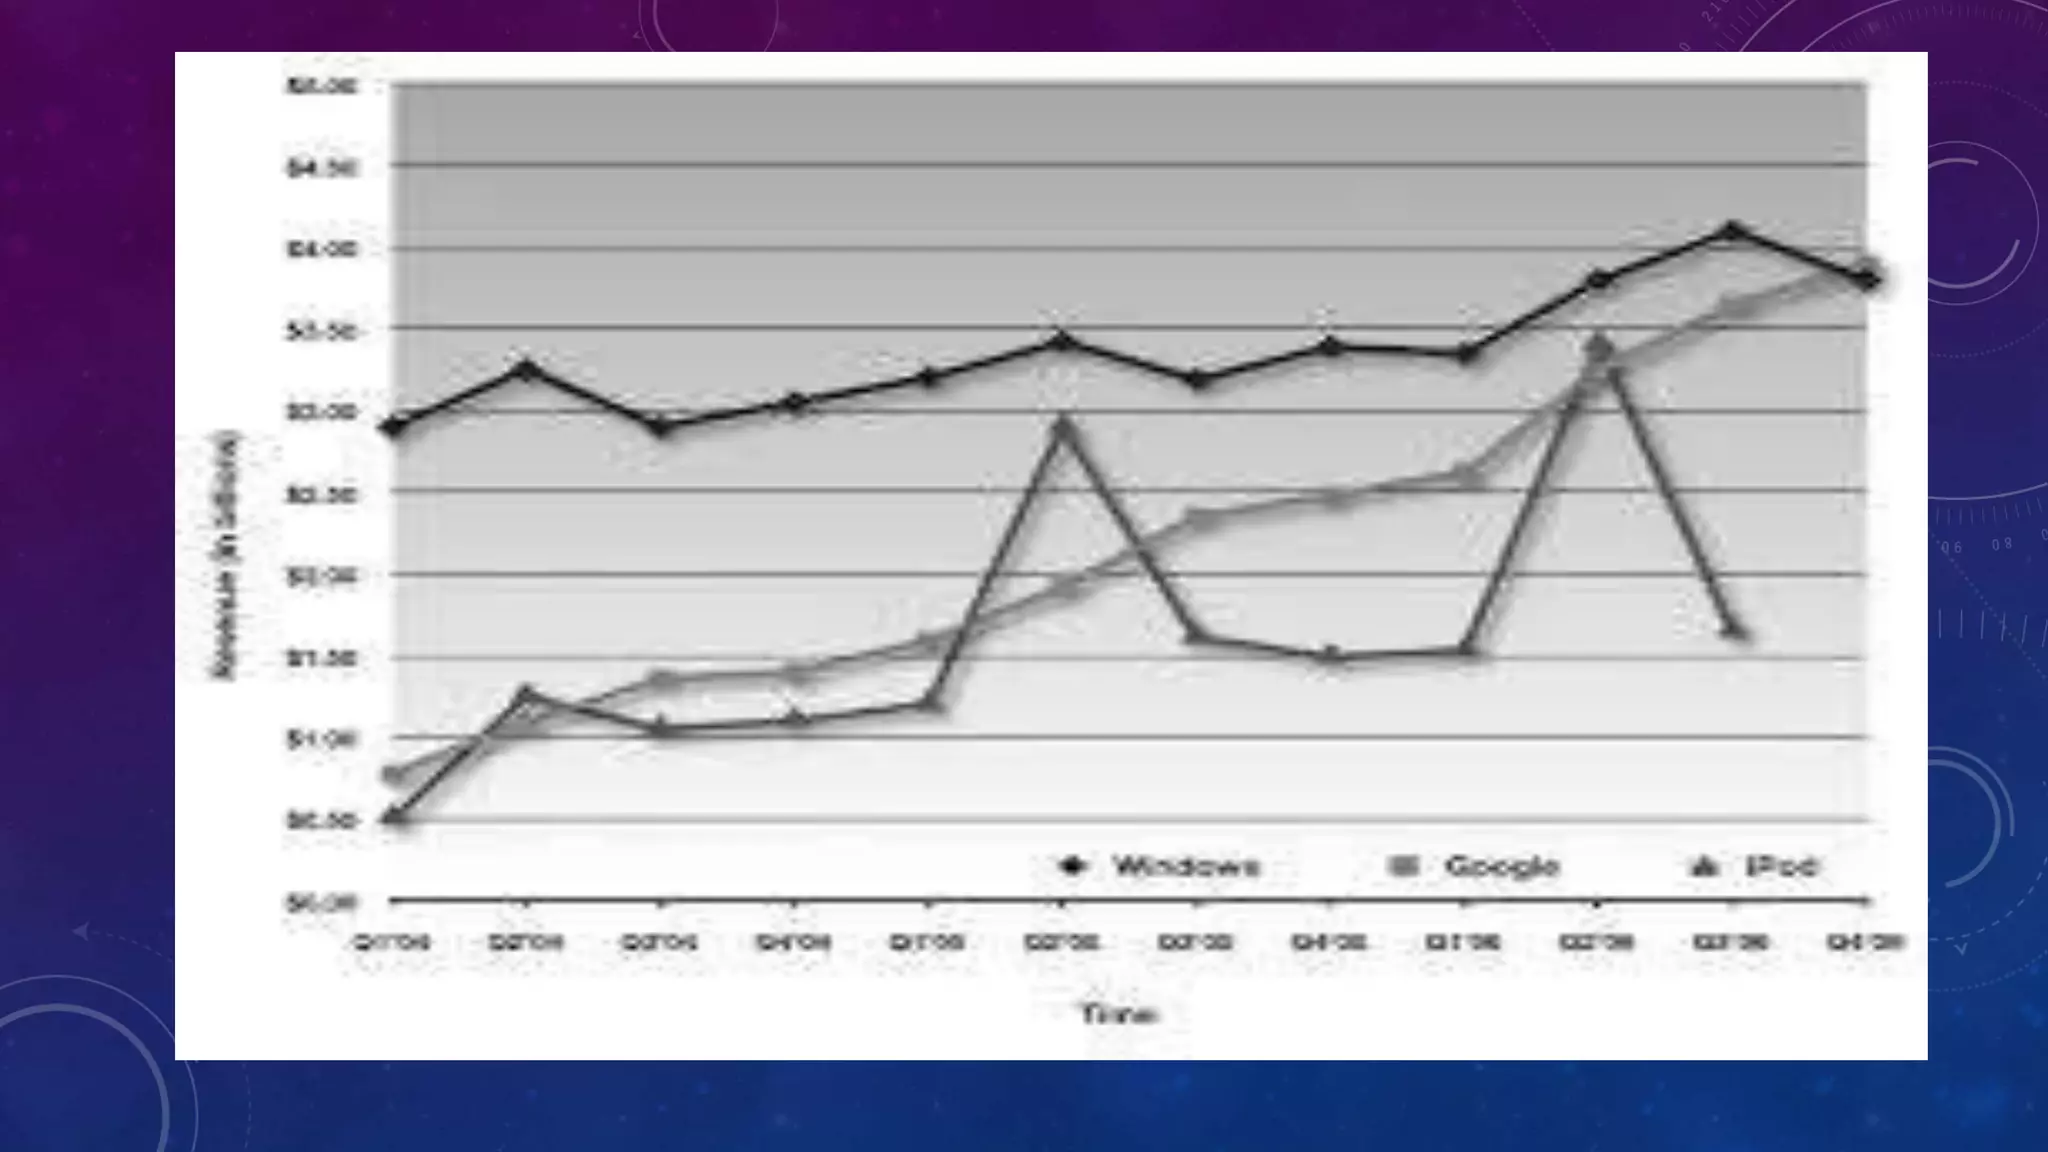
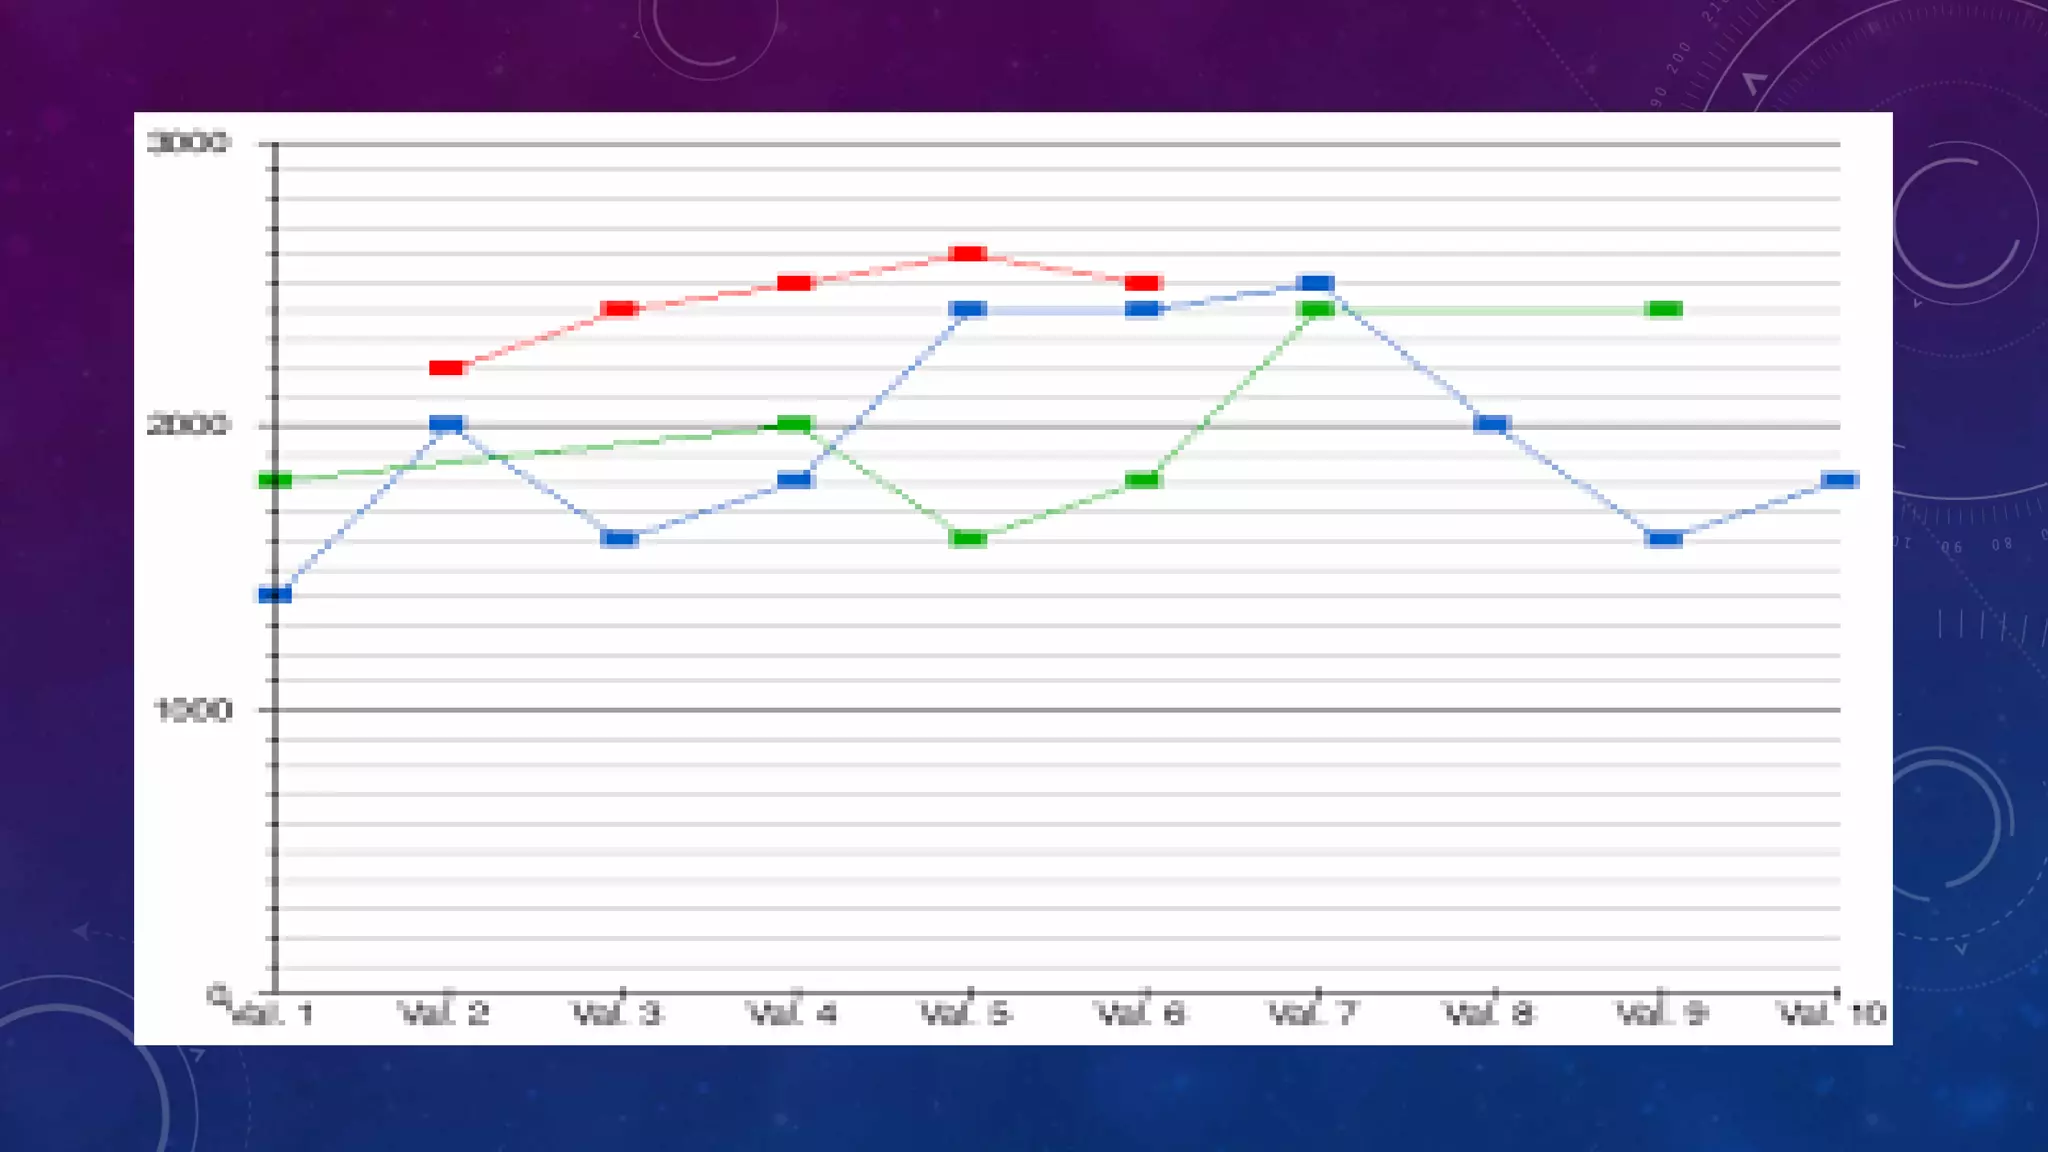
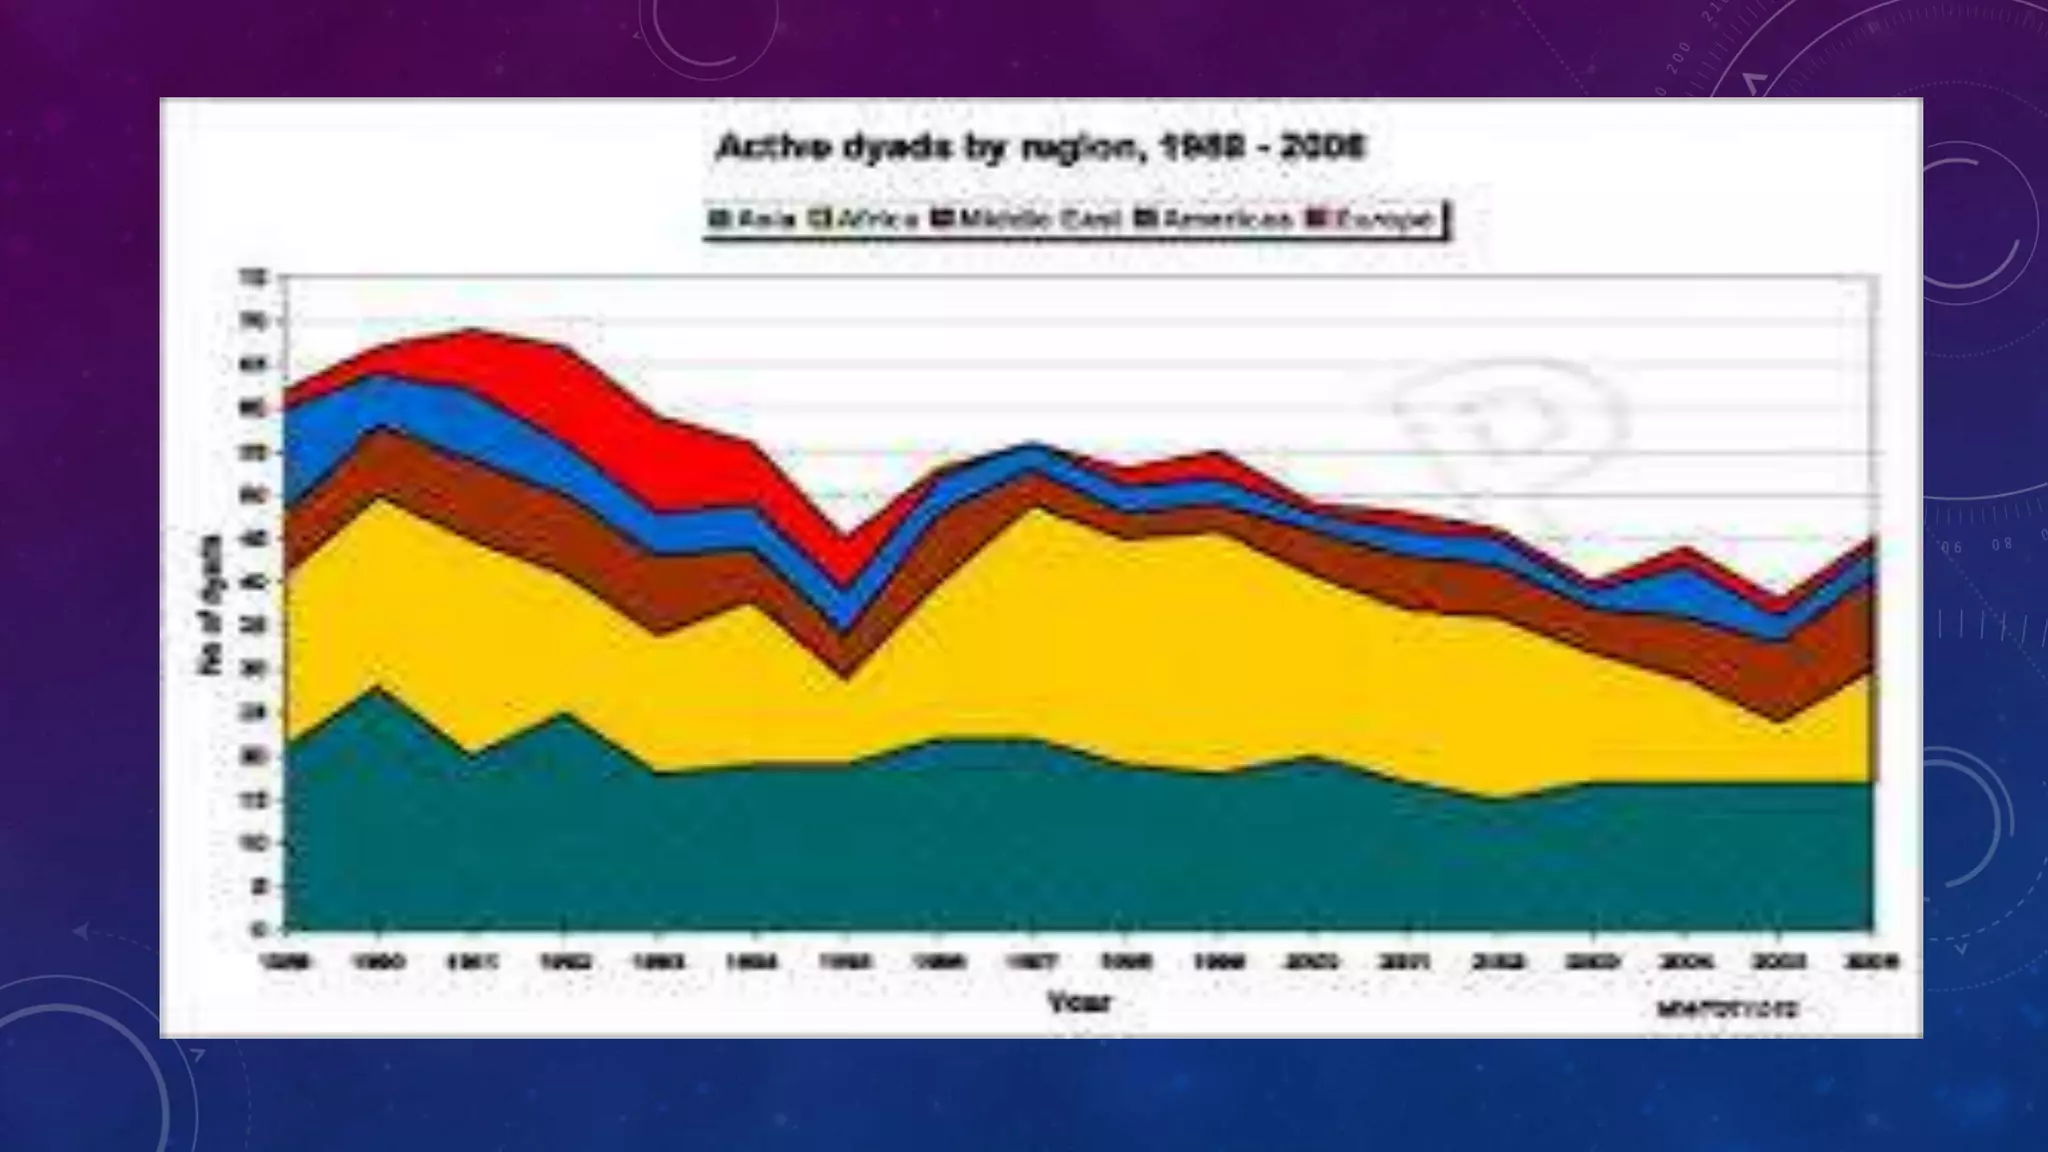
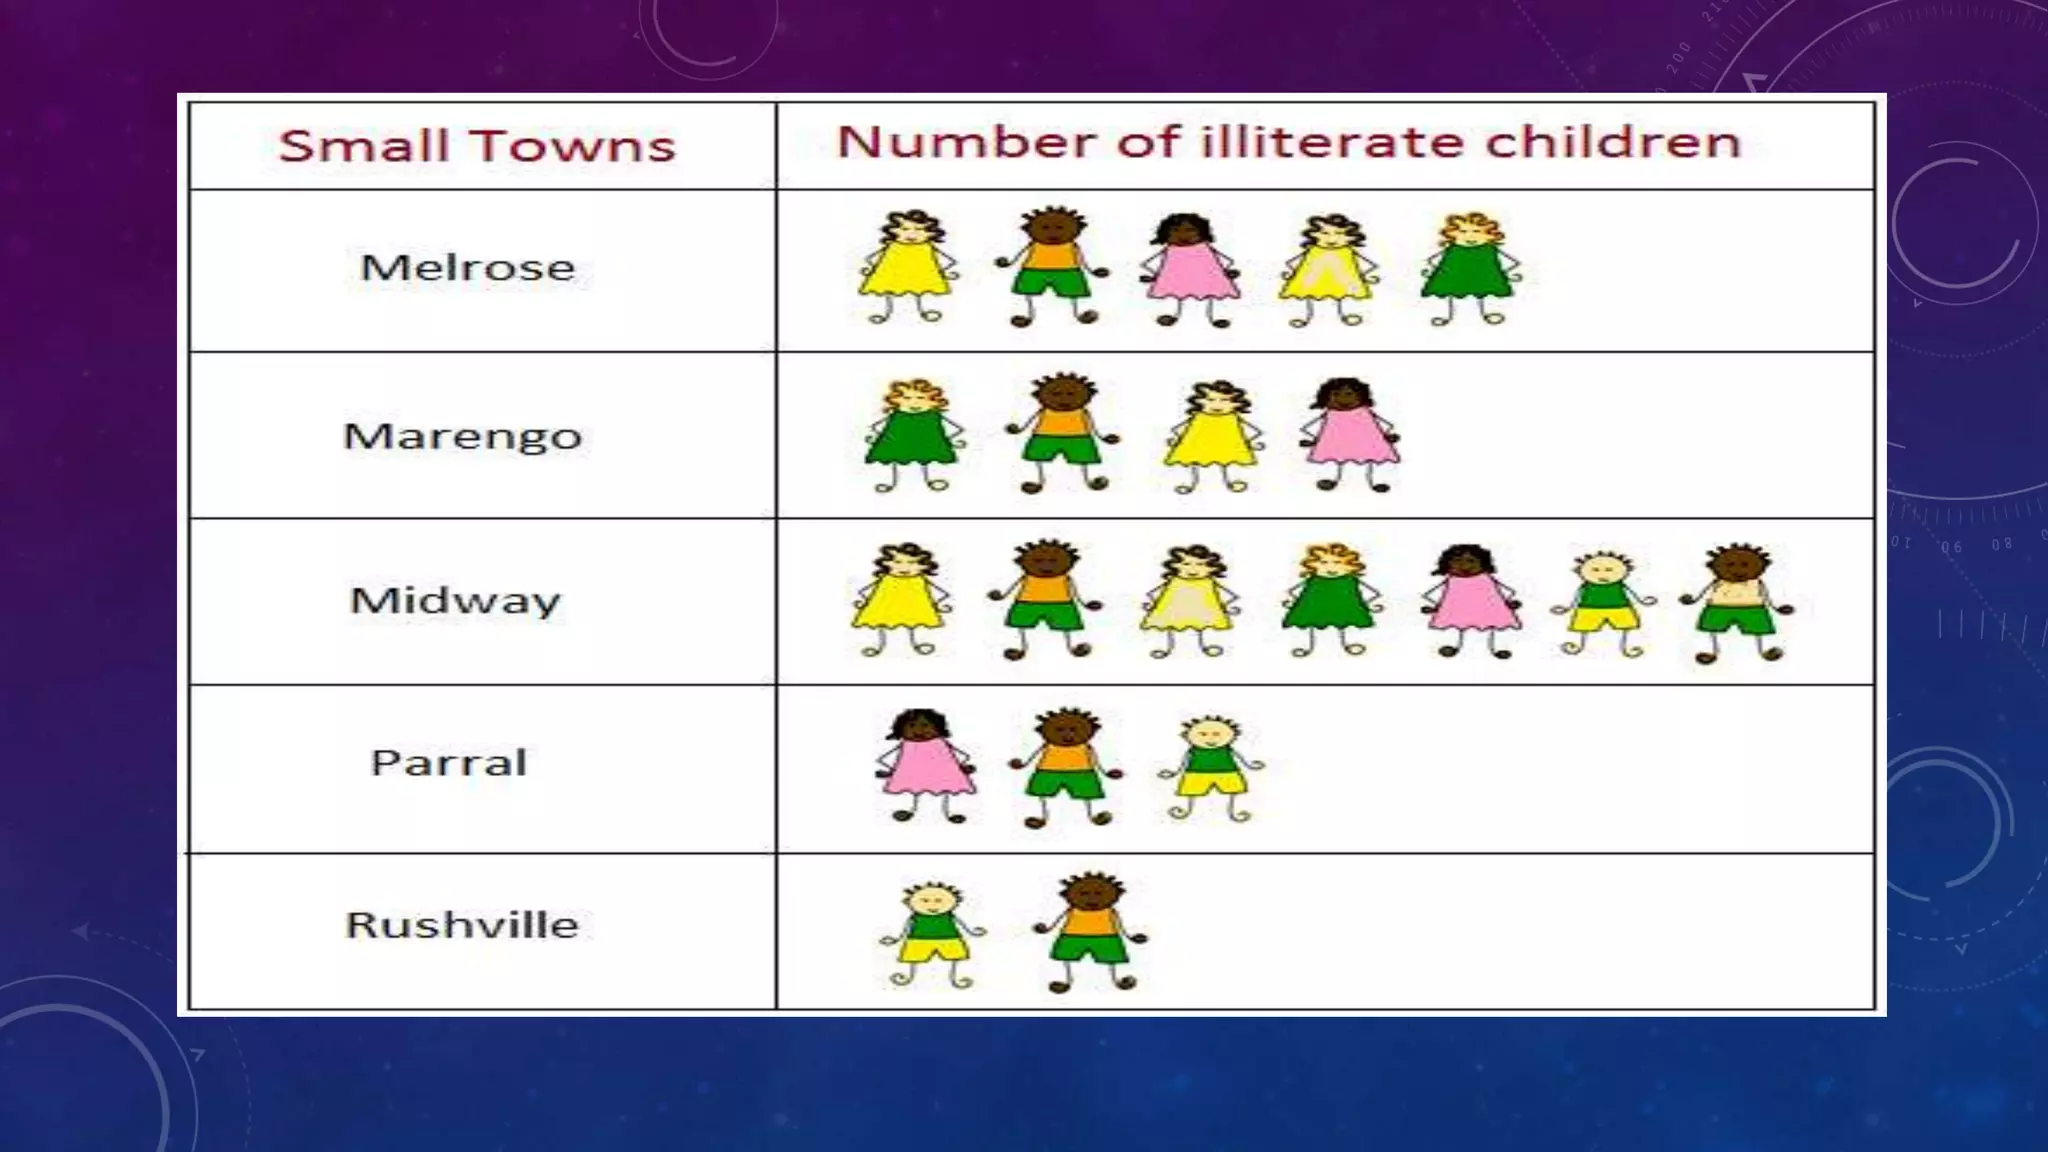
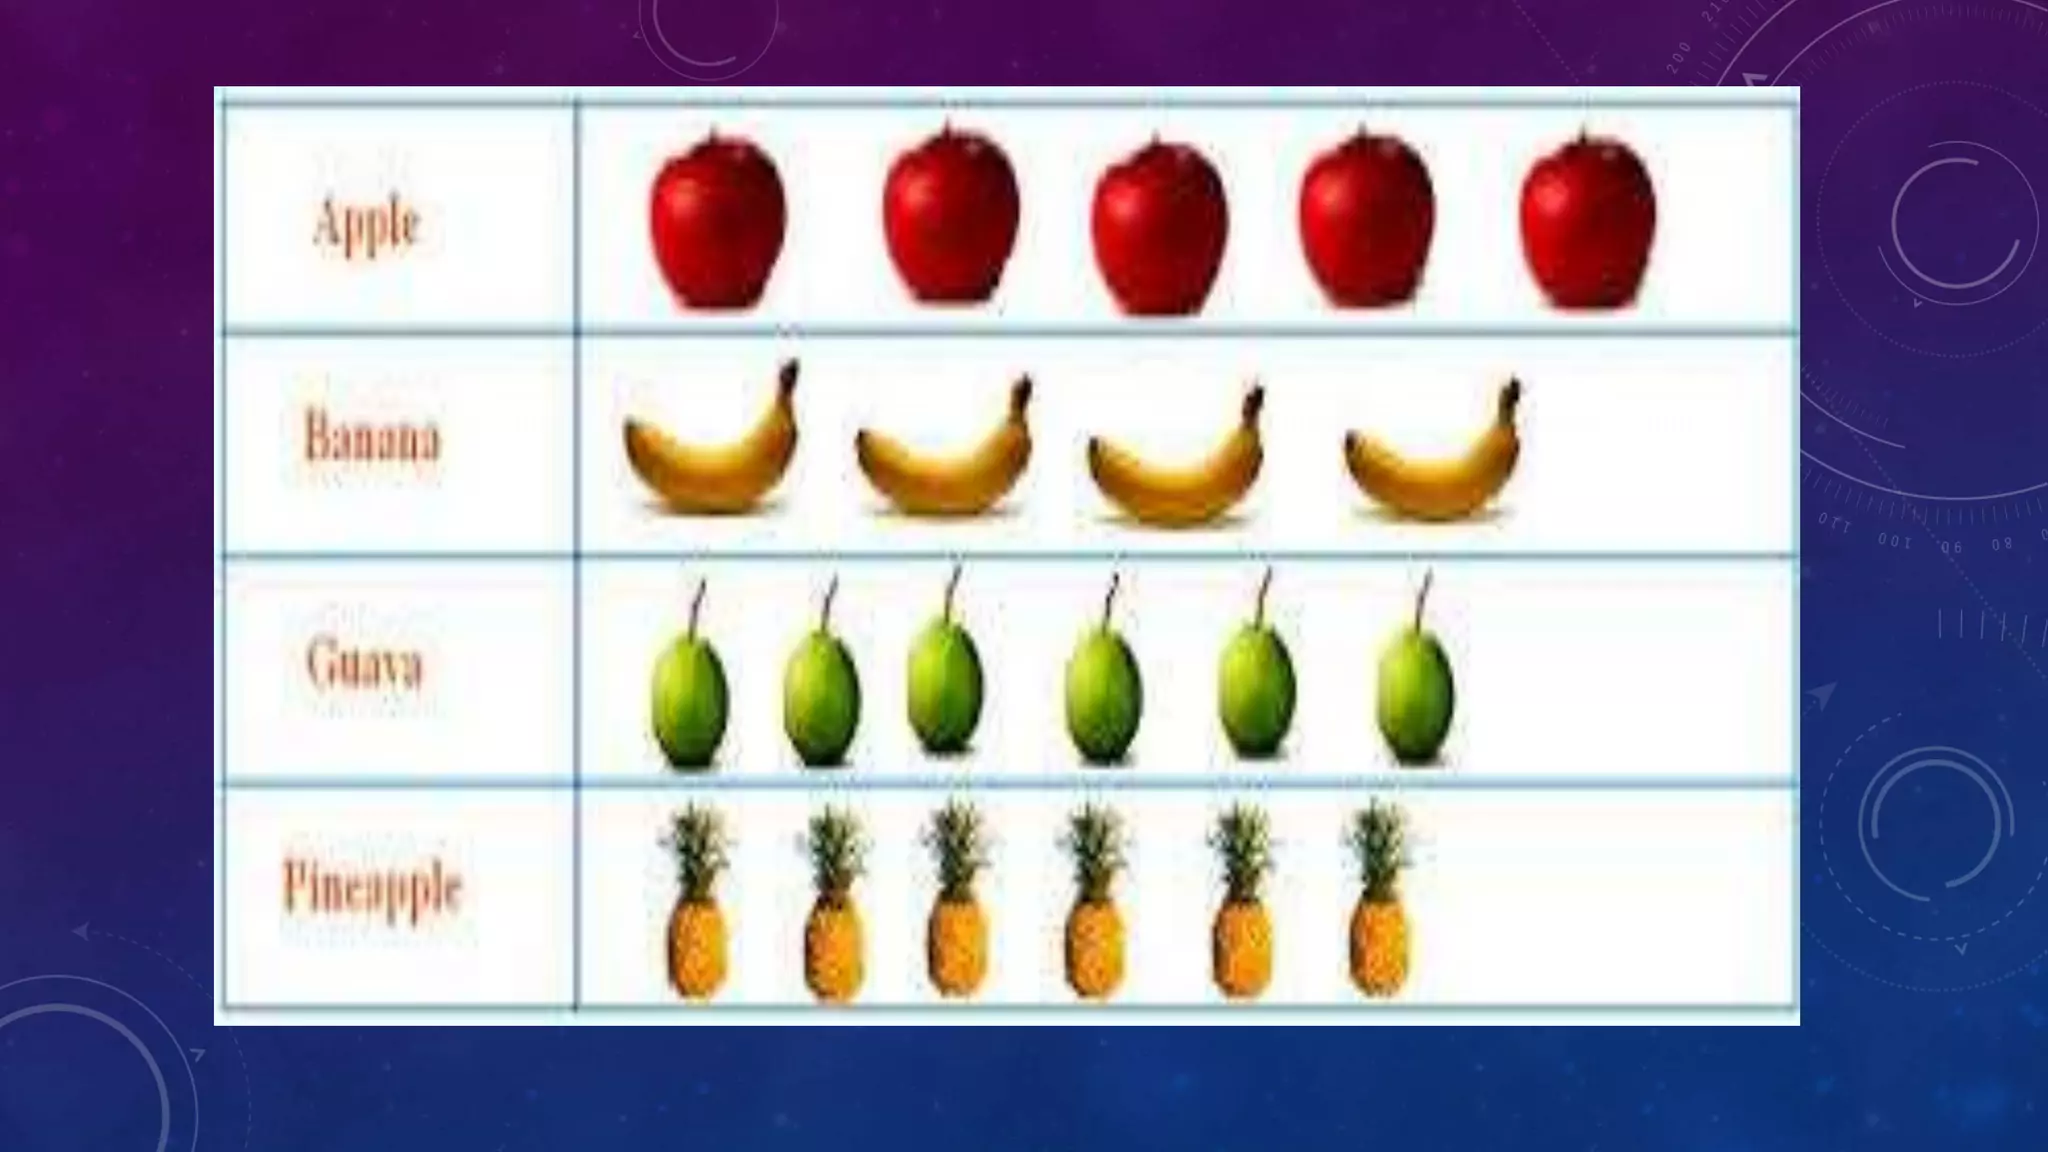
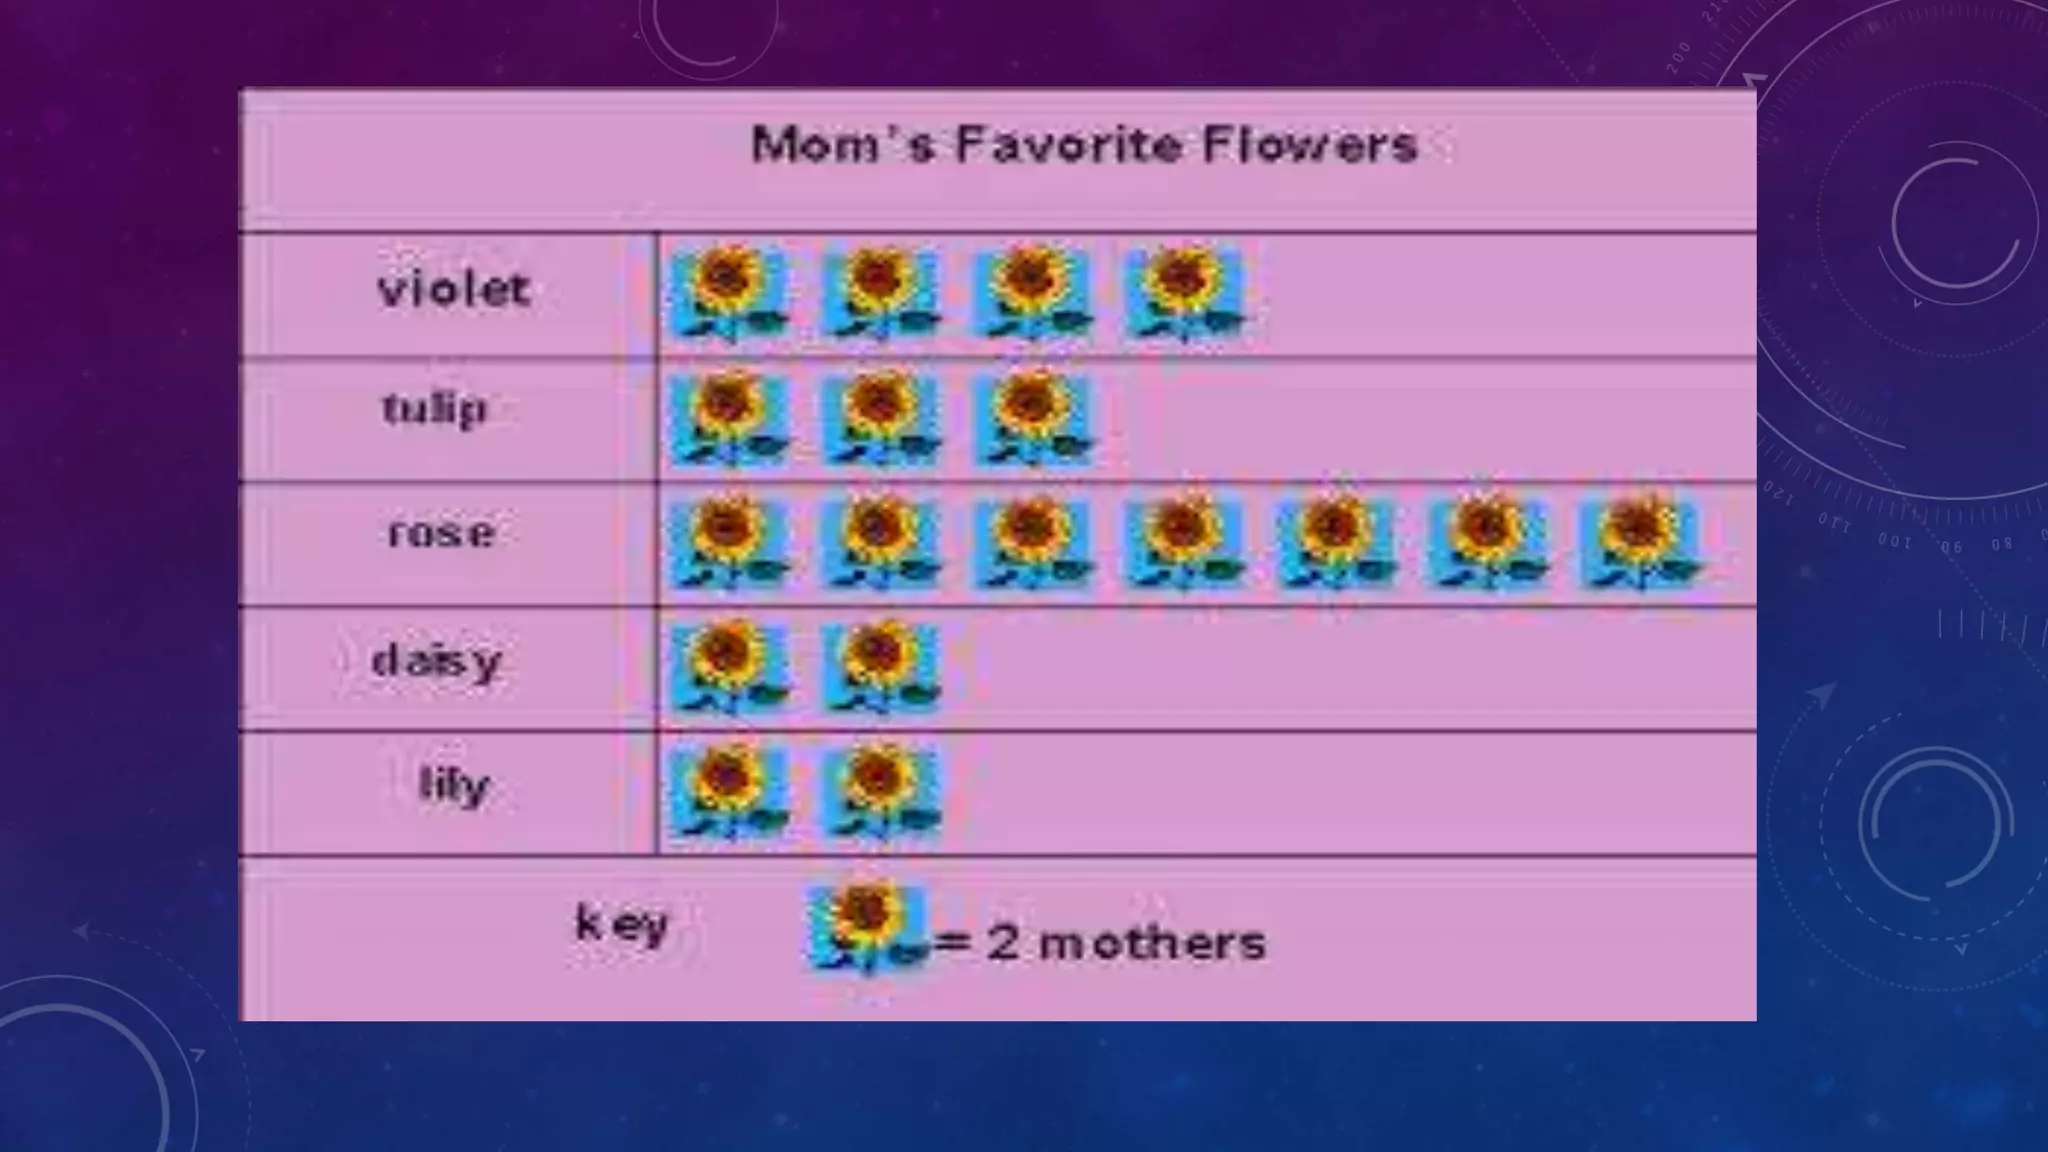
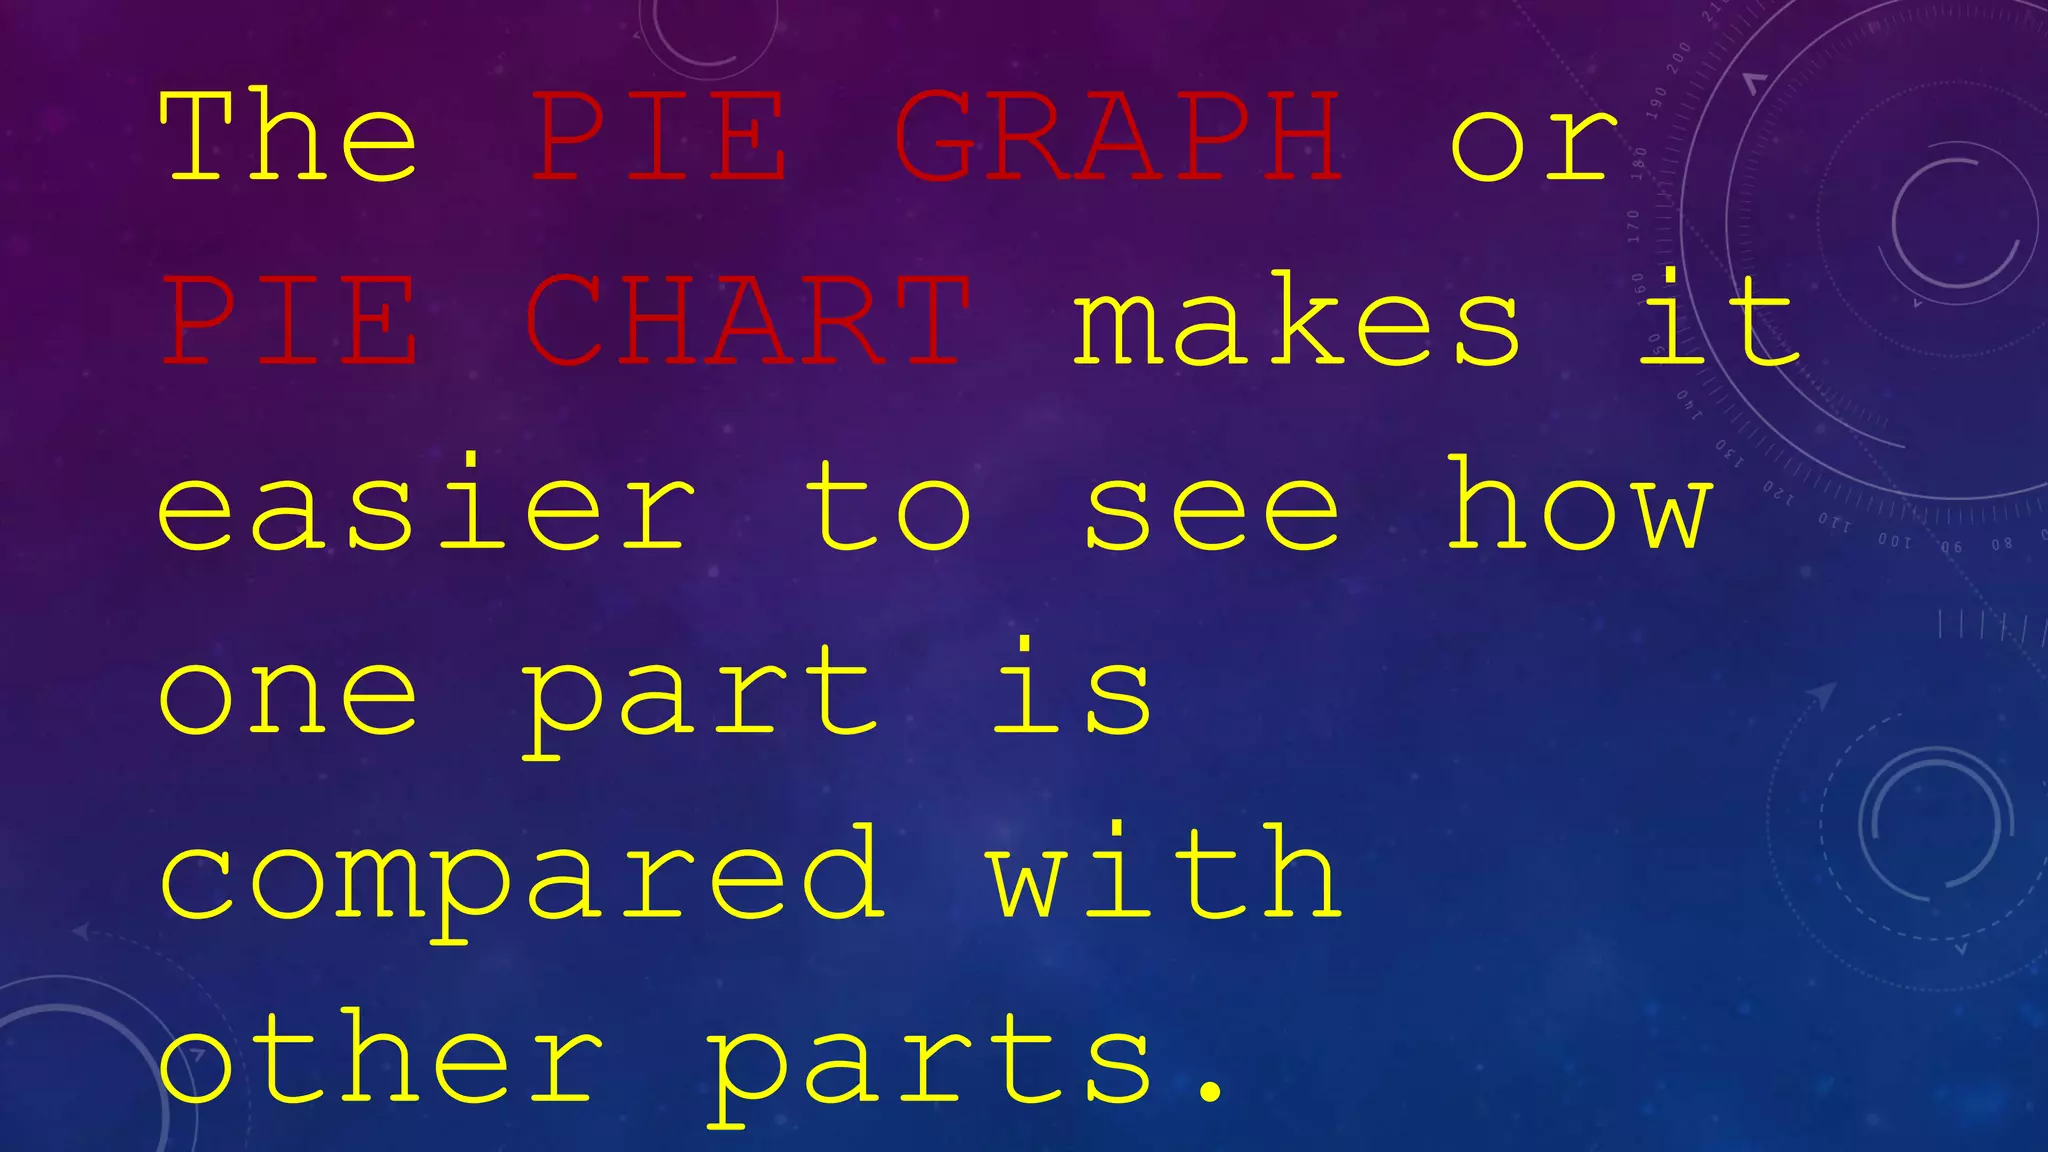
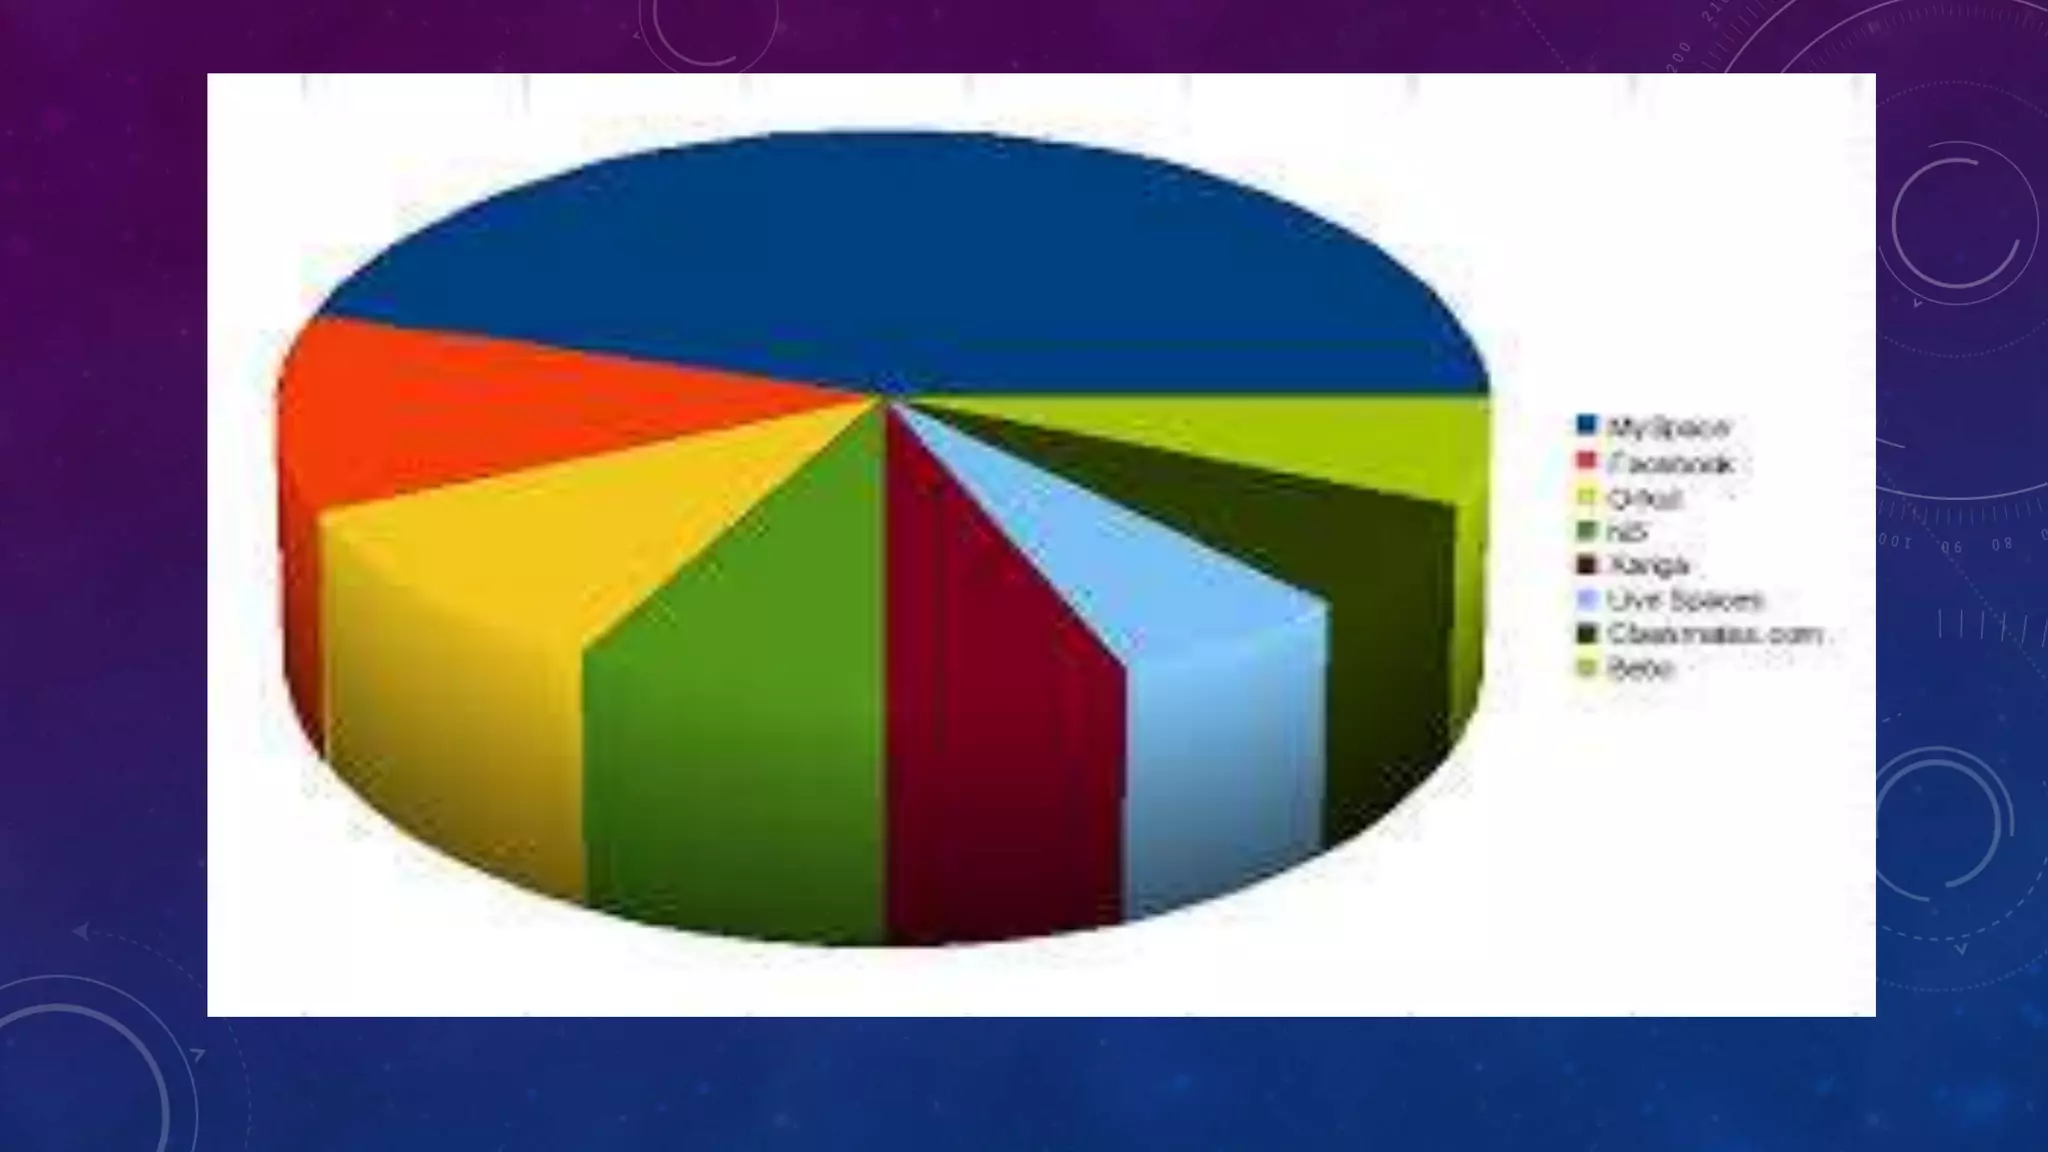
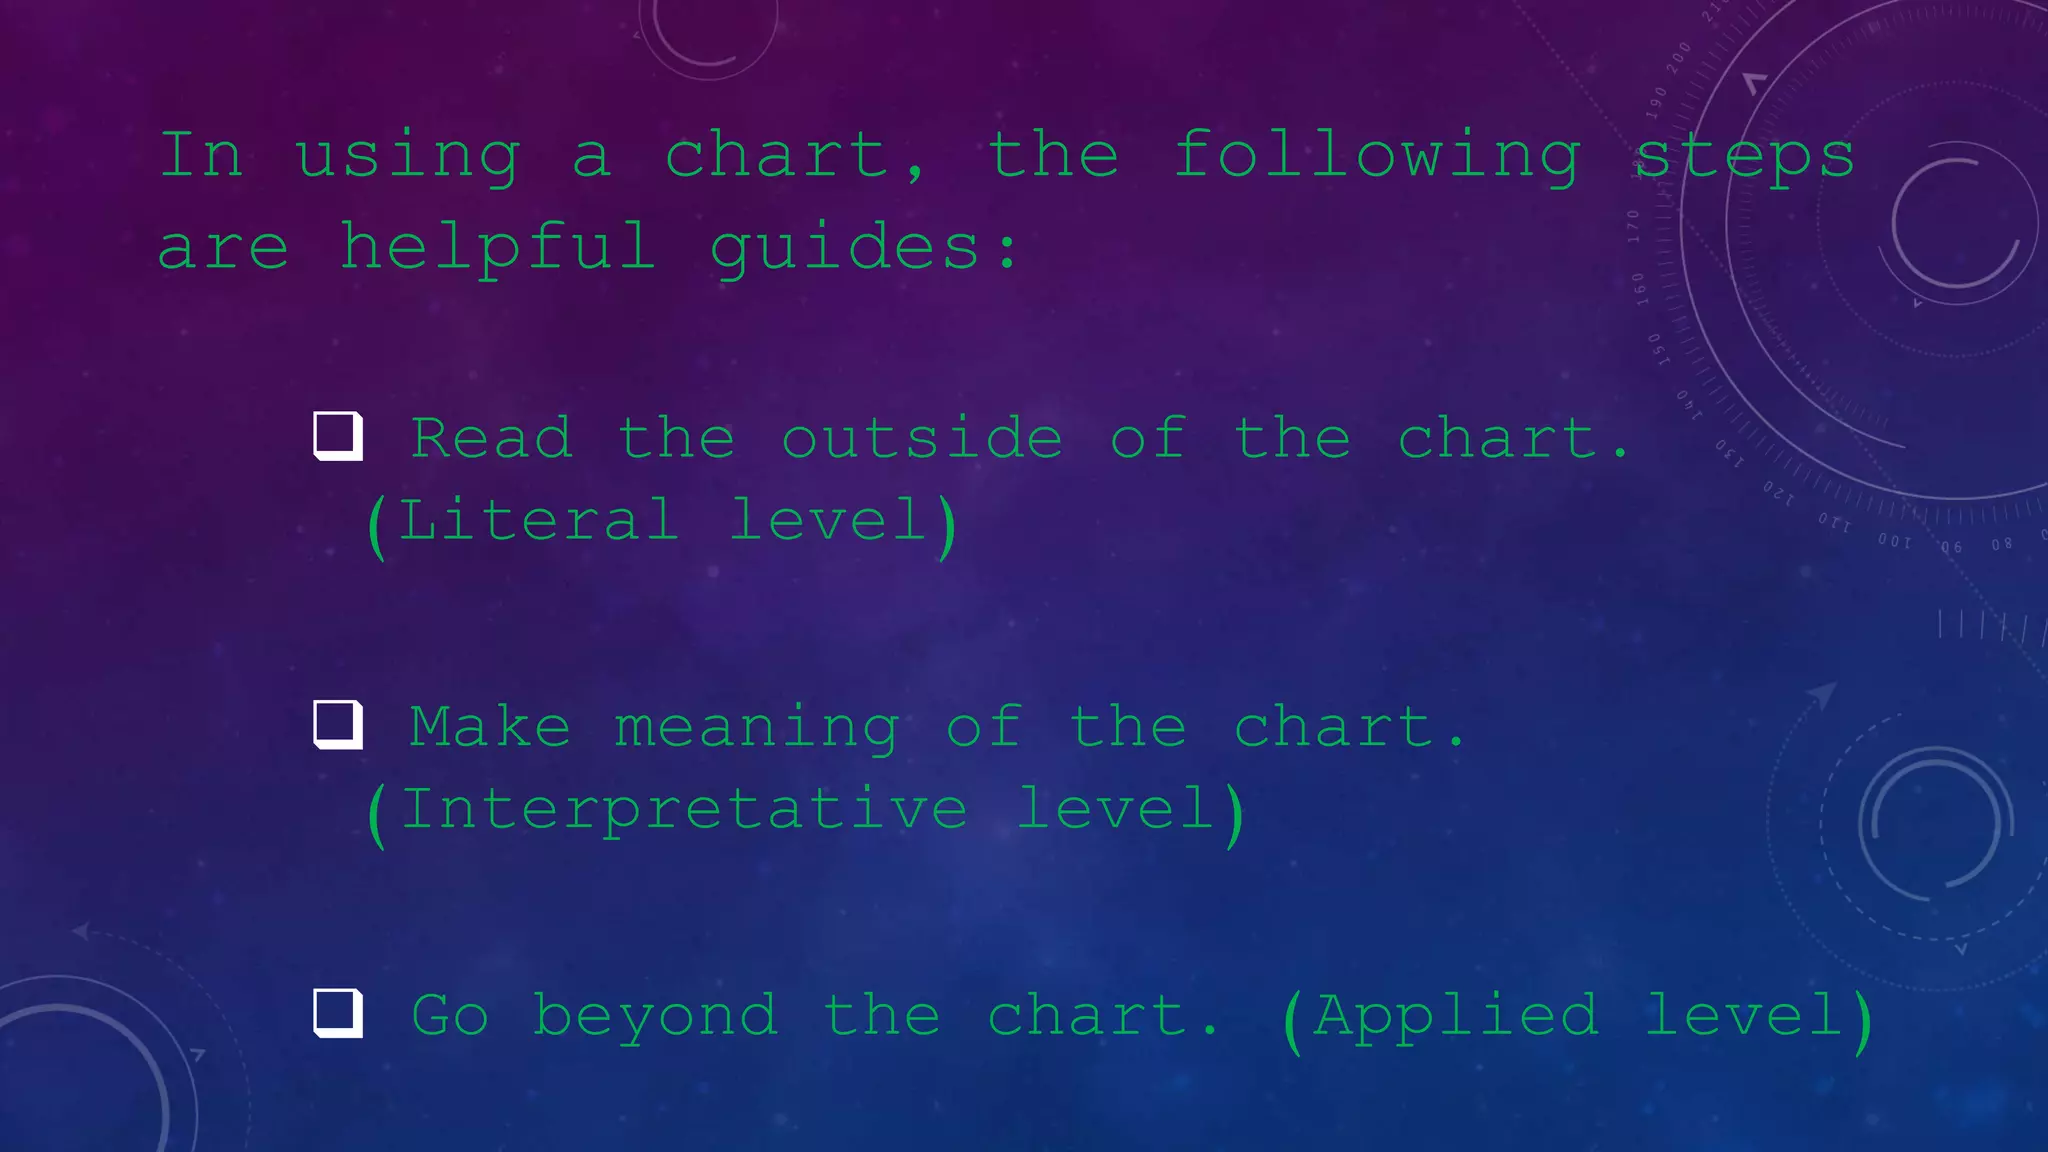
VERITAS COLLEGE OF IROSIN
IROSIN, SORSOGON
S.Y. 2014-2015
POWER POINT PRESENTATION
ON SOCIAL STUDIES
PRESENTED BY:
MS. MARY-LYN O. HONRA
BEED-II
PRESENTED TO:
MS. JELEN DOLOSA
INSTRUCTOR
Tables,
Graphs,
and Charts
TABLES are visual display of
numeral or non-numeral data
arranged in vertical columns
so that the data may be
emphasized, compared, or
contrasted. Tables can break
up the monotony of the
printed word and give
alternative ways to obtain
Graph is a kind of picture
that makes the facts from
the easier to understand.
There are several types of
graphs used in Geography
such as the bar graph, the
line graph , the pictograph,
and the circle graph. The
circle graph is also known
as pie chart, circle chart,
To interpret the graphs, the following
stage format should be used;
 Identify the information being
presented.
 Analyze the information
presented.
 Develop hypothesis from the
information.
The BAR GRAPH shows
comparison because it
gives two kinds of
information that
stands for a fact or
set of facts, which
are placed alongside
The LINE GRAPH tells
stories and is considered
the best kind for showing
the change in something
over a stretch of time. A
sharper rise in the line
stands for greater
changes.
A PICTOGRAPH is a
chart that uses
picture to stand
for fixed amounts
of selected
things.
The PIE GRAPH or
PIE CHART makes it
easier to see how
one part is
compared with
other parts.
In using a chart, the following steps
are helpful guides:
 Read the outside of the chart.
(Literal level)
 Make meaning of the chart.
(Interpretative level)
 Go beyond the chart. (Applied level)
THANK YOU!!!

Tables, Graphs, and Charts Social Studies

  • 1.
    VERITAS COLLEGE OFIROSIN IROSIN, SORSOGON S.Y. 2014-2015 POWER POINT PRESENTATION ON SOCIAL STUDIES PRESENTED BY: MS. MARY-LYN O. HONRA BEED-II PRESENTED TO: MS. JELEN DOLOSA INSTRUCTOR
  • 2.
  • 3.
    TABLES are visualdisplay of numeral or non-numeral data arranged in vertical columns so that the data may be emphasized, compared, or contrasted. Tables can break up the monotony of the printed word and give alternative ways to obtain
  • 6.
    Graph is akind of picture that makes the facts from the easier to understand. There are several types of graphs used in Geography such as the bar graph, the line graph , the pictograph, and the circle graph. The circle graph is also known as pie chart, circle chart,
  • 7.
    To interpret thegraphs, the following stage format should be used;  Identify the information being presented.  Analyze the information presented.  Develop hypothesis from the information.
  • 8.
    The BAR GRAPHshows comparison because it gives two kinds of information that stands for a fact or set of facts, which are placed alongside
  • 11.
    The LINE GRAPHtells stories and is considered the best kind for showing the change in something over a stretch of time. A sharper rise in the line stands for greater changes.
  • 16.
    A PICTOGRAPH isa chart that uses picture to stand for fixed amounts of selected things.
  • 20.
    The PIE GRAPHor PIE CHART makes it easier to see how one part is compared with other parts.
  • 23.
    In using achart, the following steps are helpful guides:  Read the outside of the chart. (Literal level)  Make meaning of the chart. (Interpretative level)  Go beyond the chart. (Applied level)
  • 24.