Download to read offline
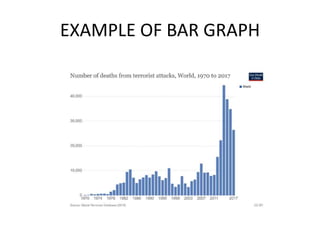


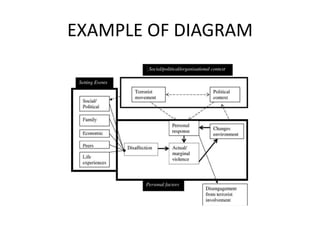


Graphs, charts, and diagrams are visual methods used to present data in a concise way that clearly illustrates relationships and trends. There are five main types: bar graphs, tables, line graphs, pie charts, and diagrams. Bar graphs show relationships between independent data series using the height of bars. Tables present exact data values in columns and rows but require close reading. Line graphs demonstrate how data changes over time or show dependencies. Pie charts visualize how a whole is divided into parts using percentages. Diagrams illustrate how separate parts work and overlap.


