Downloaded 209 times


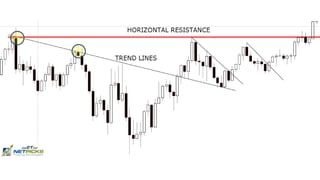
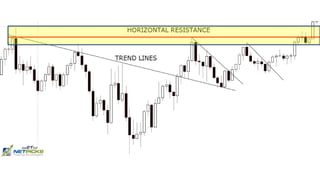
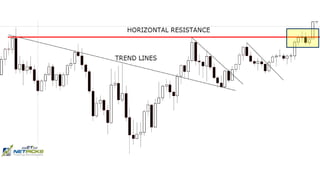


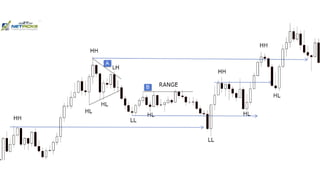
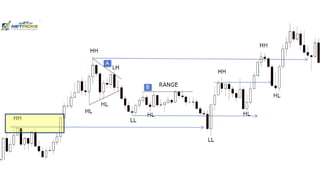
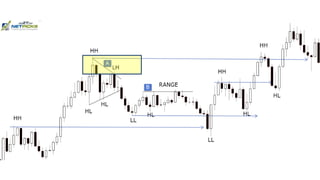
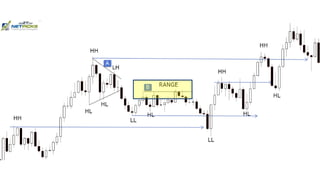
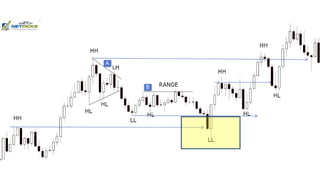


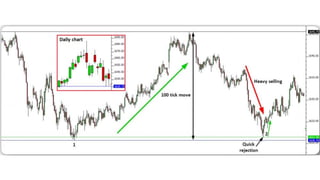
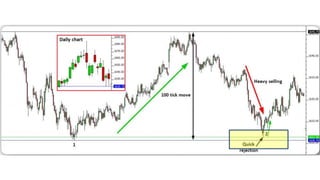
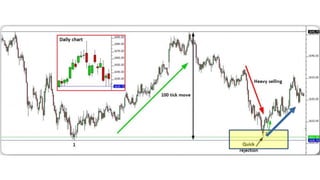
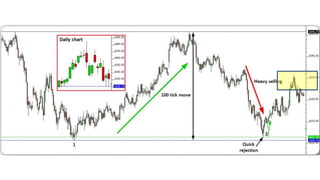


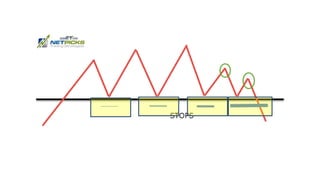

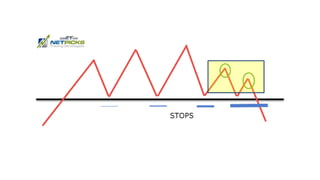


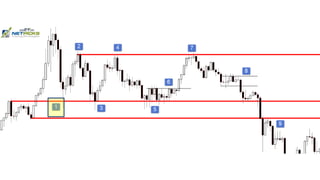
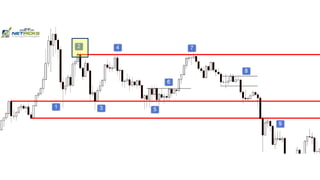
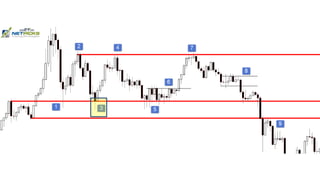
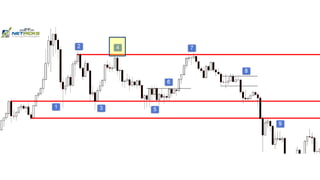
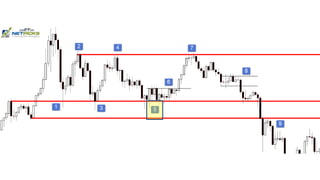
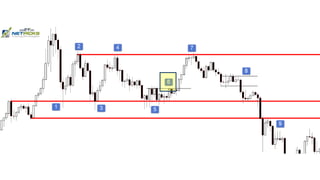
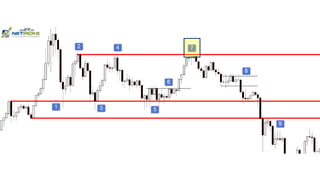
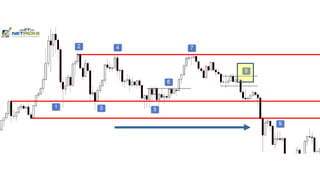

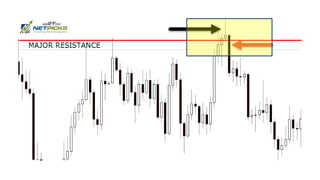
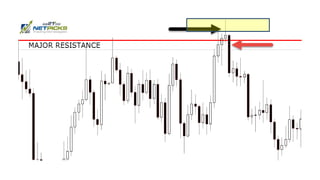
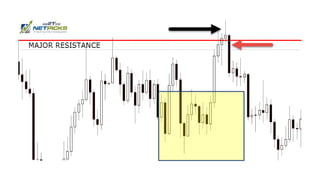

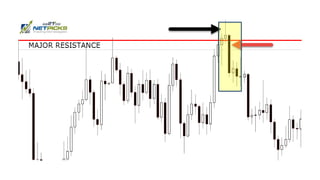
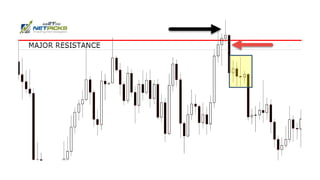


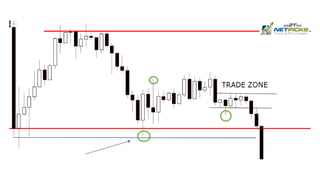

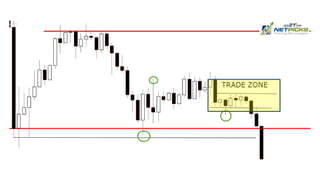


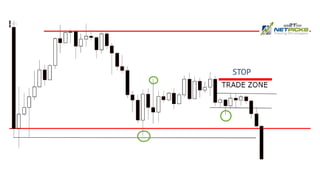


The document discusses the concept of support and resistance levels in trading, emphasizing that these levels are derived from previous market activity and can vary in strength. It highlights the importance of context and market conditions when identifying these levels and cautions traders about false breakouts. Ultimately, the document advocates for a nuanced approach to trading based on the reaction of price at these reference points, rather than rigid adherence to predefined levels.


