Downloaded 588 times
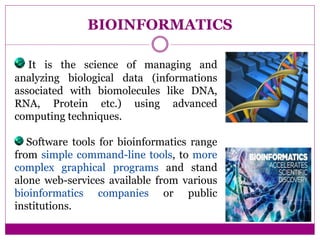
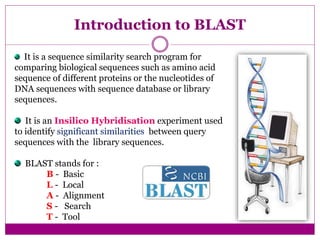


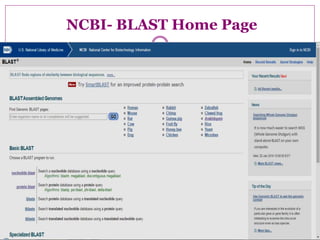


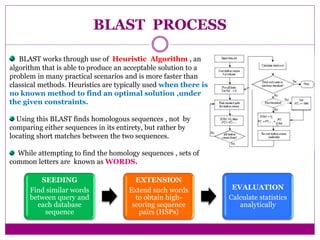
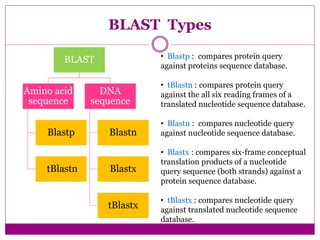
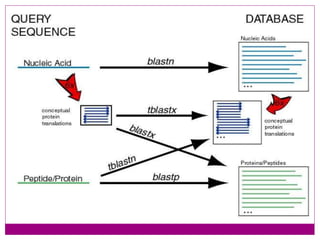


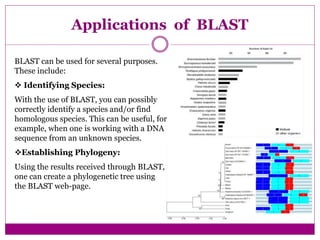
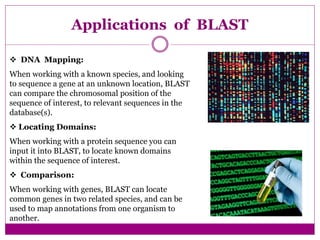


The document discusses BLAST, a bioinformatics tool designed for comparing biological sequences such as proteins and DNA. It outlines its functionalities, including various types of searches (e.g., blastp, blastn), the process of sequence comparison using heuristic algorithms, and its applications in species identification and phylogenetic analysis. The document also touches on input and output formats, scoring metrics, and the significance of alignment scores and e-values.


![BLAST [Basic Alignment Local Search Tool]](https://cdn.slidesharecdn.com/ss_thumbnails/blast-120911083837-phpapp02-thumbnail.jpg?width=640&height=640&fit=bounds)