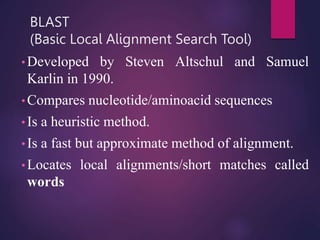
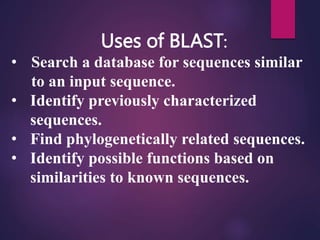
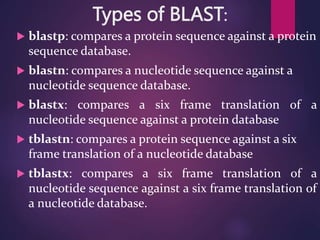
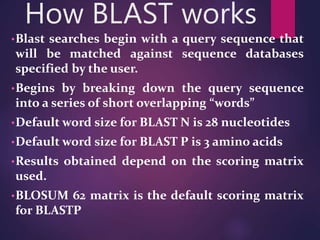
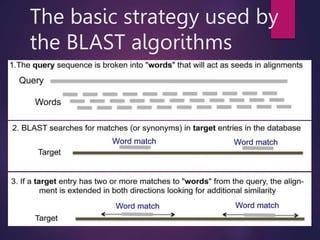
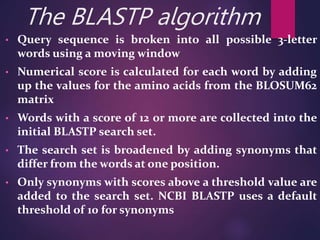
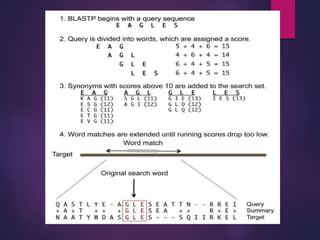
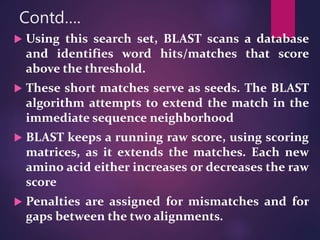
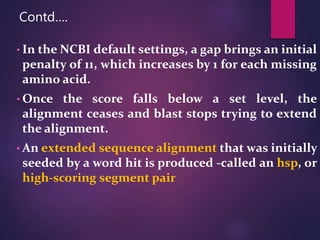
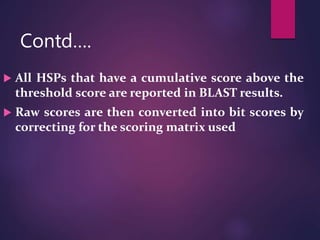
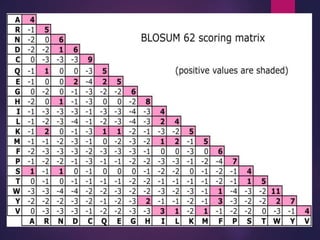
BLAST
(Basic Local Alignment Search Tool)
• Developed by Steven Altschul and Samuel
Karlin in 1990.
• Compares nucleotide/aminoacid sequences
• Is a heuristic method.
• Is a fast but approximate method of alignment.
• Locates local alignments/short matches called
words
Uses of BLAST:
• Search a database for sequences similar
to an input sequence.
• Identify previously characterized
sequences.
• Find phylogenetically related sequences.
• Identify possible functions based on
similarities to known sequences.
Types of BLAST:
Types of BLAST:
 blastp: compares a protein sequence against a protein
sequence database.
 blastn: compares a nucleotide sequence against a
nucleotide sequence database.
 blastx: compares a six frame translation of a
nucleotide sequence against a protein database
 tblastn: compares a protein sequence against a six
frame translation of a nucleotide database
 tblastx: compares a six frame translation of a
nucleotide sequence against a six frame translation of
a nucleotide database.
How BLAST works
•Blast searches begin with a query sequence that
will be matched against sequence databases
specified by the user.
•Begins by breaking down the query sequence
into a series of short overlapping “words”
•Default word size for BLAST N is 28 nucleotides
•Default word size for BLAST P is 3 amino acids
•Results obtained depend on the scoring matrix
used.
•BLOSUM 62 matrix is the default scoring matrix
for BLASTP
The basic strategy used by
the BLAST algorithms
The BLASTP algorithm
• Query sequence is broken into all possible 3-letter
words using a moving window
• Numerical score is calculated for each word by adding
up the values for the amino acids from the BLOSUM62
matrix
• Words with a score of 12 or more are collected into the
initial BLASTP search set.
• The search set is broadened by adding synonyms that
differ from the words at one position.
• Only synonyms with scores above a threshold value are
added to the search set. NCBI BLASTP uses a default
threshold of 10 for synonyms
Contd….
 Using this search set, BLAST scans a database
and identifies word hits/matches that score
above the threshold.
 These short matches serve as seeds. The BLAST
algorithm attempts to extend the match in the
immediate sequence neighborhood
 BLAST keeps a running raw score, using scoring
matrices, as it extends the matches. Each new
amino acid either increases or decreases the raw
score
 Penalties are assigned for mismatches and for
gaps between the two alignments.
• In the NCBI default settings, a gap brings an initial
penalty of 11, which increases by 1 for each missing
amino acid.
• Once the score falls below a set level, the
alignment ceases and blast stops trying to extend
the alignment.
• An extended sequence alignment that was initially
seeded by a word hit is produced -called an hsp, or
high-scoring segment pair
Contd….
Contd….
 All HSPs that have a cumulative score above the
threshold score are reported in BLAST results.
 Raw scores are then converted into bit scores by
correcting for the scoring matrix used
The Blast output
 Includes a table with the bit scores (S) for each alignment and its E-
value, or “expect score”
 the score (S) is a measure of the quality of an alignment (calculated as
the sum of substitution and gap scores for each aligned residue)
 E-value (E), or expectation value is a measure of the significance of the
alignment. The E-value is the number of different alignments, with
scores equivalent to or better than S, that are expected to occur in a
database search by chance.
 The lower the E-value, the more significant the alignment result.
 Alignments with the highest bit scores and lowest E-values are listed at
the top of the table.
How a BLAST result looks
The query sequence - numbered red bar at the top of the figure. Database hits are
shown aligned to the query, below the red bar. Of the aligned sequences, the most
similar are shown closest to the query. In this case, there are three high scoring
database matches that align to most of the query sequence. The next twelve bars
represent lower-scoring matches that align to two regions of the query, from about
residues 3–60 and residues 220–500. The cross-hatched parts of the these bars
indicate that the two regions of similarity are on the same protein, but that this
intervening region does not match. The remaining bars show lower-scoring
alignments. Mousing over the bars displays the definition line for that sequence to
be shown in the window above the graphic.
One-line descriptions in the BLAST report
Each line is composed of four fields: (a) the gi number, database designation, accession
number, and locus name for the matched sequence, separated by vertical bars (appendix 1);
(b) a brief textual description of the sequence, the definition. This usually includes
information on the organism from which the sequence was derived, the type of sequence
(e.G., mRNA or DNA), and some information about function or phenotype. The definition
line is often truncated in the one-line descriptions to keep the display compact; (c) the
alignment score in bits. Higher scoring hits are found at the top of the list; and (d) the e-
value, which provides an estimate of statistical significance. For the first hit in the list, the
gi number is 116365, the database designation is sp (for SWISS-PROT), the accession
number is P26374, the locus name is RAE2_HUMAN, the definition line is rab proteins, the
A pairwise sequence alignment from a BLAST report
The alignment is preceded by the sequence identifier, the full definition line, and the length of the matched
sequence, in amino acids. Next comes the bit score (the raw score is in parentheses) and then the E-value. The
following line contains information on the number of identical residues in this alignment (Identities), the
number of conservative substitutions (Positives), and if applicable, the number of gaps in the alignment.
Finally, the actual alignment is shown, with the query on top, and the database match is labeled as Sbjct,
below. The numbers at left and right refer to the position in the amino acid sequence. One or more dashes (–)
within a sequence indicate insertions or deletions. Amino acid residues in the query sequence that have been
masked because of low complexity are replaced by Xs (see, for example, the fourth and last blocks). The line
between the two sequences indicates the similarities between the sequences. If the query and the subject

BLAST : features, types,algorithm, working etc.

  • 1.
    BLAST (Basic Local AlignmentSearch Tool) • Developed by Steven Altschul and Samuel Karlin in 1990. • Compares nucleotide/aminoacid sequences • Is a heuristic method. • Is a fast but approximate method of alignment. • Locates local alignments/short matches called words
  • 2.
    Uses of BLAST: •Search a database for sequences similar to an input sequence. • Identify previously characterized sequences. • Find phylogenetically related sequences. • Identify possible functions based on similarities to known sequences.
  • 3.
  • 4.
    Types of BLAST: blastp: compares a protein sequence against a protein sequence database.  blastn: compares a nucleotide sequence against a nucleotide sequence database.  blastx: compares a six frame translation of a nucleotide sequence against a protein database  tblastn: compares a protein sequence against a six frame translation of a nucleotide database  tblastx: compares a six frame translation of a nucleotide sequence against a six frame translation of a nucleotide database.
  • 5.
    How BLAST works •Blastsearches begin with a query sequence that will be matched against sequence databases specified by the user. •Begins by breaking down the query sequence into a series of short overlapping “words” •Default word size for BLAST N is 28 nucleotides •Default word size for BLAST P is 3 amino acids •Results obtained depend on the scoring matrix used. •BLOSUM 62 matrix is the default scoring matrix for BLASTP
  • 6.
    The basic strategyused by the BLAST algorithms
  • 7.
    The BLASTP algorithm •Query sequence is broken into all possible 3-letter words using a moving window • Numerical score is calculated for each word by adding up the values for the amino acids from the BLOSUM62 matrix • Words with a score of 12 or more are collected into the initial BLASTP search set. • The search set is broadened by adding synonyms that differ from the words at one position. • Only synonyms with scores above a threshold value are added to the search set. NCBI BLASTP uses a default threshold of 10 for synonyms
  • 9.
    Contd….  Using thissearch set, BLAST scans a database and identifies word hits/matches that score above the threshold.  These short matches serve as seeds. The BLAST algorithm attempts to extend the match in the immediate sequence neighborhood  BLAST keeps a running raw score, using scoring matrices, as it extends the matches. Each new amino acid either increases or decreases the raw score  Penalties are assigned for mismatches and for gaps between the two alignments.
  • 10.
    • In theNCBI default settings, a gap brings an initial penalty of 11, which increases by 1 for each missing amino acid. • Once the score falls below a set level, the alignment ceases and blast stops trying to extend the alignment. • An extended sequence alignment that was initially seeded by a word hit is produced -called an hsp, or high-scoring segment pair Contd….
  • 11.
    Contd….  All HSPsthat have a cumulative score above the threshold score are reported in BLAST results.  Raw scores are then converted into bit scores by correcting for the scoring matrix used
  • 13.
    The Blast output Includes a table with the bit scores (S) for each alignment and its E- value, or “expect score”  the score (S) is a measure of the quality of an alignment (calculated as the sum of substitution and gap scores for each aligned residue)  E-value (E), or expectation value is a measure of the significance of the alignment. The E-value is the number of different alignments, with scores equivalent to or better than S, that are expected to occur in a database search by chance.  The lower the E-value, the more significant the alignment result.  Alignments with the highest bit scores and lowest E-values are listed at the top of the table.
  • 14.
    How a BLASTresult looks
  • 15.
    The query sequence- numbered red bar at the top of the figure. Database hits are shown aligned to the query, below the red bar. Of the aligned sequences, the most similar are shown closest to the query. In this case, there are three high scoring database matches that align to most of the query sequence. The next twelve bars represent lower-scoring matches that align to two regions of the query, from about residues 3–60 and residues 220–500. The cross-hatched parts of the these bars indicate that the two regions of similarity are on the same protein, but that this intervening region does not match. The remaining bars show lower-scoring alignments. Mousing over the bars displays the definition line for that sequence to be shown in the window above the graphic.
  • 16.
    One-line descriptions inthe BLAST report Each line is composed of four fields: (a) the gi number, database designation, accession number, and locus name for the matched sequence, separated by vertical bars (appendix 1); (b) a brief textual description of the sequence, the definition. This usually includes information on the organism from which the sequence was derived, the type of sequence (e.G., mRNA or DNA), and some information about function or phenotype. The definition line is often truncated in the one-line descriptions to keep the display compact; (c) the alignment score in bits. Higher scoring hits are found at the top of the list; and (d) the e- value, which provides an estimate of statistical significance. For the first hit in the list, the gi number is 116365, the database designation is sp (for SWISS-PROT), the accession number is P26374, the locus name is RAE2_HUMAN, the definition line is rab proteins, the
  • 17.
    A pairwise sequencealignment from a BLAST report The alignment is preceded by the sequence identifier, the full definition line, and the length of the matched sequence, in amino acids. Next comes the bit score (the raw score is in parentheses) and then the E-value. The following line contains information on the number of identical residues in this alignment (Identities), the number of conservative substitutions (Positives), and if applicable, the number of gaps in the alignment. Finally, the actual alignment is shown, with the query on top, and the database match is labeled as Sbjct, below. The numbers at left and right refer to the position in the amino acid sequence. One or more dashes (–) within a sequence indicate insertions or deletions. Amino acid residues in the query sequence that have been masked because of low complexity are replaced by Xs (see, for example, the fourth and last blocks). The line between the two sequences indicates the similarities between the sequences. If the query and the subject