More Related Content
Similar to Utah Bridge Inventory Highlights Deficiencies & Needs
Similar to Utah Bridge Inventory Highlights Deficiencies & Needs (15)
Utah Bridge Inventory Highlights Deficiencies & Needs
- 1. © 2014 The American Road & Transportation Builders Association (ARTBA). All rights reserved. No part of this document may be reproduced or
transmitted in any form or by any means, electronic, mechanical, photocopying, recording, or otherwise, without prior written permission of
ARTBA.
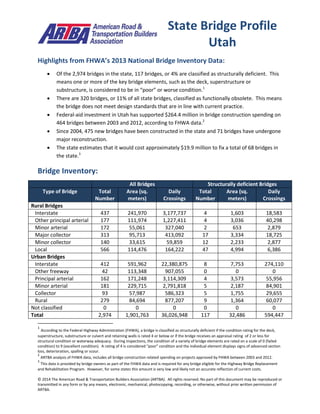
Highlights from FHWA’s 2013 National Bridge Inventory Data:
Of the 2,974 bridges in the state, 117 bridges, or 4% are classified as structurally deficient. This
means one or more of the key bridge elements, such as the deck, superstructure or
substructure, is considered to be in “poor” or worse condition.1
There are 320 bridges, or 11% of all state bridges, classified as functionally obsolete. This means
the bridge does not meet design standards that are in line with current practice.
Federal-aid investment in Utah has supported $264.4 million in bridge construction spending on
464 bridges between 2003 and 2012, according to FHWA data.2
Since 2004, 475 new bridges have been constructed in the state and 71 bridges have undergone
major reconstruction.
The state estimates that it would cost approximately $19.9 million to fix a total of 68 bridges in
the state.3
Bridge Inventory:
All Bridges Structurally deficient Bridges
Type of Bridge Total
Number
Area (sq.
meters)
Daily
Crossings
Total
Number
Area (sq.
meters)
Daily
Crossings
Rural Bridges
Interstate 437 241,970 3,177,737 4 1,603 18,583
Other principal arterial 177 111,974 1,227,411 4 3,036 40,298
Minor arterial 172 55,061 327,040 2 653 2,879
Major collector 313 95,713 413,092 17 3,334 18,725
Minor collector 140 33,615 59,859 12 2,233 2,877
Local 566 114,476 164,222 47 4,994 6,386
Urban Bridges
Interstate 412 591,962 22,380,875 8 7,753 274,110
Other freeway 42 113,348 907,055 0 0 0
Principal arterial 162 171,248 3,114,309 4 3,573 55,956
Minor arterial 181 229,715 2,791,818 5 2,187 84,901
Collector 93 57,987 586,323 5 1,755 29,655
Local 279 84,694 877,207 9 1,364 60,077
Not classified 0 0 0 0 0 0
Total 2,974 1,901,763 36,026,948 117 32,486 594,447
1
According to the Federal Highway Administration (FHWA), a bridge is classified as structurally deficient if the condition rating for the deck,
superstructure, substructure or culvert and retaining walls is rated 4 or below or if the bridge receives an appraisal rating of 2 or less for
structural condition or waterway adequacy. During inspections, the condition of a variety of bridge elements are rated on a scale of 0 (failed
condition) to 9 (excellent condition). A rating of 4 is considered “poor” condition and the individual element displays signs of advanced section
loss, deterioration, spalling or scour.
2
ARTBA analysis of FHWA data, includes all bridge construction related spending on projects approved by FHWA between 2003 and 2012.
3
This data is provided by bridge owners as part of the FHWA data and is required for any bridge eligible for the Highway Bridge Replacement
and Rehabilitation Program. However, for some states this amount is very low and likely not an accurate reflection of current costs.
State Bridge Profile
Utah
- 2. © 2014 The American Road & Transportation Builders Association (ARTBA). All rights reserved. No part of this document may be reproduced or
transmitted in any form or by any means, electronic, mechanical, photocopying, recording, or otherwise, without prior written permission of
ARTBA.
Proposed bridge work:
Type of Work Number Cost (millions) Daily Crossings Area (sq. meters)
Bridge replacement 27 $19.0 533,716 17,155
Widening & rehabilitation 1 $0.0 3,000 263
Rehabilitation 22 $0.9 24,693 6,404
Deck rehabilitation/replacement 1 $0.0 10 38
Other work 17 $0.0 60,274 2,508
Top 10 Most Traveled Structurally Deficient Bridges in the State
County Year
Built
Daily
Crossings
Type of Bridge Location
(route/water under the bridge, traffic on the bridge and location)
Davis 1959 71,676 Urban Interstate SR-93 2600 SOUTH in NSL, I-15 (SR-15) NBL, 1100 N. to 2600 S.
Intchg
Davis 1959 68,402 Urban Interstate SR-68 500 SOUTH STREET, I-15 (SR-15) NBL, 500 SO.INTCHG.
BOUNTIFUL
Davis 1959 65,930 Urban Interstate SR-68 500 SOUTH STREET, I-15 (SR-15) SBL, 500 SO.INTCHG.
BOUNTIFUL
Salt Lake 1979 37,101 Urban minor
arterial
EAST JORDAN CANAL, 10600 SO, 300 E.10600 SO. SANDY
Salt Lake 1964 23,366 Urban Interstate I-80 (SR-80) EBL & WBL, RP.I80WB TO I2155S, UPPER PARLEYS
INTERCHANGE
Salt Lake 1950 22,982 Urban local road JORDAN & SALT LAKE CANAL, 6400 SOUTH STREET, 1350 EAST
6400 SOUTH
Salt Lake 1961 18,430 Urban minor
arterial
RAMP I-15NB to US-89NB, RP.US89NB to I15NB, BECKS STREET
INTERCHANGE
Utah 1970 18,198 Urban other
principal arterial
PROVO RIVER, SR-265 WBL, 0.4 MI.W.UNIV. AVE. INTS.
Utah 1970 18,198 Urban other
principal arterial
PROVO RI.& WALKWAY, SR-265 EBL, W.of UNIVERSITY AVE.INT.
Salt Lake 1966 16,161 Urban Interstate I-215 (SR-215) NBL & SBL, RAMP I80W TO I215S, PARLEYS
INTERCHANGE
Sources: All data is from the 2013 National Bridge Inventory, released by the Federal Highway Administration in March 2014.
Note that specific conditions on bridge may have changed as a result of recent work. Cost estimates of bridge work provided as
part of the data and have been adjusted to 2013$ for inflation and estimated project costs. Contract awards data is for state
and local government awards and comes from McGraw Hill. Note that additional bridge investment may be a part of other
contract awards if a smaller bridge project is included with a highway project, and that would not be accounted for in the total
in this profile.