Download to read offline
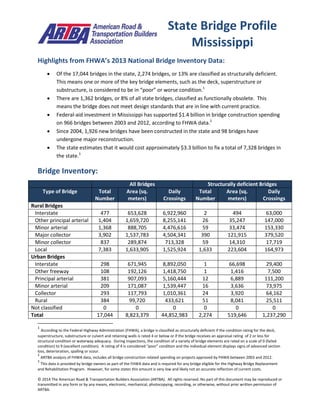
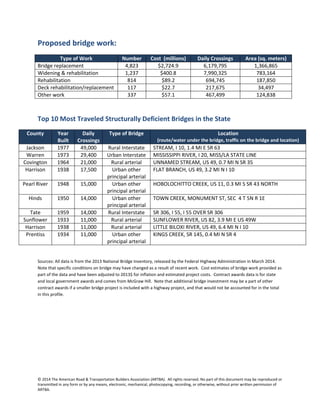

The document summarizes bridge data from Mississippi's 2013 National Bridge Inventory. It finds that 13% of the state's 17,044 bridges, or 2,274 bridges, are structurally deficient. Between 2003-2012, $1.4 billion in federal funding supported bridge construction in Mississippi. The state estimates it would cost $3.3 billion to repair 7,328 bridges. The top proposed bridge work includes replacing 4,823 bridges for $2.7 billion and widening/rehabilitating 1,237 bridges for $400.8 million.


