More Related Content
Similar to State Bridge Profile Idaho 2014 (16)
State Bridge Profile Idaho 2014
- 1. © 2015 The American Road & Transportation Builders Association (ARTBA). All rights reserved. No part of this document may be reproduced or
transmitted in any form or by any means, electronic, mechanical, photocopying, recording, or otherwise, without prior written permission of
ARTBA.
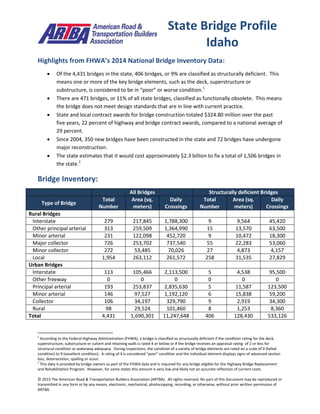
Highlights from FHWA’s 2014 National Bridge Inventory Data:
Of the 4,431 bridges in the state, 406 bridges, or 9% are classified as structurally deficient. This
means one or more of the key bridge elements, such as the deck, superstructure or
substructure, is considered to be in “poor” or worse condition.1
There are 471 bridges, or 11% of all state bridges, classified as functionally obsolete. This means
the bridge does not meet design standards that are in line with current practice.
State and local contract awards for bridge construction totaled $324.80 million over the past
five years, 22 percent of highway and bridge contract awards, compared to a national average of
29 percent.
Since 2004, 350 new bridges have been constructed in the state and 72 bridges have undergone
major reconstruction.
The state estimates that it would cost approximately $2.3 billion to fix a total of 1,506 bridges in
the state.2
Bridge Inventory:
All Bridges Structurally deficient Bridges
Type of Bridge
Total
Number
Area (sq.
meters)
Daily
Crossings
Total
Number
Area (sq.
meters)
Daily
Crossings
Rural Bridges
Interstate 279 217,845 1,788,300 9 9,564 45,420
Other principal arterial 313 259,509 1,364,990 15 13,570 63,500
Minor arterial 231 122,098 452,720 9 10,472 18,300
Major collector 726 253,702 737,540 55 22,283 53,060
Minor collector 272 53,485 70,026 27 4,873 4,157
Local 1,954 263,112 261,572 258 31,535 27,829
Urban Bridges
Interstate 113 105,466 2,113,500 5 4,538 95,500
Other freeway 0 0 0 0 0 0
Principal arterial 193 253,837 2,835,630 5 11,587 123,500
Minor arterial 146 97,527 1,192,120 6 15,838 59,200
Collector 106 34,197 329,790 9 2,919 34,300
Rural 98 29,524 101,460 8 1,253 8,360
Total 4,431 1,690,301 11,247,648 406 128,430 533,126
1
According to the Federal Highway Administration (FHWA), a bridge is classified as structurally deficient if the condition rating for the deck,
superstructure, substructure or culvert and retaining walls is rated 4 or below or if the bridge receives an appraisal rating of 2 or less for
structural condition or waterway adequacy. During inspections, the condition of a variety of bridge elements are rated on a scale of 0 (failed
condition) to 9 (excellent condition). A rating of 4 is considered “poor” condition and the individual element displays signs of advanced section
loss, deterioration, spalling or scour.
2
This data is provided by bridge owners as part of the FHWA data and is required for any bridge eligible for the Highway Bridge Replacement
and Rehabilitation Program. However, for some states this amount is very low and likely not an accurate reflection of current costs.
State Bridge Profile
Idaho
- 2. © 2015 The American Road & Transportation Builders Association (ARTBA). All rights reserved. No part of this document may be reproduced or
transmitted in any form or by any means, electronic, mechanical, photocopying, recording, or otherwise, without prior written permission of
ARTBA.
Proposed bridge work:
Type of Work Number Cost (millions) Daily Crossings Area (sq. meters)
Bridge replacement 1,401 $2,118.5 3,028,396 551,455
Widening & rehabilitation 63 $71.2 275,444 32,483
Rehabilitation 24 $108.1 80,760 27,507
Deck rehabilitation/replacement 10 $10.6 60,060 13,953
Other work 8 $5.3 44,850 3,322
Top 10 Most Traveled Structurally Deficient Bridges in the State:
County
Year
Built
Daily
Crossings
Type of Bridge Location
Ada 1965 39,000
Urban other
principal arterial
SH 69 (S Meridian Road) over I-84
Ada 1969 33,000
Urban other
principal arterial
US-20 (Sun Valley Highway) over I-84 EB & WB
Canyon 1966 30,500 Urban Interstate I 84 WBL over UPRR;EAST LATERAL CANAL
Ada 1956 25,000
Urban other
principal arterial
US 20 and I-84B over the Boise River
Bonneville 1957 23,000
Urban minor
arterial
SMA 7406/17th Street over Sand Creek
Nez Perce 1982 21,000
Urban minor
arterial
Bryden Canyon Road over the Snake River (Southway Bridge)
Ada 1969 18,500 Urban Interstate I-84 WB over the Union Pacific Railroad and the Gowen Spur
Ada 1969 18,500 Urban Interstate I-84 EB over the Union Pacific Railroad and the Gowen Spur
Bannock 1962 14,000 Urban Interstate I-15 SB over the I-86 WB Ramp
Kootenai 1936 14,000 Rural arterial SH 41 over the Burlington Northern Railroad
Sources: All data is from the 2014 National Bridge Inventory, released by the Federal Highway Administration in January 2015.
Note that specific conditions on bridge may have changed as a result of recent work. Cost estimates of bridge work provided as
part of the data and have been adjusted to 2014$ for inflation and estimated project costs. Contract awards data is for state
and local government awards and comes from McGraw Hill. Note that additional bridge investment may be a part of other
contract awards if a smaller bridge project is included with a highway project, and that would not be accounted for in the total
in this profile