More Related Content
Similar to South Dakota State Bridge Profile
Similar to South Dakota State Bridge Profile (15)
South Dakota State Bridge Profile
- 1. © 2014 The American Road & Transportation Builders Association (ARTBA). All rights reserved. No part of this document may be reproduced or
transmitted in any form or by any means, electronic, mechanical, photocopying, recording, or otherwise, without prior written permission of
ARTBA.
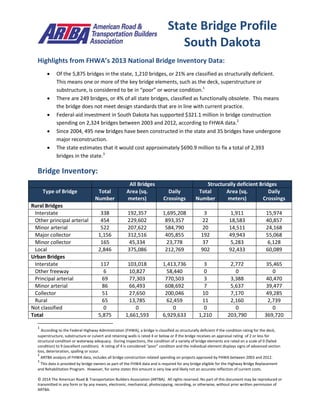
Highlights from FHWA’s 2013 National Bridge Inventory Data:
Of the 5,875 bridges in the state, 1,210 bridges, or 21% are classified as structurally deficient.
This means one or more of the key bridge elements, such as the deck, superstructure or
substructure, is considered to be in “poor” or worse condition.1
There are 249 bridges, or 4% of all state bridges, classified as functionally obsolete. This means
the bridge does not meet design standards that are in line with current practice.
Federal-aid investment in South Dakota has supported $321.1 million in bridge construction
spending on 2,324 bridges between 2003 and 2012, according to FHWA data.2
Since 2004, 495 new bridges have been constructed in the state and 35 bridges have undergone
major reconstruction.
The state estimates that it would cost approximately $690.9 million to fix a total of 2,393
bridges in the state.3
Bridge Inventory:
All Bridges Structurally deficient Bridges
Type of Bridge Total
Number
Area (sq.
meters)
Daily
Crossings
Total
Number
Area (sq.
meters)
Daily
Crossings
Rural Bridges
Interstate 338 192,357 1,695,208 3 1,911 15,974
Other principal arterial 454 229,602 893,357 22 18,583 40,857
Minor arterial 522 207,622 584,790 20 14,511 24,168
Major collector 1,156 312,516 405,855 192 49,943 55,068
Minor collector 165 45,334 23,778 37 5,283 6,128
Local 2,846 375,086 212,769 902 92,433 60,089
Urban Bridges
Interstate 117 103,018 1,413,736 3 2,772 35,465
Other freeway 6 10,827 58,440 0 0 0
Principal arterial 69 77,303 770,503 3 3,388 40,470
Minor arterial 86 66,493 608,692 7 5,637 39,477
Collector 51 27,650 200,046 10 7,170 49,285
Local 65 13,785 62,459 11 2,160 2,739
Not classified 0 0 0 0 0 0
Total 5,875 1,661,593 6,929,633 1,210 203,790 369,720
1
According to the Federal Highway Administration (FHWA), a bridge is classified as structurally deficient if the condition rating for the deck,
superstructure, substructure or culvert and retaining walls is rated 4 or below or if the bridge receives an appraisal rating of 2 or less for
structural condition or waterway adequacy. During inspections, the condition of a variety of bridge elements are rated on a scale of 0 (failed
condition) to 9 (excellent condition). A rating of 4 is considered “poor” condition and the individual element displays signs of advanced section
loss, deterioration, spalling or scour.
2
ARTBA analysis of FHWA data, includes all bridge construction related spending on projects approved by FHWA between 2003 and 2012.
3
This data is provided by bridge owners as part of the FHWA data and is required for any bridge eligible for the Highway Bridge Replacement
and Rehabilitation Program. However, for some states this amount is very low and likely not an accurate reflection of current costs.
State Bridge Profile
South Dakota
- 2. © 2014 The American Road & Transportation Builders Association (ARTBA). All rights reserved. No part of this document may be reproduced or
transmitted in any form or by any means, electronic, mechanical, photocopying, recording, or otherwise, without prior written permission of
ARTBA.
Proposed bridge work:
Type of Work Number Cost (millions) Daily Crossings Area (sq. meters)
Bridge replacement 1,265 $629.1 721,701 252,577
Widening & rehabilitation 5 $3.0 56,411 2,858
Rehabilitation 339 $14.5 133,460 88,841
Deck rehabilitation/replacement 60 $9.6 116,612 35,435
Other work 724 $34.7 266,557 111,508
Top 10 Most Traveled Structurally Deficient Bridges in the State
County Year
Built
Daily
Crossings
Type of Bridge Location
(route/water under the bridge, traffic on the bridge and location)
Minnehaha 1965 22,694 Urban other
principal arterial
ELLIS AND EASTERN RR, OLD SD042 (W 12TH), 12TH ST-W.
GRANGE AVE -SF
Minnehaha 1979 18,174 Urban collector BIG SIOUX RV, 49TH STREET, 49TH ST-W OF KIWANIS - SF
Lincoln 1958 17,310 Urban Interstate I229 S & I029 S OFF RAMP, I029 S, I 29 & I 229 INTERCHANGE
Lincoln 1958 17,310 Urban Interstate I229 S & I029 S OFF RAMP, I029 N, I 29 & I 229 INTERCHANGE
Pennington 1962 13,566 Urban other
principal arterial
RAPID CK, SD044, 1.9 SW JCT SD 231
Minnehaha 1973 13,400 Urban minor
arterial
BIG SIOUX RV, CITY STREET, CLIFF AVE S OF 12TH - SF
Lawrence 1971 11,753 Urban minor
arterial
I090, US014A, US 14A INTERCHANGE
Lawrence 1967 10,215 Rural arterial WHITEWOOD CK, US014A PINE ST, AT JCT US 85 S
Minnehaha 1912 10,163 Urban collector BIG SIOUX RV, EIGHTH ST, 8TH E OF PHILLIPS AVE -SF
Meade 1957 7,985 Rural Interstate CHIMNEY CANYON RD, I090 E, N PIEDMONT INTERCHANGE
Sources: All data is from the 2013 National Bridge Inventory, released by the Federal Highway Administration in March 2014.
Note that specific conditions on bridge may have changed as a result of recent work. Cost estimates of bridge work provided as
part of the data and have been adjusted to 2013$ for inflation and estimated project costs. Contract awards data is for state
and local government awards and comes from McGraw Hill. Note that additional bridge investment may be a part of other
contract awards if a smaller bridge project is included with a highway project, and that would not be accounted for in the total
in this profile.