More Related Content
Similar to Illinois State Bridge Profile
Similar to Illinois State Bridge Profile (13)
Illinois State Bridge Profile
- 1. © 2014 The American Road & Transportation Builders Association (ARTBA). All rights reserved. No part of this document may be reproduced or
transmitted in any form or by any means, electronic, mechanical, photocopying, recording, or otherwise, without prior written permission of
ARTBA.
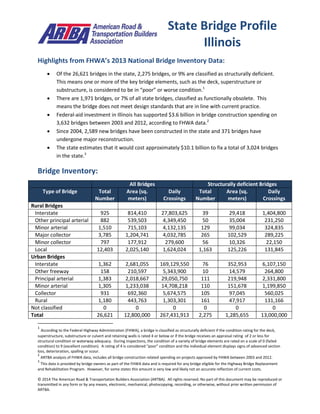
Highlights from FHWA’s 2013 National Bridge Inventory Data:
Of the 26,621 bridges in the state, 2,275 bridges, or 9% are classified as structurally deficient.
This means one or more of the key bridge elements, such as the deck, superstructure or
substructure, is considered to be in “poor” or worse condition.1
There are 1,971 bridges, or 7% of all state bridges, classified as functionally obsolete. This
means the bridge does not meet design standards that are in line with current practice.
Federal-aid investment in Illinois has supported $3.6 billion in bridge construction spending on
3,632 bridges between 2003 and 2012, according to FHWA data.2
Since 2004, 2,589 new bridges have been constructed in the state and 371 bridges have
undergone major reconstruction.
The state estimates that it would cost approximately $10.1 billion to fix a total of 3,024 bridges
in the state.3
Bridge Inventory:
All Bridges Structurally deficient Bridges
Type of Bridge Total
Number
Area (sq.
meters)
Daily
Crossings
Total
Number
Area (sq.
meters)
Daily
Crossings
Rural Bridges
Interstate 925 814,410 27,803,625 39 29,418 1,404,800
Other principal arterial 882 539,503 4,349,450 50 35,004 231,250
Minor arterial 1,510 715,103 4,132,135 129 99,034 324,835
Major collector 3,785 1,204,741 4,032,785 265 102,529 289,225
Minor collector 797 177,912 279,600 56 10,326 22,150
Local 12,403 2,025,140 1,624,024 1,163 125,226 131,845
Urban Bridges
Interstate 1,362 2,681,055 169,129,550 76 352,953 6,107,150
Other freeway 158 210,597 5,343,900 10 14,579 264,800
Principal arterial 1,383 2,018,667 29,050,750 111 219,948 2,331,800
Minor arterial 1,305 1,233,038 14,708,218 110 151,678 1,199,850
Collector 931 692,360 5,674,575 105 97,045 560,025
Local 1,180 443,763 1,303,301 161 47,917 131,166
Not classified 0 0 0 0 0 0
Total 26,621 12,800,000 267,431,913 2,275 1,285,655 13,000,000
1
According to the Federal Highway Administration (FHWA), a bridge is classified as structurally deficient if the condition rating for the deck,
superstructure, substructure or culvert and retaining walls is rated 4 or below or if the bridge receives an appraisal rating of 2 or less for
structural condition or waterway adequacy. During inspections, the condition of a variety of bridge elements are rated on a scale of 0 (failed
condition) to 9 (excellent condition). A rating of 4 is considered “poor” condition and the individual element displays signs of advanced section
loss, deterioration, spalling or scour.
2
ARTBA analysis of FHWA data, includes all bridge construction related spending on projects approved by FHWA between 2003 and 2012.
3
This data is provided by bridge owners as part of the FHWA data and is required for any bridge eligible for the Highway Bridge Replacement
and Rehabilitation Program. However, for some states this amount is very low and likely not an accurate reflection of current costs.
State Bridge Profile
Illinois
- 2. © 2014 The American Road & Transportation Builders Association (ARTBA). All rights reserved. No part of this document may be reproduced or
transmitted in any form or by any means, electronic, mechanical, photocopying, recording, or otherwise, without prior written permission of
ARTBA.
Proposed bridge work:
Type of Work Number Cost (millions) Daily Crossings Area (sq. meters)
Bridge replacement 1,953 $8,897.2 22,681,894 1,428,869
Widening & rehabilitation 326 $372.9 10,334,575 366,593
Rehabilitation 511 $505.3 11,847,977 507,444
Deck rehabilitation/replacement 66 $138.3 8,300,450 156,377
Other work 168 $184.0 2,996,941 253,181
Top 10 Most Traveled Structurally Deficient Bridges in the State
County Year
Built
Daily
Crossings
Type of Bridge Location
(route/water under the bridge, traffic on the bridge and location)
Cook 1959 301,700 Urban Interstate RR - UP &ASHLAND AVE, I- 90 94 JFK, 0.2 M NW IL 64
Cook 1958 271,400 Urban Interstate ILL 62 (OAKTON ST), I90 EB (NW TOLL), I90 AT ILL 62 P5
Cook 1958 271,400 Urban Interstate ILL 62 (OAKTON ST), I90 WB (NW TOLL), I90 AT ILL 62 P5
Cook 1958 267,800 Urban Interstate CHICAGO SAN CANAL, I-294 NB (TRI-ST), 0.3 M W US 45 P10
Cook 1958 267,800 Urban Interstate CHICAGO SAN.CANAL, I-294 (TRISTATE) S, 0.3 M W OFUS 45 P-
10
Cook 1965 245,200 Urban Interstate US 41 LAKE SHORE DR, I- 55 EB TO US 41, 1.6 M E I-94
Cook 1965 245,200 Urban Interstate RR - IC METRA PARKNG, US 41 SB TO I-55 W, 1.6 M E I-94
Cook 1965 244,800 Urban Interstate ML KING DR RMP ETC, I- 55 WB ELEVATED, 1.3 M E I-94
Cook 1965 244,800 Urban Interstate ML KING DR RAMP ETC, I- 55 EB STEVENSON, 1.3 M E I94
Will 1964 151,400 Urban Interstate RR & GARDNER ST, I- 80 WB, 0.1 M E OF IL-53
Sources: All data is from the 2013 National Bridge Inventory, released by the Federal Highway Administration in March 2014.
Note that specific conditions on bridge may have changed as a result of recent work. Cost estimates of bridge work provided as
part of the data and have been adjusted to 2013$ for inflation and estimated project costs. Contract awards data is for state
and local government awards and comes from McGraw Hill. Note that additional bridge investment may be a part of other
contract awards if a smaller bridge project is included with a highway project, and that would not be accounted for in the total
in this profile.