More Related Content
Similar to Massachusetts State Bridge Profile
Similar to Massachusetts State Bridge Profile (13)
Massachusetts State Bridge Profile
- 1. © 2014 The American Road & Transportation Builders Association (ARTBA). All rights reserved. No part of this document may be reproduced or
transmitted in any form or by any means, electronic, mechanical, photocopying, recording, or otherwise, without prior written permission of
ARTBA.
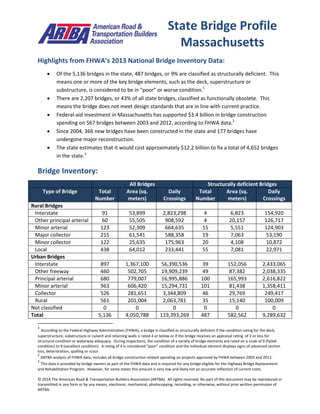
Highlights from FHWA’s 2013 National Bridge Inventory Data:
Of the 5,136 bridges in the state, 487 bridges, or 9% are classified as structurally deficient. This
means one or more of the key bridge elements, such as the deck, superstructure or
substructure, is considered to be in “poor” or worse condition.1
There are 2,207 bridges, or 43% of all state bridges, classified as functionally obsolete. This
means the bridge does not meet design standards that are in line with current practice.
Federal-aid investment in Massachusetts has supported $3.4 billion in bridge construction
spending on 567 bridges between 2003 and 2012, according to FHWA data.2
Since 2004, 366 new bridges have been constructed in the state and 177 bridges have
undergone major reconstruction.
The state estimates that it would cost approximately $12.2 billion to fix a total of 4,652 bridges
in the state.3
Bridge Inventory:
All Bridges Structurally deficient Bridges
Type of Bridge Total
Number
Area (sq.
meters)
Daily
Crossings
Total
Number
Area (sq.
meters)
Daily
Crossings
Rural Bridges
Interstate 91 53,899 2,823,298 4 6,823 154,920
Other principal arterial 60 55,505 908,592 4 20,157 126,717
Minor arterial 123 52,309 664,635 15 5,551 124,903
Major collector 215 61,541 588,358 19 7,063 53,190
Minor collector 122 25,635 175,963 20 4,108 10,872
Local 438 64,012 233,441 55 7,081 22,971
Urban Bridges
Interstate 897 1,367,100 56,390,536 39 152,056 2,433,065
Other freeway 460 502,705 19,909,239 49 87,382 2,038,335
Principal arterial 680 779,007 16,995,886 100 165,993 2,616,822
Minor arterial 963 606,420 15,294,731 101 81,438 1,358,411
Collector 526 281,651 3,344,809 46 29,769 249,417
Local 561 201,004 2,063,781 35 15,140 100,009
Not classified 0 0 0 0 0 0
Total 5,136 4,050,788 119,393,269 487 582,562 9,289,632
1
According to the Federal Highway Administration (FHWA), a bridge is classified as structurally deficient if the condition rating for the deck,
superstructure, substructure or culvert and retaining walls is rated 4 or below or if the bridge receives an appraisal rating of 2 or less for
structural condition or waterway adequacy. During inspections, the condition of a variety of bridge elements are rated on a scale of 0 (failed
condition) to 9 (excellent condition). A rating of 4 is considered “poor” condition and the individual element displays signs of advanced section
loss, deterioration, spalling or scour.
2
ARTBA analysis of FHWA data, includes all bridge construction related spending on projects approved by FHWA between 2003 and 2012.
3
This data is provided by bridge owners as part of the FHWA data and is required for any bridge eligible for the Highway Bridge Replacement
and Rehabilitation Program. However, for some states this amount is very low and likely not an accurate reflection of current costs.
State Bridge Profile
Massachusetts
- 2. © 2014 The American Road & Transportation Builders Association (ARTBA). All rights reserved. No part of this document may be reproduced or
transmitted in any form or by any means, electronic, mechanical, photocopying, recording, or otherwise, without prior written permission of
ARTBA.
Proposed bridge work:
Type of Work Number Cost (millions) Daily Crossings Area (sq. meters)
Bridge replacement 464 $2,364.7 4,433,529 369,950
Widening & rehabilitation 1,557 $1,853.5 32,225,910 844,690
Rehabilitation 2,316 $7,714.6 60,810,629 2,179,066
Deck rehabilitation/replacement 32 $96.3 1,371,666 53,728
Other work 283 $138.5 9,670,935 248,828
Top 10 Most Traveled Structurally Deficient Bridges in the State
County Year
Built
Daily
Crossings
Type of Bridge Location
(route/water under the bridge, traffic on the bridge and location)
Middlesex 1950 172,000 Urban
freeway/expressway
RR MBTA/BMRR, I 95 /ST128, .32 KM SLY RTS 20 & 128
Middlesex 1961 160,000 Urban Interstate WATER CHARLES RIVER, I 95 /ST128, NEWTON WESTON
TWN LINE
Norfolk 1978 138,200 Urban
freeway/expressway
HWY RAMP C (Q ADAMS), ST 3 SB, AT ST 3 SB
Middlesex 1961 133,000 Urban Interstate RR BMRR, I 495 NB, .40 KM SW RTE 38
Suffolk 1964 121,547 Urban Interstate HWY BROOKS ST, I 90 WB, .1 MI S. CHARLES RV S34
Suffolk 1964 121,547 Urban Interstate HWY BROOKS ST, I 90 EB, .1 MI S. CHARLES RV S34
Middlesex 1964 105,465 Urban Interstate RR CSX/MBTA, I 90, .1 MI S. CHARLES RV S40
Hampden 1971 104,600 Urban Interstate HWY CITY STS&GARAGE, I 91, JCT VARIOUS CITY STREETS
Suffolk 1964 104,393 Urban Interstate US 20 N BEACON ST, I 90 WB, .2 MI S. CHARLES RV S39
Middlesex 1965 104,393 Urban Interstate RR CSX/MBTA, I 90, .1 MI E.CHARLES RV S11
Sources: All data is from the 2013 National Bridge Inventory, released by the Federal Highway Administration in March 2014.
Note that specific conditions on bridge may have changed as a result of recent work. Cost estimates of bridge work provided as
part of the data and have been adjusted to 2013$ for inflation and estimated project costs. Contract awards data is for state
and local government awards and comes from McGraw Hill. Note that additional bridge investment may be a part of other
contract awards if a smaller bridge project is included with a highway project, and that would not be accounted for in the total
in this profile.