More Related Content
Similar to Louisiana State Bridge Profile
Similar to Louisiana State Bridge Profile (14)
Louisiana State Bridge Profile
- 1. © 2014 The American Road & Transportation Builders Association (ARTBA). All rights reserved. No part of this document may be reproduced or
transmitted in any form or by any means, electronic, mechanical, photocopying, recording, or otherwise, without prior written permission of
ARTBA.
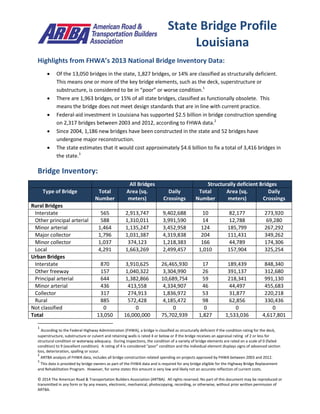
Highlights from FHWA’s 2013 National Bridge Inventory Data:
Of the 13,050 bridges in the state, 1,827 bridges, or 14% are classified as structurally deficient.
This means one or more of the key bridge elements, such as the deck, superstructure or
substructure, is considered to be in “poor” or worse condition.1
There are 1,963 bridges, or 15% of all state bridges, classified as functionally obsolete. This
means the bridge does not meet design standards that are in line with current practice.
Federal-aid investment in Louisiana has supported $2.5 billion in bridge construction spending
on 2,317 bridges between 2003 and 2012, according to FHWA data.2
Since 2004, 1,186 new bridges have been constructed in the state and 52 bridges have
undergone major reconstruction.
The state estimates that it would cost approximately $4.6 billion to fix a total of 3,416 bridges in
the state.3
Bridge Inventory:
All Bridges Structurally deficient Bridges
Type of Bridge Total
Number
Area (sq.
meters)
Daily
Crossings
Total
Number
Area (sq.
meters)
Daily
Crossings
Rural Bridges
Interstate 565 2,913,747 9,402,688 10 82,177 273,920
Other principal arterial 588 1,310,011 3,991,590 14 12,788 69,280
Minor arterial 1,464 1,135,247 3,452,958 124 185,799 267,292
Major collector 1,796 1,031,387 4,319,838 204 111,431 349,262
Minor collector 1,037 374,123 1,218,383 166 44,789 174,306
Local 4,291 1,663,269 2,499,457 1,010 157,904 325,254
Urban Bridges
Interstate 870 3,910,625 26,465,930 17 189,439 848,340
Other freeway 157 1,040,322 3,304,990 26 391,137 312,680
Principal arterial 644 1,382,866 10,689,754 59 218,341 991,130
Minor arterial 436 413,558 4,334,907 46 44,497 455,683
Collector 317 274,913 1,836,972 53 31,877 220,218
Local 885 572,428 4,185,472 98 62,856 330,436
Not classified 0 0 0 0 0 0
Total 13,050 16,000,000 75,702,939 1,827 1,533,036 4,617,801
1
According to the Federal Highway Administration (FHWA), a bridge is classified as structurally deficient if the condition rating for the deck,
superstructure, substructure or culvert and retaining walls is rated 4 or below or if the bridge receives an appraisal rating of 2 or less for
structural condition or waterway adequacy. During inspections, the condition of a variety of bridge elements are rated on a scale of 0 (failed
condition) to 9 (excellent condition). A rating of 4 is considered “poor” condition and the individual element displays signs of advanced section
loss, deterioration, spalling or scour.
2
ARTBA analysis of FHWA data, includes all bridge construction related spending on projects approved by FHWA between 2003 and 2012.
3
This data is provided by bridge owners as part of the FHWA data and is required for any bridge eligible for the Highway Bridge Replacement
and Rehabilitation Program. However, for some states this amount is very low and likely not an accurate reflection of current costs.
State Bridge Profile
Louisiana
- 2. © 2014 The American Road & Transportation Builders Association (ARTBA). All rights reserved. No part of this document may be reproduced or
transmitted in any form or by any means, electronic, mechanical, photocopying, recording, or otherwise, without prior written permission of
ARTBA.
Proposed bridge work:
Type of Work Number Cost (millions) Daily Crossings Area (sq. meters)
Bridge replacement 3,345 $4,496.9 21,202,310 3,841,029
Widening & rehabilitation 0 $0.0 0 0
Rehabilitation 11 $89.1 2,147 18,376
Deck rehabilitation/replacement 0 $0.0 0 0
Other work 60 $24.6 25,462 7,156
Top 10 Most Traveled Structurally Deficient Bridges in the State
County Year
Built
Daily
Crossings
Type of Bridge Location
(route/water under the bridge, traffic on the bridge and location)
Caddo 1965 128,300 Urban Interstate ST. LOUIS & SW RR, I0020, .2 MI EAST OF LA 1
Orleans 1960 72,180 Urban Interstate CITY STREETS /RR, I0010, 3.12 MI EAST OF I-610
Calcasieu 1952 65,800 Urban Interstate CALCASIEU RIVER RR STS, I0010, I-10 OVER LA 378
St. Martin 1970 61,800 Urban Interstate LA 354 OVER I-10, LA0354, 2.2 MI WEST OF LA 347
Jefferson 1967 59,040 Urban Interstate VET MEM HWY, I0010, 1.8 MI EAST OF LA 49
Jefferson 1987 54,960 Urban
freeway/expressway
HARVEY CANAL/STS/RR, US0090B, 1.4 MI WEST OF LA 23
Jefferson 1987 54,960 Urban
freeway/expressway
HARVEY CANAL/STS/RR, US0090B, 1.4 MI WEST OF LA 23
Ouachita 1965 50,580 Urban Interstate CITY ST/ICG RR/OUACHITA, I0020, 05374510616842
Ouachita 1965 50,580 Urban Interstate CITY ST/ICG RR/OUACHITA, I0020, 05374510616841
Jefferson 1971 50,000 Urban local road WEYRAUCH CANAL, LOCAL ROAD, 0.6MI.E.OF MANHATTAN
Sources: All data is from the 2013 National Bridge Inventory, released by the Federal Highway Administration in March 2014.
Note that specific conditions on bridge may have changed as a result of recent work. Cost estimates of bridge work provided as
part of the data and have been adjusted to 2013$ for inflation and estimated project costs. Contract awards data is for state
and local government awards and comes from McGraw Hill. Note that additional bridge investment may be a part of other
contract awards if a smaller bridge project is included with a highway project, and that would not be accounted for in the total
in this profile.