SlideShare a Scribd company logo
1 of 2
Download to read offline
© 2014 The American Road & Transportation Builders Association (ARTBA). All rights reserved. No part of this document may be reproduced or
transmitted in any form or by any means, electronic, mechanical, photocopying, recording, or otherwise, without prior written permission of
ARTBA.
Highlights from FHWA’s 2013 National Bridge Inventory Data:
 Of the 14,769 bridges in the state, 835 bridges, or 6% are classified as structurally deficient. This
means one or more of the key bridge elements, such as the deck, superstructure or
substructure, is considered to be in “poor” or worse condition.1
 There are 1,765 bridges, or 12% of all state bridges, classified as functionally obsolete. This
means the bridge does not meet design standards that are in line with current practice.
 Federal-aid investment in Georgia has supported $1.2 billion in bridge construction spending on
1,337 bridges between 2003 and 2012, according to FHWA data.2
 Since 2004, 1,083 new bridges have been constructed in the state and 246 bridges have
undergone major reconstruction.
 The state estimates that it would cost approximately $14.8 billion to fix a total of 14,743 bridges
in the state.3
Bridge Inventory:
All Bridges Structurally deficient Bridges
Type of Bridge Total
Number
Area (sq.
meters)
Daily
Crossings
Total
Number
Area (sq.
meters)
Daily
Crossings
Rural Bridges
Interstate 426 722,754 15,235,732 6 11,481 242,630
Other principal arterial 983 969,968 7,531,912 18 47,494 109,010
Minor arterial 1,354 838,473 5,082,112 39 25,351 185,900
Major collector 2,625 983,059 3,607,391 123 50,888 143,630
Minor collector 1,170 268,117 1,055,530 91 22,300 50,298
Local 3,423 573,831 2,354,219 413 59,258 121,183
Urban Bridges
Interstate 575 1,164,044 54,816,958 4 1,212 349,190
Other freeway 233 306,505 12,503,940 1 0 26,920
Principal arterial 789 1,165,536 15,297,832 10 21,852 246,630
Minor arterial 1,228 1,088,321 15,285,236 46 33,441 387,027
Collector 602 364,984 4,301,895 16 8,216 84,439
Local 1,361 726,658 6,848,206 68 12,150 105,649
Not classified 0 0 0 0 0 0
Total 14,769 9,172,250 143,920,963 835 293,644 2,052,506
1
According to the Federal Highway Administration (FHWA), a bridge is classified as structurally deficient if the condition rating for the deck,
superstructure, substructure or culvert and retaining walls is rated 4 or below or if the bridge receives an appraisal rating of 2 or less for
structural condition or waterway adequacy. During inspections, the condition of a variety of bridge elements are rated on a scale of 0 (failed
condition) to 9 (excellent condition). A rating of 4 is considered “poor” condition and the individual element displays signs of advanced section
loss, deterioration, spalling or scour.
2
ARTBA analysis of FHWA data, includes all bridge construction related spending on projects approved by FHWA between 2003 and 2012.
3
This data is provided by bridge owners as part of the FHWA data and is required for any bridge eligible for the Highway Bridge Replacement
and Rehabilitation Program. However, for some states this amount is very low and likely not an accurate reflection of current costs.
State Bridge Profile
Georgia
© 2014 The American Road & Transportation Builders Association (ARTBA). All rights reserved. No part of this document may be reproduced or
transmitted in any form or by any means, electronic, mechanical, photocopying, recording, or otherwise, without prior written permission of
ARTBA.
Proposed bridge work:
Type of Work Number Cost (millions) Daily Crossings Area (sq. meters)
Bridge replacement 1,455 $1,042.4 4,294,393 504,067
Widening & rehabilitation 1,251 $1,395.0 9,222,452 748,900
Rehabilitation 12 $16.0 221,016 11,696
Deck rehabilitation/replacement 4 $4.9 49,378 4,869
Other work 12,021 $12,314.5 130,119,000 7,897,801
Top 10 Most Traveled Structurally Deficient Bridges in the State
County Year
Built
Daily
Crossings
Type of Bridge Location
(route/water under the bridge, traffic on the bridge and location)
Cobb 1977 105,710 Urban Interstate CLARK CREEK, I-75 (NBL), AT COBB-CHEROKEE LINE
Cherokee 1976 105,710 Urban Interstate CLARK CREEK, I-75 NBL, 6.5 MI W OF WOODSTOCK
Clayton 1959 91,680 Urban Interstate MUD CREEK, I75 SB R TO I285 E, 0.4 MI N OF JCT SR 85
Coweta 1969 57,670 Rural Interstate TRANSCO GAS LINES, I-85 (SBL), 5 MI NE OF NEWNAN
Coweta 1969 57,670 Rural Interstate TRANSCO GAS LINES, I-85 (NBL), 5 MI NE OF NEWNAN
Chatham 1966 46,090 Urban Interstate SR 421 (I-516), I-16 (WBL), IN SAVANNAH CITY LIMITS
Dooly 1960 44,270 Rural Interstate PENNAHATCHEE CREEK, I-75, .6 MI S OF VIENNA
Newton 1964 41,840 Rural Interstate ALCOVY RIVER, I-20 WBL, 2.5 MI E OF COVINGTON
Lowndes 1961 39,980 Rural Interstate BEVEL CREEK, I-75, APP 2 MI N OF LAKE PARK
Bibb 1924 38,880 Urban other
principal arterial
ROCKY CREEK, US 41 SBL SR 49, SOUTH EDGE OF MACON C.L.
Sources: All data is from the 2013 National Bridge Inventory, released by the Federal Highway Administration in March 2014.
Note that specific conditions on bridge may have changed as a result of recent work. Cost estimates of bridge work provided as
part of the data and have been adjusted to 2013$ for inflation and estimated project costs. Contract awards data is for state
and local government awards and comes from McGraw Hill. Note that additional bridge investment may be a part of other
contract awards if a smaller bridge project is included with a highway project, and that would not be accounted for in the total
in this profile.

More Related Content

What's hot

Arizona State Bridge Profile
Arizona State Bridge ProfileArizona State Bridge Profile
Arizona State Bridge Profileartba
 
Illinois State Bridge Profile
Illinois State Bridge ProfileIllinois State Bridge Profile
Illinois State Bridge Profileartba
 
Maine State Bridge Profile
Maine State Bridge ProfileMaine State Bridge Profile
Maine State Bridge Profileartba
 
Arkansas State Bridge Profile
Arkansas State Bridge ProfileArkansas State Bridge Profile
Arkansas State Bridge Profileartba
 
Ohio State Bridge Profile
Ohio State Bridge ProfileOhio State Bridge Profile
Ohio State Bridge Profileartba
 
Maryland State Bridge Profile
Maryland State Bridge ProfileMaryland State Bridge Profile
Maryland State Bridge Profileartba
 
Texas State Bridge Profile
Texas State Bridge ProfileTexas State Bridge Profile
Texas State Bridge Profileartba
 
Connecticut State Bridge Profile
Connecticut State Bridge ProfileConnecticut State Bridge Profile
Connecticut State Bridge Profileartba
 
Oklahoma State Bridge Profile
Oklahoma State Bridge ProfileOklahoma State Bridge Profile
Oklahoma State Bridge Profileartba
 
New Mexico State Bridge Profile
New Mexico State Bridge ProfileNew Mexico State Bridge Profile
New Mexico State Bridge Profileartba
 
Wisconsin State Bridge Profile
Wisconsin State Bridge ProfileWisconsin State Bridge Profile
Wisconsin State Bridge Profileartba
 
Utah State Bridge Profile
Utah State Bridge ProfileUtah State Bridge Profile
Utah State Bridge Profileartba
 
Vermont State Bridge Profile
Vermont State Bridge ProfileVermont State Bridge Profile
Vermont State Bridge Profileartba
 
New Hampshire State Bridge Profile
New Hampshire State Bridge ProfileNew Hampshire State Bridge Profile
New Hampshire State Bridge Profileartba
 
Missouri State Bridge Profile
Missouri State Bridge ProfileMissouri State Bridge Profile
Missouri State Bridge Profileartba
 
State Bridge Profile New York 2014
State Bridge Profile New York 2014State Bridge Profile New York 2014
State Bridge Profile New York 2014artba
 
Oregon State Bridge Profile
Oregon State Bridge ProfileOregon State Bridge Profile
Oregon State Bridge Profileartba
 
DC State Bridge Profile
DC State Bridge ProfileDC State Bridge Profile
DC State Bridge Profileartba
 
State Bridge Profile North Dakota 2014
State Bridge Profile North Dakota 2014State Bridge Profile North Dakota 2014
State Bridge Profile North Dakota 2014artba
 
Nebraska State Bridge Profile
Nebraska State Bridge ProfileNebraska State Bridge Profile
Nebraska State Bridge Profileartba
 

What's hot (20)

Arizona State Bridge Profile
Arizona State Bridge ProfileArizona State Bridge Profile
Arizona State Bridge Profile
 
Illinois State Bridge Profile
Illinois State Bridge ProfileIllinois State Bridge Profile
Illinois State Bridge Profile
 
Maine State Bridge Profile
Maine State Bridge ProfileMaine State Bridge Profile
Maine State Bridge Profile
 
Arkansas State Bridge Profile
Arkansas State Bridge ProfileArkansas State Bridge Profile
Arkansas State Bridge Profile
 
Ohio State Bridge Profile
Ohio State Bridge ProfileOhio State Bridge Profile
Ohio State Bridge Profile
 
Maryland State Bridge Profile
Maryland State Bridge ProfileMaryland State Bridge Profile
Maryland State Bridge Profile
 
Texas State Bridge Profile
Texas State Bridge ProfileTexas State Bridge Profile
Texas State Bridge Profile
 
Connecticut State Bridge Profile
Connecticut State Bridge ProfileConnecticut State Bridge Profile
Connecticut State Bridge Profile
 
Oklahoma State Bridge Profile
Oklahoma State Bridge ProfileOklahoma State Bridge Profile
Oklahoma State Bridge Profile
 
New Mexico State Bridge Profile
New Mexico State Bridge ProfileNew Mexico State Bridge Profile
New Mexico State Bridge Profile
 
Wisconsin State Bridge Profile
Wisconsin State Bridge ProfileWisconsin State Bridge Profile
Wisconsin State Bridge Profile
 
Utah State Bridge Profile
Utah State Bridge ProfileUtah State Bridge Profile
Utah State Bridge Profile
 
Vermont State Bridge Profile
Vermont State Bridge ProfileVermont State Bridge Profile
Vermont State Bridge Profile
 
New Hampshire State Bridge Profile
New Hampshire State Bridge ProfileNew Hampshire State Bridge Profile
New Hampshire State Bridge Profile
 
Missouri State Bridge Profile
Missouri State Bridge ProfileMissouri State Bridge Profile
Missouri State Bridge Profile
 
State Bridge Profile New York 2014
State Bridge Profile New York 2014State Bridge Profile New York 2014
State Bridge Profile New York 2014
 
Oregon State Bridge Profile
Oregon State Bridge ProfileOregon State Bridge Profile
Oregon State Bridge Profile
 
DC State Bridge Profile
DC State Bridge ProfileDC State Bridge Profile
DC State Bridge Profile
 
State Bridge Profile North Dakota 2014
State Bridge Profile North Dakota 2014State Bridge Profile North Dakota 2014
State Bridge Profile North Dakota 2014
 
Nebraska State Bridge Profile
Nebraska State Bridge ProfileNebraska State Bridge Profile
Nebraska State Bridge Profile
 

Similar to Georgia Bridge Facts: 6% Structurally Deficient, $14.8B Needed for Repairs

Kansas State Bridge Profile
Kansas State Bridge ProfileKansas State Bridge Profile
Kansas State Bridge Profileartba
 
Massachusetts State Bridge Profile
Massachusetts State Bridge ProfileMassachusetts State Bridge Profile
Massachusetts State Bridge Profileartba
 
Rhode Island State Bridge Profile
Rhode Island State Bridge ProfileRhode Island State Bridge Profile
Rhode Island State Bridge Profileartba
 
State Bridge Profile California 2014
State Bridge Profile California 2014State Bridge Profile California 2014
State Bridge Profile California 2014artba
 
North Carolina State Bridge Profile
North Carolina State Bridge ProfileNorth Carolina State Bridge Profile
North Carolina State Bridge Profileartba
 
South Carolina State Bridge Profile
South Carolina State Bridge ProfileSouth Carolina State Bridge Profile
South Carolina State Bridge Profileartba
 
State Bridge Profile South Carolina 2014
State Bridge Profile South Carolina 2014State Bridge Profile South Carolina 2014
State Bridge Profile South Carolina 2014artba
 
State Bridge Profiles Alabama 2014
State Bridge Profiles Alabama 2014State Bridge Profiles Alabama 2014
State Bridge Profiles Alabama 2014artba
 
Washington State Bridge Profile
Washington State Bridge ProfileWashington State Bridge Profile
Washington State Bridge Profileartba
 
State Bridge Profile Arkansas 2014
State Bridge Profile Arkansas 2014State Bridge Profile Arkansas 2014
State Bridge Profile Arkansas 2014artba
 
State Bridge Profile North Carolina 2014
State Bridge Profile North Carolina 2014State Bridge Profile North Carolina 2014
State Bridge Profile North Carolina 2014artba
 
State Bridge Profile Colorado 2014
State Bridge Profile Colorado 2014State Bridge Profile Colorado 2014
State Bridge Profile Colorado 2014artba
 

Similar to Georgia Bridge Facts: 6% Structurally Deficient, $14.8B Needed for Repairs (12)

Kansas State Bridge Profile
Kansas State Bridge ProfileKansas State Bridge Profile
Kansas State Bridge Profile
 
Massachusetts State Bridge Profile
Massachusetts State Bridge ProfileMassachusetts State Bridge Profile
Massachusetts State Bridge Profile
 
Rhode Island State Bridge Profile
Rhode Island State Bridge ProfileRhode Island State Bridge Profile
Rhode Island State Bridge Profile
 
State Bridge Profile California 2014
State Bridge Profile California 2014State Bridge Profile California 2014
State Bridge Profile California 2014
 
North Carolina State Bridge Profile
North Carolina State Bridge ProfileNorth Carolina State Bridge Profile
North Carolina State Bridge Profile
 
South Carolina State Bridge Profile
South Carolina State Bridge ProfileSouth Carolina State Bridge Profile
South Carolina State Bridge Profile
 
State Bridge Profile South Carolina 2014
State Bridge Profile South Carolina 2014State Bridge Profile South Carolina 2014
State Bridge Profile South Carolina 2014
 
State Bridge Profiles Alabama 2014
State Bridge Profiles Alabama 2014State Bridge Profiles Alabama 2014
State Bridge Profiles Alabama 2014
 
Washington State Bridge Profile
Washington State Bridge ProfileWashington State Bridge Profile
Washington State Bridge Profile
 
State Bridge Profile Arkansas 2014
State Bridge Profile Arkansas 2014State Bridge Profile Arkansas 2014
State Bridge Profile Arkansas 2014
 
State Bridge Profile North Carolina 2014
State Bridge Profile North Carolina 2014State Bridge Profile North Carolina 2014
State Bridge Profile North Carolina 2014
 
State Bridge Profile Colorado 2014
State Bridge Profile Colorado 2014State Bridge Profile Colorado 2014
State Bridge Profile Colorado 2014
 

More from artba

2017 media kit
2017 media kit2017 media kit
2017 media kitartba
 
September October tb_2016
September October tb_2016September October tb_2016
September October tb_2016artba
 
Transportation Builder July/August 2016
Transportation Builder July/August 2016Transportation Builder July/August 2016
Transportation Builder July/August 2016artba
 
The National Work Zone Management Conference Agenda 2016
The National Work Zone Management Conference Agenda 2016The National Work Zone Management Conference Agenda 2016
The National Work Zone Management Conference Agenda 2016artba
 
ARTBA 2016 National Convention Program
ARTBA 2016 National Convention ProgramARTBA 2016 National Convention Program
ARTBA 2016 National Convention Programartba
 
May/June Transportation Builder
May/June Transportation BuilderMay/June Transportation Builder
May/June Transportation Builderartba
 
Northeastern regional meeting
Northeastern regional meetingNortheastern regional meeting
Northeastern regional meetingartba
 
Southern regional meeting
Southern regional meetingSouthern regional meeting
Southern regional meetingartba
 
Central regional meeting
Central regional meetingCentral regional meeting
Central regional meetingartba
 
Western regional meeting
Western regional meetingWestern regional meeting
Western regional meetingartba
 
Western regional meeting
Western regional meetingWestern regional meeting
Western regional meetingartba
 
July/August 2015 TB magazine
July/August 2015 TB magazineJuly/August 2015 TB magazine
July/August 2015 TB magazineartba
 
September/October 2015 TB magazine
September/October 2015 TB magazineSeptember/October 2015 TB magazine
September/October 2015 TB magazineartba
 
November/December 2015 TB
November/December 2015 TBNovember/December 2015 TB
November/December 2015 TBartba
 
January/February 2016 TB
January/February 2016 TBJanuary/February 2016 TB
January/February 2016 TBartba
 
March/April 2016 TB
March/April 2016 TBMarch/April 2016 TB
March/April 2016 TBartba
 
2016 ­ARTBA FIP Schedule
2016 ­ARTBA FIP Schedule2016 ­ARTBA FIP Schedule
2016 ­ARTBA FIP Scheduleartba
 
2016 ARTBA FIP Program
2016 ARTBA FIP Program2016 ARTBA FIP Program
2016 ARTBA FIP Programartba
 
2016 ILDP Agenda
2016 ILDP Agenda2016 ILDP Agenda
2016 ILDP Agendaartba
 
P3 Agenda 2016
P3 Agenda 2016P3 Agenda 2016
P3 Agenda 2016artba
 

More from artba (20)

2017 media kit
2017 media kit2017 media kit
2017 media kit
 
September October tb_2016
September October tb_2016September October tb_2016
September October tb_2016
 
Transportation Builder July/August 2016
Transportation Builder July/August 2016Transportation Builder July/August 2016
Transportation Builder July/August 2016
 
The National Work Zone Management Conference Agenda 2016
The National Work Zone Management Conference Agenda 2016The National Work Zone Management Conference Agenda 2016
The National Work Zone Management Conference Agenda 2016
 
ARTBA 2016 National Convention Program
ARTBA 2016 National Convention ProgramARTBA 2016 National Convention Program
ARTBA 2016 National Convention Program
 
May/June Transportation Builder
May/June Transportation BuilderMay/June Transportation Builder
May/June Transportation Builder
 
Northeastern regional meeting
Northeastern regional meetingNortheastern regional meeting
Northeastern regional meeting
 
Southern regional meeting
Southern regional meetingSouthern regional meeting
Southern regional meeting
 
Central regional meeting
Central regional meetingCentral regional meeting
Central regional meeting
 
Western regional meeting
Western regional meetingWestern regional meeting
Western regional meeting
 
Western regional meeting
Western regional meetingWestern regional meeting
Western regional meeting
 
July/August 2015 TB magazine
July/August 2015 TB magazineJuly/August 2015 TB magazine
July/August 2015 TB magazine
 
September/October 2015 TB magazine
September/October 2015 TB magazineSeptember/October 2015 TB magazine
September/October 2015 TB magazine
 
November/December 2015 TB
November/December 2015 TBNovember/December 2015 TB
November/December 2015 TB
 
January/February 2016 TB
January/February 2016 TBJanuary/February 2016 TB
January/February 2016 TB
 
March/April 2016 TB
March/April 2016 TBMarch/April 2016 TB
March/April 2016 TB
 
2016 ­ARTBA FIP Schedule
2016 ­ARTBA FIP Schedule2016 ­ARTBA FIP Schedule
2016 ­ARTBA FIP Schedule
 
2016 ARTBA FIP Program
2016 ARTBA FIP Program2016 ARTBA FIP Program
2016 ARTBA FIP Program
 
2016 ILDP Agenda
2016 ILDP Agenda2016 ILDP Agenda
2016 ILDP Agenda
 
P3 Agenda 2016
P3 Agenda 2016P3 Agenda 2016
P3 Agenda 2016
 

Georgia Bridge Facts: 6% Structurally Deficient, $14.8B Needed for Repairs

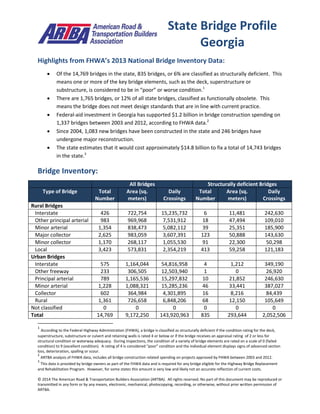
  • 1. © 2014 The American Road & Transportation Builders Association (ARTBA). All rights reserved. No part of this document may be reproduced or transmitted in any form or by any means, electronic, mechanical, photocopying, recording, or otherwise, without prior written permission of ARTBA. Highlights from FHWA’s 2013 National Bridge Inventory Data:  Of the 14,769 bridges in the state, 835 bridges, or 6% are classified as structurally deficient. This means one or more of the key bridge elements, such as the deck, superstructure or substructure, is considered to be in “poor” or worse condition.1  There are 1,765 bridges, or 12% of all state bridges, classified as functionally obsolete. This means the bridge does not meet design standards that are in line with current practice.  Federal-aid investment in Georgia has supported $1.2 billion in bridge construction spending on 1,337 bridges between 2003 and 2012, according to FHWA data.2  Since 2004, 1,083 new bridges have been constructed in the state and 246 bridges have undergone major reconstruction.  The state estimates that it would cost approximately $14.8 billion to fix a total of 14,743 bridges in the state.3 Bridge Inventory: All Bridges Structurally deficient Bridges Type of Bridge Total Number Area (sq. meters) Daily Crossings Total Number Area (sq. meters) Daily Crossings Rural Bridges Interstate 426 722,754 15,235,732 6 11,481 242,630 Other principal arterial 983 969,968 7,531,912 18 47,494 109,010 Minor arterial 1,354 838,473 5,082,112 39 25,351 185,900 Major collector 2,625 983,059 3,607,391 123 50,888 143,630 Minor collector 1,170 268,117 1,055,530 91 22,300 50,298 Local 3,423 573,831 2,354,219 413 59,258 121,183 Urban Bridges Interstate 575 1,164,044 54,816,958 4 1,212 349,190 Other freeway 233 306,505 12,503,940 1 0 26,920 Principal arterial 789 1,165,536 15,297,832 10 21,852 246,630 Minor arterial 1,228 1,088,321 15,285,236 46 33,441 387,027 Collector 602 364,984 4,301,895 16 8,216 84,439 Local 1,361 726,658 6,848,206 68 12,150 105,649 Not classified 0 0 0 0 0 0 Total 14,769 9,172,250 143,920,963 835 293,644 2,052,506 1 According to the Federal Highway Administration (FHWA), a bridge is classified as structurally deficient if the condition rating for the deck, superstructure, substructure or culvert and retaining walls is rated 4 or below or if the bridge receives an appraisal rating of 2 or less for structural condition or waterway adequacy. During inspections, the condition of a variety of bridge elements are rated on a scale of 0 (failed condition) to 9 (excellent condition). A rating of 4 is considered “poor” condition and the individual element displays signs of advanced section loss, deterioration, spalling or scour. 2 ARTBA analysis of FHWA data, includes all bridge construction related spending on projects approved by FHWA between 2003 and 2012. 3 This data is provided by bridge owners as part of the FHWA data and is required for any bridge eligible for the Highway Bridge Replacement and Rehabilitation Program. However, for some states this amount is very low and likely not an accurate reflection of current costs. State Bridge Profile Georgia
  • 2. © 2014 The American Road & Transportation Builders Association (ARTBA). All rights reserved. No part of this document may be reproduced or transmitted in any form or by any means, electronic, mechanical, photocopying, recording, or otherwise, without prior written permission of ARTBA. Proposed bridge work: Type of Work Number Cost (millions) Daily Crossings Area (sq. meters) Bridge replacement 1,455 $1,042.4 4,294,393 504,067 Widening & rehabilitation 1,251 $1,395.0 9,222,452 748,900 Rehabilitation 12 $16.0 221,016 11,696 Deck rehabilitation/replacement 4 $4.9 49,378 4,869 Other work 12,021 $12,314.5 130,119,000 7,897,801 Top 10 Most Traveled Structurally Deficient Bridges in the State County Year Built Daily Crossings Type of Bridge Location (route/water under the bridge, traffic on the bridge and location) Cobb 1977 105,710 Urban Interstate CLARK CREEK, I-75 (NBL), AT COBB-CHEROKEE LINE Cherokee 1976 105,710 Urban Interstate CLARK CREEK, I-75 NBL, 6.5 MI W OF WOODSTOCK Clayton 1959 91,680 Urban Interstate MUD CREEK, I75 SB R TO I285 E, 0.4 MI N OF JCT SR 85 Coweta 1969 57,670 Rural Interstate TRANSCO GAS LINES, I-85 (SBL), 5 MI NE OF NEWNAN Coweta 1969 57,670 Rural Interstate TRANSCO GAS LINES, I-85 (NBL), 5 MI NE OF NEWNAN Chatham 1966 46,090 Urban Interstate SR 421 (I-516), I-16 (WBL), IN SAVANNAH CITY LIMITS Dooly 1960 44,270 Rural Interstate PENNAHATCHEE CREEK, I-75, .6 MI S OF VIENNA Newton 1964 41,840 Rural Interstate ALCOVY RIVER, I-20 WBL, 2.5 MI E OF COVINGTON Lowndes 1961 39,980 Rural Interstate BEVEL CREEK, I-75, APP 2 MI N OF LAKE PARK Bibb 1924 38,880 Urban other principal arterial ROCKY CREEK, US 41 SBL SR 49, SOUTH EDGE OF MACON C.L. Sources: All data is from the 2013 National Bridge Inventory, released by the Federal Highway Administration in March 2014. Note that specific conditions on bridge may have changed as a result of recent work. Cost estimates of bridge work provided as part of the data and have been adjusted to 2013$ for inflation and estimated project costs. Contract awards data is for state and local government awards and comes from McGraw Hill. Note that additional bridge investment may be a part of other contract awards if a smaller bridge project is included with a highway project, and that would not be accounted for in the total in this profile.