More Related Content
Similar to New Hampshire State Bridge Profile
Similar to New Hampshire State Bridge Profile (18)
New Hampshire State Bridge Profile
- 1. © 2014 The American Road & Transportation Builders Association (ARTBA). All rights reserved. No part of this document may be reproduced or
transmitted in any form or by any means, electronic, mechanical, photocopying, recording, or otherwise, without prior written permission of
ARTBA.
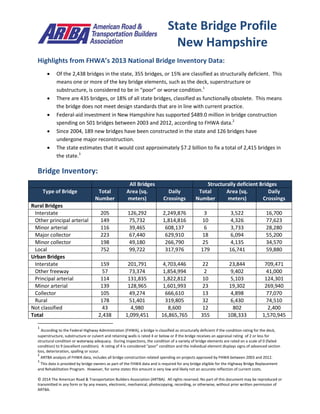
Highlights from FHWA’s 2013 National Bridge Inventory Data:
Of the 2,438 bridges in the state, 355 bridges, or 15% are classified as structurally deficient. This
means one or more of the key bridge elements, such as the deck, superstructure or
substructure, is considered to be in “poor” or worse condition.1
There are 435 bridges, or 18% of all state bridges, classified as functionally obsolete. This means
the bridge does not meet design standards that are in line with current practice.
Federal-aid investment in New Hampshire has supported $489.0 million in bridge construction
spending on 501 bridges between 2003 and 2012, according to FHWA data.2
Since 2004, 189 new bridges have been constructed in the state and 126 bridges have
undergone major reconstruction.
The state estimates that it would cost approximately $7.2 billion to fix a total of 2,415 bridges in
the state.3
Bridge Inventory:
All Bridges Structurally deficient Bridges
Type of Bridge Total
Number
Area (sq.
meters)
Daily
Crossings
Total
Number
Area (sq.
meters)
Daily
Crossings
Rural Bridges
Interstate 205 126,292 2,249,876 3 3,522 16,700
Other principal arterial 149 75,732 1,814,816 10 4,326 77,623
Minor arterial 116 39,465 608,137 6 3,733 28,280
Major collector 223 67,440 629,910 18 6,094 55,200
Minor collector 198 49,180 266,790 25 4,135 34,570
Local 752 99,722 317,976 179 16,741 59,880
Urban Bridges
Interstate 159 201,791 4,703,446 22 23,844 709,471
Other freeway 57 73,374 1,854,994 2 9,402 41,000
Principal arterial 114 131,835 1,822,812 10 5,103 124,301
Minor arterial 139 128,965 1,601,993 23 19,302 269,940
Collector 105 49,274 666,610 13 4,898 77,070
Local 178 51,401 319,805 32 6,430 74,510
Not classified 43 4,980 8,600 12 802 2,400
Total 2,438 1,099,451 16,865,765 355 108,333 1,570,945
1
According to the Federal Highway Administration (FHWA), a bridge is classified as structurally deficient if the condition rating for the deck,
superstructure, substructure or culvert and retaining walls is rated 4 or below or if the bridge receives an appraisal rating of 2 or less for
structural condition or waterway adequacy. During inspections, the condition of a variety of bridge elements are rated on a scale of 0 (failed
condition) to 9 (excellent condition). A rating of 4 is considered “poor” condition and the individual element displays signs of advanced section
loss, deterioration, spalling or scour.
2
ARTBA analysis of FHWA data, includes all bridge construction related spending on projects approved by FHWA between 2003 and 2012.
3
This data is provided by bridge owners as part of the FHWA data and is required for any bridge eligible for the Highway Bridge Replacement
and Rehabilitation Program. However, for some states this amount is very low and likely not an accurate reflection of current costs.
State Bridge Profile
New Hampshire
- 2. © 2014 The American Road & Transportation Builders Association (ARTBA). All rights reserved. No part of this document may be reproduced or
transmitted in any form or by any means, electronic, mechanical, photocopying, recording, or otherwise, without prior written permission of
ARTBA.
Proposed bridge work:
Type of Work Number Cost (millions) Daily Crossings Area (sq. meters)
Bridge replacement 2,404 $7,160.9 16,853,345 1,095,096
Widening & rehabilitation 0 $0.0 0 0
Rehabilitation 3 $0.1 125 432
Deck rehabilitation/replacement 1 $0.0 50 180
Other work 7 $1.6 11,085 2,429
Top 10 Most Traveled Structurally Deficient Bridges in the State
County Year
Built
Daily
Crossings
Type of Bridge Location
(route/water under the bridge, traffic on the bridge and location)
Hillsborough 1956 73,000 Urban Interstate I-293 FEE TPK, I-293 RAMP, 1.5 E JCT RT 28
Hillsborough 1957 73,000 Urban Interstate SPUR D, I-293 FEE TPK, .6 MI BEDFORD TL.
Hillsborough 1957 73,000 Urban Interstate N BR PISCATAQUOG RIVER, I-293 FEE TPK, .3 MI SECOND ST
Hillsborough 1957 73,000 Urban Interstate S BR PISCATAQUOG RIVER, I-293 FEE TPK, .8 MI BEDFORD T.L.
Rockingham 1961 42,000 Urban Interstate NH 97(PELHAM ROAD), I-93 SB, 1.1 MI N OF JCT RT 38
Rockingham 1961 42,000 Urban Interstate NH 97(PELHAM ROAD), I-93 NB, 1.1 MI N OF JCT RT 38
Merrimack 1958 38,371 Urban Interstate I-93, I-393 US 4 US202, 0.4 MI. E. JCT US 3
Hillsborough 1957 36,500 Urban Interstate S BR PISCATAQUOG RIVER, I-293 FEE TPK SPUR, 0.7 MI
BEDFORD T.L.
Merrimack 1957 36,000 Urban Interstate I-89 TURKEY RIVER, I-93 FEE TPK NB, BOW INTERCHANGE
Merrimack 1958 32,900 Urban minor
arterial
NHRR CONSTITUTION AV., US202, .1 MI WEST JCT I-93
Sources: All data is from the 2013 National Bridge Inventory, released by the Federal Highway Administration in March 2014.
Note that specific conditions on bridge may have changed as a result of recent work. Cost estimates of bridge work provided as
part of the data and have been adjusted to 2013$ for inflation and estimated project costs. Contract awards data is for state
and local government awards and comes from McGraw Hill. Note that additional bridge investment may be a part of other
contract awards if a smaller bridge project is included with a highway project, and that would not be accounted for in the total
in this profile.