More Related Content
Similar to Arkansas State Bridge Profile
Similar to Arkansas State Bridge Profile (11)
Arkansas State Bridge Profile
- 1. © 2014 The American Road & Transportation Builders Association (ARTBA). All rights reserved. No part of this document may be reproduced or
transmitted in any form or by any means, electronic, mechanical, photocopying, recording, or otherwise, without prior written permission of
ARTBA.
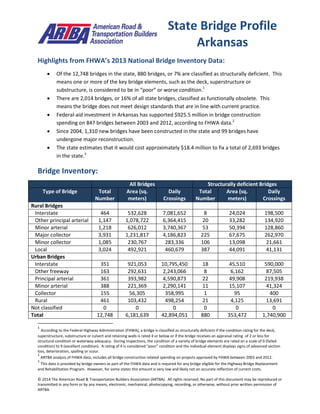
Highlights from FHWA’s 2013 National Bridge Inventory Data:
Of the 12,748 bridges in the state, 880 bridges, or 7% are classified as structurally deficient. This
means one or more of the key bridge elements, such as the deck, superstructure or
substructure, is considered to be in “poor” or worse condition.1
There are 2,014 bridges, or 16% of all state bridges, classified as functionally obsolete. This
means the bridge does not meet design standards that are in line with current practice.
Federal-aid investment in Arkansas has supported $925.5 million in bridge construction
spending on 847 bridges between 2003 and 2012, according to FHWA data.2
Since 2004, 1,310 new bridges have been constructed in the state and 99 bridges have
undergone major reconstruction.
The state estimates that it would cost approximately $18.4 million to fix a total of 2,693 bridges
in the state.3
Bridge Inventory:
All Bridges Structurally deficient Bridges
Type of Bridge Total
Number
Area (sq.
meters)
Daily
Crossings
Total
Number
Area (sq.
meters)
Daily
Crossings
Rural Bridges
Interstate 464 532,628 7,081,652 8 24,024 198,500
Other principal arterial 1,147 1,078,722 6,364,415 20 33,282 134,920
Minor arterial 1,218 626,012 3,740,367 53 50,394 128,860
Major collector 3,931 1,231,817 4,186,823 225 67,675 262,970
Minor collector 1,085 230,767 283,336 106 13,098 21,661
Local 3,024 492,921 460,679 387 44,091 41,131
Urban Bridges
Interstate 351 921,053 10,795,450 18 45,510 590,000
Other freeway 163 292,631 2,243,066 8 6,162 87,505
Principal arterial 361 393,982 4,590,873 22 49,908 219,938
Minor arterial 388 221,369 2,290,141 11 15,107 41,324
Collector 155 56,305 358,995 1 95 400
Local 461 103,432 498,254 21 4,125 13,691
Not classified 0 0 0 0 0 0
Total 12,748 6,181,639 42,894,051 880 353,472 1,740,900
1
According to the Federal Highway Administration (FHWA), a bridge is classified as structurally deficient if the condition rating for the deck,
superstructure, substructure or culvert and retaining walls is rated 4 or below or if the bridge receives an appraisal rating of 2 or less for
structural condition or waterway adequacy. During inspections, the condition of a variety of bridge elements are rated on a scale of 0 (failed
condition) to 9 (excellent condition). A rating of 4 is considered “poor” condition and the individual element displays signs of advanced section
loss, deterioration, spalling or scour.
2
ARTBA analysis of FHWA data, includes all bridge construction related spending on projects approved by FHWA between 2003 and 2012.
3
This data is provided by bridge owners as part of the FHWA data and is required for any bridge eligible for the Highway Bridge Replacement
and Rehabilitation Program. However, for some states this amount is very low and likely not an accurate reflection of current costs.
State Bridge Profile
Arkansas
- 2. © 2014 The American Road & Transportation Builders Association (ARTBA). All rights reserved. No part of this document may be reproduced or
transmitted in any form or by any means, electronic, mechanical, photocopying, recording, or otherwise, without prior written permission of
ARTBA.
Proposed bridge work:
Type of Work Number Cost (millions) Daily Crossings Area (sq. meters)
Bridge replacement 1,956 $2.9 5,941,905 805,643
Widening & rehabilitation 54 $2.5 229,340 35,184
Rehabilitation 649 $10.9 2,100,849 333,886
Deck rehabilitation/replacement 17 $0.0 71,478 12,150
Other work 17 $2.0 4,792 4,735
Top 10 Most Traveled Structurally Deficient Bridges in the State
County Year
Built
Daily
Crossings
Type of Bridge Location
(route/water under the bridge, traffic on the bridge and location)
Pulaski 1961 116,000 Urban Interstate UNION PACIFIC RR, I-30 Log 141.70, 1.1 MI SO OF I-40(I-8)
Pulaski 1977 54,500 Urban Interstate MISS AVE RUSHING CREEK, I-630 WB Log 5.48, 1.7MI E OF I-
430
Pulaski 1977 54,500 Urban Interstate MISS AVE RUSHING CREEK, I 630 EB Log 5.48, 1.7 E OF I-430
Pulaski 1972 45,000 Urban Interstate BRECKENRIDGE DR., I 430 SB Log 7.32, 1.02 M N OF I-630
Pulaski 1972 45,000 Urban Interstate BRECKENRIDGE DRIVE, I 430 NB Log 7.32, 1.02 M N I-630
Pulaski 1961 43,000 Urban Interstate SH 367 RR CREEK, I-30 WB Log 136.90, 1 MI S OF SH 365
Garland 1977 35,200 Rural arterial BULL BAYOU, US 270-5 Log 17.54, 2.20 MI W JCT OF US 70
Prairie 1968 30,000 Rural Interstate WHITE RIVER, I 40, 3.7 MI W JCT SH 33
Pulaski 1958 30,000 Urban
freeway/expressway
Redmond Rd. UPRR, US 67-SEC 10 NB, 8.60 MI N OF I 40
Saline 1958 30,000 Rural Interstate SALINE RIVER RELIEF, I-30 WB Log 113.95, 2.7 MI SW OF SH 5
@ BENTO
Sources: All data is from the 2013 National Bridge Inventory, released by the Federal Highway Administration in March 2014.
Note that specific conditions on bridge may have changed as a result of recent work. Cost estimates of bridge work provided as
part of the data and have been adjusted to 2013$ for inflation and estimated project costs. Contract awards data is for state
and local government awards and comes from McGraw Hill. Note that additional bridge investment may be a part of other
contract awards if a smaller bridge project is included with a highway project, and that would not be accounted for in the total
in this profile.