More Related Content
Similar to Oregon State Bridge Profile
Similar to Oregon State Bridge Profile (15)
Oregon State Bridge Profile
- 1. © 2014 The American Road & Transportation Builders Association (ARTBA). All rights reserved. No part of this document may be reproduced or
transmitted in any form or by any means, electronic, mechanical, photocopying, recording, or otherwise, without prior written permission of
ARTBA.
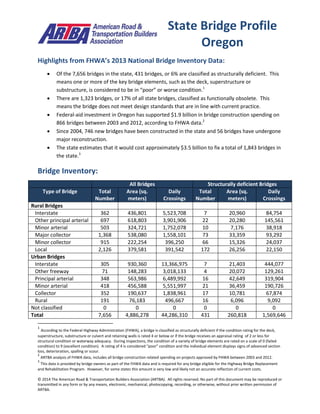
Highlights from FHWA’s 2013 National Bridge Inventory Data:
Of the 7,656 bridges in the state, 431 bridges, or 6% are classified as structurally deficient. This
means one or more of the key bridge elements, such as the deck, superstructure or
substructure, is considered to be in “poor” or worse condition.1
There are 1,323 bridges, or 17% of all state bridges, classified as functionally obsolete. This
means the bridge does not meet design standards that are in line with current practice.
Federal-aid investment in Oregon has supported $1.9 billion in bridge construction spending on
866 bridges between 2003 and 2012, according to FHWA data.2
Since 2004, 746 new bridges have been constructed in the state and 56 bridges have undergone
major reconstruction.
The state estimates that it would cost approximately $3.5 billion to fix a total of 1,843 bridges in
the state.3
Bridge Inventory:
All Bridges Structurally deficient Bridges
Type of Bridge Total
Number
Area (sq.
meters)
Daily
Crossings
Total
Number
Area (sq.
meters)
Daily
Crossings
Rural Bridges
Interstate 362 436,801 5,523,708 7 20,960 84,754
Other principal arterial 697 618,803 3,901,906 22 20,280 145,561
Minor arterial 503 324,721 1,752,078 10 7,176 38,918
Major collector 1,368 538,080 1,558,101 73 33,359 93,292
Minor collector 915 222,254 396,250 66 15,326 24,037
Local 2,126 379,581 391,542 172 26,256 22,150
Urban Bridges
Interstate 305 930,360 13,366,975 7 21,403 444,077
Other freeway 71 148,283 3,018,133 4 20,072 129,261
Principal arterial 348 563,986 6,489,992 16 42,649 319,904
Minor arterial 418 456,588 5,551,997 21 36,459 190,726
Collector 352 190,637 1,838,961 17 10,781 67,874
Local 191 76,183 496,667 16 6,096 9,092
Not classified 0 0 0 0 0 0
Total 7,656 4,886,278 44,286,310 431 260,818 1,569,646
1
According to the Federal Highway Administration (FHWA), a bridge is classified as structurally deficient if the condition rating for the deck,
superstructure, substructure or culvert and retaining walls is rated 4 or below or if the bridge receives an appraisal rating of 2 or less for
structural condition or waterway adequacy. During inspections, the condition of a variety of bridge elements are rated on a scale of 0 (failed
condition) to 9 (excellent condition). A rating of 4 is considered “poor” condition and the individual element displays signs of advanced section
loss, deterioration, spalling or scour.
2
ARTBA analysis of FHWA data, includes all bridge construction related spending on projects approved by FHWA between 2003 and 2012.
3
This data is provided by bridge owners as part of the FHWA data and is required for any bridge eligible for the Highway Bridge Replacement
and Rehabilitation Program. However, for some states this amount is very low and likely not an accurate reflection of current costs.
State Bridge Profile
Oregon
- 2. © 2014 The American Road & Transportation Builders Association (ARTBA). All rights reserved. No part of this document may be reproduced or
transmitted in any form or by any means, electronic, mechanical, photocopying, recording, or otherwise, without prior written permission of
ARTBA.
Proposed bridge work:
Type of Work Number Cost (millions) Daily Crossings Area (sq. meters)
Bridge replacement 375 $440.3 1,401,646 233,584
Widening & rehabilitation 1,144 $2,859.3 12,154,077 1,232,361
Rehabilitation 9 $3.3 2,271 1,481
Deck rehabilitation/replacement 4 $0.3 1,551 538
Other work 311 $193.3 17,435 62,929
Top 10 Most Traveled Structurally Deficient Bridges in the State
County Year
Built
Daily
Crossings
Type of Bridge Location
(route/water under the bridge, traffic on the bridge and location)
Multnomah 1959 138,300 Urban Interstate IOWA STREET VIADUCT, I-5 (HWY 001), 1.7 MI N
MULTNOMAH BLVD
Multnomah 1959 123,200 Urban Interstate JANTZEN PED TUNNEL, I-5 (HWY 001), 0.5 MI S OF
INTERSTATE BR
Lane 1950 72,862 Urban other
principal arterial
WILLAMETTE RIVER, COBURG ROAD, WILLAMETTE R AT
COBURG RD
Lane 1967 59,600 Urban Interstate WILLAMETTE RIVER, 1-105 (HWY 227), 00.8 MI E OR99W JCT
Lane 1967 59,600 Urban Interstate FUTURE HWY 62, I-105 (HWY 227), 00.6 MI N OR99W JCT
Multnomah 1916 47,000 Urban other
principal arterial
UPRR, OR 99E(HWY 001E), 3.9 MI N PORTLAND CC
Lane 1961 44,307 Urban
freeway/expressway
WILLAMETTE R & RIVER AVE, HWY 69 (WB), 03.3 N JCT HWY
01W
Marion 1953 42,400 Urban
freeway/expressway
WILLAMETTE RIVER, OR 22 (HWY 30) WB, IN SALEM
Lane 1967 40,854 Urban
freeway/expressway
WILLAMETTE R & RIVER AVE, HWY 69 (EB), 3.3 N JCT HWY
01W
Multnomah 1925 33,495 Urban minor arterial WILLAMETTE RIVER, TACOMA STREET, PORTLAND
Sources: All data is from the 2013 National Bridge Inventory, released by the Federal Highway Administration in March 2014.
Note that specific conditions on bridge may have changed as a result of recent work. Cost estimates of bridge work provided as
part of the data and have been adjusted to 2013$ for inflation and estimated project costs. Contract awards data is for state
and local government awards and comes from McGraw Hill. Note that additional bridge investment may be a part of other
contract awards if a smaller bridge project is included with a highway project, and that would not be accounted for in the total
in this profile.