More Related Content
Similar to Kansas State Bridge Profile
Similar to Kansas State Bridge Profile (13)
Kansas State Bridge Profile
- 1. © 2014 The American Road & Transportation Builders Association (ARTBA). All rights reserved. No part of this document may be reproduced or
transmitted in any form or by any means, electronic, mechanical, photocopying, recording, or otherwise, without prior written permission of
ARTBA.
Highlights from FHWA’s 2013 National Bridge Inventory Data:
Of the 25,171 bridges in the state, 2,554 bridges, or 10% are classified as structurally deficient.
This means one or more of the key bridge elements, such as the deck, superstructure or
substructure, is considered to be in “poor” or worse condition.1
There are 1,911 bridges, or 8% of all state bridges, classified as functionally obsolete. This
means the bridge does not meet design standards that are in line with current practice.
Federal-aid investment in Kansas has supported $949.5 million in bridge construction spending
on 1,467 bridges between 2003 and 2012, according to FHWA data.2
Since 2004, 1,792 new bridges have been constructed in the state and 222 bridges have
undergone major reconstruction.
The state estimates that it would cost approximately $3.0 billion to fix a total of 11,394 bridges
in the state.3
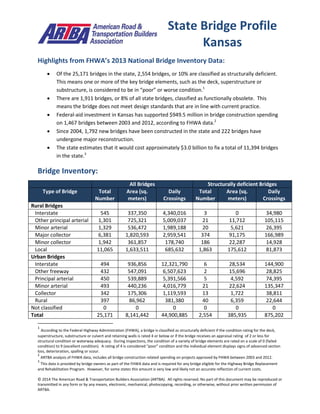
Bridge Inventory:
All Bridges Structurally deficient Bridges
Type of Bridge Total
Number
Area (sq.
meters)
Daily
Crossings
Total
Number
Area (sq.
meters)
Daily
Crossings
Rural Bridges
Interstate 545 337,350 4,340,016 3 0 34,980
Other principal arterial 1,301 725,321 5,009,037 21 11,712 105,115
Minor arterial 1,329 536,472 1,989,188 20 5,621 26,395
Major collector 6,381 1,820,593 2,959,541 374 91,175 166,989
Minor collector 1,942 361,857 178,740 186 22,287 14,928
Local 11,065 1,633,511 685,632 1,863 175,612 81,873
Urban Bridges
Interstate 494 936,856 12,321,790 6 28,534 144,900
Other freeway 432 547,091 6,507,623 2 15,696 28,825
Principal arterial 450 539,889 5,391,566 5 4,592 74,395
Minor arterial 493 440,236 4,016,779 21 22,624 135,347
Collector 342 175,306 1,119,593 13 1,722 38,811
Local 397 86,962 381,380 40 6,359 22,644
Not classified 0 0 0 0 0 0
Total 25,171 8,141,442 44,900,885 2,554 385,935 875,202
1
According to the Federal Highway Administration (FHWA), a bridge is classified as structurally deficient if the condition rating for the deck,
superstructure, substructure or culvert and retaining walls is rated 4 or below or if the bridge receives an appraisal rating of 2 or less for
structural condition or waterway adequacy. During inspections, the condition of a variety of bridge elements are rated on a scale of 0 (failed
condition) to 9 (excellent condition). A rating of 4 is considered “poor” condition and the individual element displays signs of advanced section
loss, deterioration, spalling or scour.
2
ARTBA analysis of FHWA data, includes all bridge construction related spending on projects approved by FHWA between 2003 and 2012.
3
This data is provided by bridge owners as part of the FHWA data and is required for any bridge eligible for the Highway Bridge Replacement
and Rehabilitation Program. However, for some states this amount is very low and likely not an accurate reflection of current costs.
State Bridge Profile
Kansas
- 2. © 2014 The American Road & Transportation Builders Association (ARTBA). All rights reserved. No part of this document may be reproduced or
transmitted in any form or by any means, electronic, mechanical, photocopying, recording, or otherwise, without prior written permission of
ARTBA.
Proposed bridge work:
Type of Work Number Cost (millions) Daily Crossings Area (sq. meters)
Bridge replacement 4,076 $1,147.0 1,557,410 671,832
Widening & rehabilitation 28 $3.8 122,291 31,150
Rehabilitation 1,697 $291.9 679,357 298,631
Deck rehabilitation/replacement 5,415 $1,481.9 34,608,627 4,085,692
Other work 178 $63.9 342,418 47,049
Top 10 Most Traveled Structurally Deficient Bridges in the State
County Year
Built
Daily
Crossings
Type of Bridge Location
(route/water under the bridge, traffic on the bridge and location)
Wyandotte 1964 49,900 Urban Interstate SW BLVD RR I35 SB RMP, I35 HWY SB, 1.22 MI NE US 69
Douglas 1931 30,500 Urban other
principal arterial
LOCAL ST & Rails to Trls, K10 HWY, 1.75 MI E US59
Wyandotte 1959 28,400 Urban
freeway/expressway
KANSAS RIVER BNSF RR, 69 HWY (18TH ST), 2.05 MILES N I-
35
Wyandotte 1907 22,300 Urban Interstate KANSAS RIVER 3 RR 5 ST, I-70 EB HIGHWAY, 0.34 MILES W
MO ST LINE
Shawnee 1950 21,724 Urban minor arterial Butcher Cr., SE 29th, 332m E. of 29th & Ks. Ave
Sedgwick 1960 21,700 Urban Interstate LITTLE ARKANSAS RIVER, I235 HWY NB, 1.38 MI E K96 NB
Sedgwick 1960 21,700 Urban Interstate LITTLE ARKANSAS RIVER, I235 HWY SB, 1.39 MI E K96 SB
Sumner 1955 15,200 Rural Interstate DRAINAGE CHANNEL, I35 HWY (KTA)EL-WL, 0.50 MI N OKLA
STATE LINE
Sedgwick 1970 14,650 Urban Interstate CHISHOLM CREEK, I135 HWY SB, 2.98 MI N I235 SB
Sedgwick 1970 14,650 Urban Interstate CHISHOLM CREEK, I135 HWY NB, 2.97 MI N I235 NB
Sources: All data is from the 2013 National Bridge Inventory, released by the Federal Highway Administration in March 2014.
Note that specific conditions on bridge may have changed as a result of recent work. Cost estimates of bridge work provided as
part of the data and have been adjusted to 2013$ for inflation and estimated project costs. Contract awards data is for state
and local government awards and comes from McGraw Hill. Note that additional bridge investment may be a part of other
contract awards if a smaller bridge project is included with a highway project, and that would not be accounted for in the total
in this profile.