SlideShare a Scribd company logo
1 of 2
Download to read offline
© 2014 The American Road & Transportation Builders Association (ARTBA). All rights reserved. No part of this document may be reproduced or
transmitted in any form or by any means, electronic, mechanical, photocopying, recording, or otherwise, without prior written permission of
ARTBA.
Highlights from FHWA’s 2013 National Bridge Inventory Data:
 Of the 20,058 bridges in the state, 1,157 bridges, or 6% are classified as structurally deficient.
This means one or more of the key bridge elements, such as the deck, superstructure or
substructure, is considered to be in “poor” or worse condition.1
 There are 2,645 bridges, or 13% of all state bridges, classified as functionally obsolete. This
means the bridge does not meet design standards that are in line with current practice.
 Federal-aid investment in Tennessee has supported $1.1 billion in bridge construction spending
on 1,522 bridges between 2003 and 2012, according to FHWA data.2
 Since 2004, 1,571 new bridges have been constructed in the state and 208 bridges have
undergone major reconstruction.
 The state estimates that it would cost approximately $9.7 billion to fix a total of 7,411 bridges in
the state.3
Bridge Inventory:
All Bridges Structurally deficient Bridges
Type of Bridge Total
Number
Area (sq.
meters)
Daily
Crossings
Total
Number
Area (sq.
meters)
Daily
Crossings
Rural Bridges
Interstate 703 714,226 24,325,650 17 32,660 660,050
Other principal arterial 1,237 1,138,960 11,631,016 15 31,442 109,440
Minor arterial 1,537 875,821 7,428,276 89 96,002 500,720
Major collector 2,030 681,889 3,947,634 87 40,783 138,810
Minor collector 3,326 791,516 2,808,481 199 45,073 138,400
Local 6,915 1,042,473 1,910,263 571 66,555 104,916
Urban Bridges
Interstate 718 1,284,315 53,393,130 14 37,120 1,286,060
Other freeway 317 554,531 10,491,195 7 10,267 383,160
Principal arterial 989 1,223,643 19,879,680 37 75,933 908,840
Minor arterial 883 712,922 9,572,578 43 43,584 455,470
Collector 436 177,741 1,913,075 22 9,338 105,240
Local 967 262,927 1,810,893 56 15,851 79,995
Not classified 0 0 0 0 0 0
Total 20,058 9,460,965 149,111,871 1,157 504,607 4,871,101
1
According to the Federal Highway Administration (FHWA), a bridge is classified as structurally deficient if the condition rating for the deck,
superstructure, substructure or culvert and retaining walls is rated 4 or below or if the bridge receives an appraisal rating of 2 or less for
structural condition or waterway adequacy. During inspections, the condition of a variety of bridge elements are rated on a scale of 0 (failed
condition) to 9 (excellent condition). A rating of 4 is considered “poor” condition and the individual element displays signs of advanced section
loss, deterioration, spalling or scour.
2
ARTBA analysis of FHWA data, includes all bridge construction related spending on projects approved by FHWA between 2003 and 2012.
3
This data is provided by bridge owners as part of the FHWA data and is required for any bridge eligible for the Highway Bridge Replacement
and Rehabilitation Program. However, for some states this amount is very low and likely not an accurate reflection of current costs.
State Bridge Profile
Tennessee
© 2014 The American Road & Transportation Builders Association (ARTBA). All rights reserved. No part of this document may be reproduced or
transmitted in any form or by any means, electronic, mechanical, photocopying, recording, or otherwise, without prior written permission of
ARTBA.
Proposed bridge work:
Type of Work Number Cost (millions) Daily Crossings Area (sq. meters)
Bridge replacement 1,223 $2,974.2 4,185,421 490,538
Widening & rehabilitation 3,594 $1,396.0 19,319,886 1,355,129
Rehabilitation 2,275 $4,543.1 34,225,764 1,238,500
Deck rehabilitation/replacement 111 $478.3 1,116,704 194,141
Other work 208 $310.1 997,213 79,761
Top 10 Most Traveled Structurally Deficient Bridges in the State
County Year
Built
Daily
Crossings
Type of Bridge Location
(route/water under the bridge, traffic on the bridge and location)
Shelby 1963 147,030 Urban Interstate I-240 EB / BNSF RWY, I-240EB 663405H, 0.39 MI W OF SR-4
JCT.
Davidson 1961 127,370 Urban Interstate I24 / WOODLAND STREET, I24, I24 / WOODLAND ST
Davidson 1985 101,310 Urban Interstate L4-SN167-RL/L3-SN164&165, I440, I440-I65 LOOP@MELROSE
I/C
Shelby 1963 98,490 Urban Interstate I-240 WB / KERR AVE, I-240 WB, 0.2 MI S. OF S. PKWY JCT.
Shelby 1963 98,490 Urban Interstate I-240EB / KERR AVE, I-240 EB, 0.2 MI S. OF S. PKWY JCT.
Shelby 1962 98,370 Urban Interstate NONCONNAH CREEK, I55, .5 MI S OF I240 JCT
Shelby 1962 98,370 Urban Interstate NONCONNAH CREEK, I55 NB, .5 MI S OF I240 JCT
Shelby 1962 96,990 Urban Interstate I40 RL / SAM COOPER BLVD, I40, I40 & 1240 EAST JCT
Davidson 1967 95,880 Urban Interstate CUMBERLAND RV & COWAN ST, I65 343316H, I65 INNER
LOOP
Davidson 1962 91,630 Urban Interstate I40 / WESTBORO ROAD, I40, I40/ WESTBORO RD
Sources: All data is from the 2013 National Bridge Inventory, released by the Federal Highway Administration in March 2014.
Note that specific conditions on bridge may have changed as a result of recent work. Cost estimates of bridge work provided as
part of the data and have been adjusted to 2013$ for inflation and estimated project costs. Contract awards data is for state
and local government awards and comes from McGraw Hill. Note that additional bridge investment may be a part of other
contract awards if a smaller bridge project is included with a highway project, and that would not be accounted for in the total
in this profile.

More Related Content

What's hot

South Dakota State Bridge Profile
South Dakota State Bridge ProfileSouth Dakota State Bridge Profile
South Dakota State Bridge Profileartba
 
Wisconsin State Bridge Profile
Wisconsin State Bridge ProfileWisconsin State Bridge Profile
Wisconsin State Bridge Profileartba
 
Connecticut State Bridge Profile
Connecticut State Bridge ProfileConnecticut State Bridge Profile
Connecticut State Bridge Profileartba
 
West Virginia State Bridge Profile
West Virginia State Bridge ProfileWest Virginia State Bridge Profile
West Virginia State Bridge Profileartba
 
Maryland State Bridge Profile
Maryland State Bridge ProfileMaryland State Bridge Profile
Maryland State Bridge Profileartba
 
Illinois State Bridge Profile
Illinois State Bridge ProfileIllinois State Bridge Profile
Illinois State Bridge Profileartba
 
Maine State Bridge Profile
Maine State Bridge ProfileMaine State Bridge Profile
Maine State Bridge Profileartba
 
Alabama State Bridge Profile
Alabama State Bridge ProfileAlabama State Bridge Profile
Alabama State Bridge Profileartba
 
Texas State Bridge Profile
Texas State Bridge ProfileTexas State Bridge Profile
Texas State Bridge Profileartba
 
New Mexico State Bridge Profile
New Mexico State Bridge ProfileNew Mexico State Bridge Profile
New Mexico State Bridge Profileartba
 
Ohio State Bridge Profile
Ohio State Bridge ProfileOhio State Bridge Profile
Ohio State Bridge Profileartba
 
Utah State Bridge Profile
Utah State Bridge ProfileUtah State Bridge Profile
Utah State Bridge Profileartba
 
New Hampshire State Bridge Profile
New Hampshire State Bridge ProfileNew Hampshire State Bridge Profile
New Hampshire State Bridge Profileartba
 
Arizona State Bridge Profile
Arizona State Bridge ProfileArizona State Bridge Profile
Arizona State Bridge Profileartba
 
Missouri State Bridge Profile
Missouri State Bridge ProfileMissouri State Bridge Profile
Missouri State Bridge Profileartba
 
Nebraska State Bridge Profile
Nebraska State Bridge ProfileNebraska State Bridge Profile
Nebraska State Bridge Profileartba
 
State Bridge Profile New York 2014
State Bridge Profile New York 2014State Bridge Profile New York 2014
State Bridge Profile New York 2014artba
 
Rhode Island State Bridge Profile
Rhode Island State Bridge ProfileRhode Island State Bridge Profile
Rhode Island State Bridge Profileartba
 
Vermont State Bridge Profile
Vermont State Bridge ProfileVermont State Bridge Profile
Vermont State Bridge Profileartba
 
Oklahoma State Bridge Profile
Oklahoma State Bridge ProfileOklahoma State Bridge Profile
Oklahoma State Bridge Profileartba
 

What's hot (20)

South Dakota State Bridge Profile
South Dakota State Bridge ProfileSouth Dakota State Bridge Profile
South Dakota State Bridge Profile
 
Wisconsin State Bridge Profile
Wisconsin State Bridge ProfileWisconsin State Bridge Profile
Wisconsin State Bridge Profile
 
Connecticut State Bridge Profile
Connecticut State Bridge ProfileConnecticut State Bridge Profile
Connecticut State Bridge Profile
 
West Virginia State Bridge Profile
West Virginia State Bridge ProfileWest Virginia State Bridge Profile
West Virginia State Bridge Profile
 
Maryland State Bridge Profile
Maryland State Bridge ProfileMaryland State Bridge Profile
Maryland State Bridge Profile
 
Illinois State Bridge Profile
Illinois State Bridge ProfileIllinois State Bridge Profile
Illinois State Bridge Profile
 
Maine State Bridge Profile
Maine State Bridge ProfileMaine State Bridge Profile
Maine State Bridge Profile
 
Alabama State Bridge Profile
Alabama State Bridge ProfileAlabama State Bridge Profile
Alabama State Bridge Profile
 
Texas State Bridge Profile
Texas State Bridge ProfileTexas State Bridge Profile
Texas State Bridge Profile
 
New Mexico State Bridge Profile
New Mexico State Bridge ProfileNew Mexico State Bridge Profile
New Mexico State Bridge Profile
 
Ohio State Bridge Profile
Ohio State Bridge ProfileOhio State Bridge Profile
Ohio State Bridge Profile
 
Utah State Bridge Profile
Utah State Bridge ProfileUtah State Bridge Profile
Utah State Bridge Profile
 
New Hampshire State Bridge Profile
New Hampshire State Bridge ProfileNew Hampshire State Bridge Profile
New Hampshire State Bridge Profile
 
Arizona State Bridge Profile
Arizona State Bridge ProfileArizona State Bridge Profile
Arizona State Bridge Profile
 
Missouri State Bridge Profile
Missouri State Bridge ProfileMissouri State Bridge Profile
Missouri State Bridge Profile
 
Nebraska State Bridge Profile
Nebraska State Bridge ProfileNebraska State Bridge Profile
Nebraska State Bridge Profile
 
State Bridge Profile New York 2014
State Bridge Profile New York 2014State Bridge Profile New York 2014
State Bridge Profile New York 2014
 
Rhode Island State Bridge Profile
Rhode Island State Bridge ProfileRhode Island State Bridge Profile
Rhode Island State Bridge Profile
 
Vermont State Bridge Profile
Vermont State Bridge ProfileVermont State Bridge Profile
Vermont State Bridge Profile
 
Oklahoma State Bridge Profile
Oklahoma State Bridge ProfileOklahoma State Bridge Profile
Oklahoma State Bridge Profile
 

Viewers also liked

Viewers also liked (9)

Calendari escolar 14 15 famílies prades
Calendari escolar 14 15 famílies pradesCalendari escolar 14 15 famílies prades
Calendari escolar 14 15 famílies prades
 
Primer trabajo de investigacion
Primer trabajo de investigacionPrimer trabajo de investigacion
Primer trabajo de investigacion
 
Recursos audiovisuales
Recursos audiovisualesRecursos audiovisuales
Recursos audiovisuales
 
certificate_dcbc178fa7cada0134cf8f02ec91074e
certificate_dcbc178fa7cada0134cf8f02ec91074ecertificate_dcbc178fa7cada0134cf8f02ec91074e
certificate_dcbc178fa7cada0134cf8f02ec91074e
 
Hola
HolaHola
Hola
 
Relexion transformacion del aprendizaje
Relexion transformacion del aprendizajeRelexion transformacion del aprendizaje
Relexion transformacion del aprendizaje
 
Hola
HolaHola
Hola
 
Problemas 22 09
Problemas 22 09Problemas 22 09
Problemas 22 09
 
Actividad 1 fisica 2
Actividad 1 fisica 2Actividad 1 fisica 2
Actividad 1 fisica 2
 

Similar to Tennessee Bridge Report: 6% Structurally Deficient, $9.7B Needed for Repairs

State Bridge Profile California 2014
State Bridge Profile California 2014State Bridge Profile California 2014
State Bridge Profile California 2014artba
 
North Carolina State Bridge Profile
North Carolina State Bridge ProfileNorth Carolina State Bridge Profile
North Carolina State Bridge Profileartba
 
Oregon State Bridge Profile
Oregon State Bridge ProfileOregon State Bridge Profile
Oregon State Bridge Profileartba
 
Washington State Bridge Profile
Washington State Bridge ProfileWashington State Bridge Profile
Washington State Bridge Profileartba
 
Louisiana State Bridge Profile
Louisiana State Bridge ProfileLouisiana State Bridge Profile
Louisiana State Bridge Profileartba
 
State Bridge Profile Tennessee 2014
State Bridge Profile Tennessee 2014State Bridge Profile Tennessee 2014
State Bridge Profile Tennessee 2014artba
 
State Bridge Profile North Carolina 2014
State Bridge Profile North Carolina 2014State Bridge Profile North Carolina 2014
State Bridge Profile North Carolina 2014artba
 
Mississippi State Bridge Profile
Mississippi State Bridge ProfileMississippi State Bridge Profile
Mississippi State Bridge Profileartba
 
DC State Bridge Profile
DC State Bridge ProfileDC State Bridge Profile
DC State Bridge Profileartba
 
Indiana State Bridge Profile
Indiana State Bridge ProfileIndiana State Bridge Profile
Indiana State Bridge Profileartba
 
South Carolina State Bridge Profile
South Carolina State Bridge ProfileSouth Carolina State Bridge Profile
South Carolina State Bridge Profileartba
 
Colorado State Bridge Profile
Colorado State Bridge ProfileColorado State Bridge Profile
Colorado State Bridge Profileartba
 

Similar to Tennessee Bridge Report: 6% Structurally Deficient, $9.7B Needed for Repairs (12)

State Bridge Profile California 2014
State Bridge Profile California 2014State Bridge Profile California 2014
State Bridge Profile California 2014
 
North Carolina State Bridge Profile
North Carolina State Bridge ProfileNorth Carolina State Bridge Profile
North Carolina State Bridge Profile
 
Oregon State Bridge Profile
Oregon State Bridge ProfileOregon State Bridge Profile
Oregon State Bridge Profile
 
Washington State Bridge Profile
Washington State Bridge ProfileWashington State Bridge Profile
Washington State Bridge Profile
 
Louisiana State Bridge Profile
Louisiana State Bridge ProfileLouisiana State Bridge Profile
Louisiana State Bridge Profile
 
State Bridge Profile Tennessee 2014
State Bridge Profile Tennessee 2014State Bridge Profile Tennessee 2014
State Bridge Profile Tennessee 2014
 
State Bridge Profile North Carolina 2014
State Bridge Profile North Carolina 2014State Bridge Profile North Carolina 2014
State Bridge Profile North Carolina 2014
 
Mississippi State Bridge Profile
Mississippi State Bridge ProfileMississippi State Bridge Profile
Mississippi State Bridge Profile
 
DC State Bridge Profile
DC State Bridge ProfileDC State Bridge Profile
DC State Bridge Profile
 
Indiana State Bridge Profile
Indiana State Bridge ProfileIndiana State Bridge Profile
Indiana State Bridge Profile
 
South Carolina State Bridge Profile
South Carolina State Bridge ProfileSouth Carolina State Bridge Profile
South Carolina State Bridge Profile
 
Colorado State Bridge Profile
Colorado State Bridge ProfileColorado State Bridge Profile
Colorado State Bridge Profile
 

More from artba

2017 media kit
2017 media kit2017 media kit
2017 media kitartba
 
September October tb_2016
September October tb_2016September October tb_2016
September October tb_2016artba
 
Transportation Builder July/August 2016
Transportation Builder July/August 2016Transportation Builder July/August 2016
Transportation Builder July/August 2016artba
 
The National Work Zone Management Conference Agenda 2016
The National Work Zone Management Conference Agenda 2016The National Work Zone Management Conference Agenda 2016
The National Work Zone Management Conference Agenda 2016artba
 
ARTBA 2016 National Convention Program
ARTBA 2016 National Convention ProgramARTBA 2016 National Convention Program
ARTBA 2016 National Convention Programartba
 
May/June Transportation Builder
May/June Transportation BuilderMay/June Transportation Builder
May/June Transportation Builderartba
 
Northeastern regional meeting
Northeastern regional meetingNortheastern regional meeting
Northeastern regional meetingartba
 
Southern regional meeting
Southern regional meetingSouthern regional meeting
Southern regional meetingartba
 
Central regional meeting
Central regional meetingCentral regional meeting
Central regional meetingartba
 
Western regional meeting
Western regional meetingWestern regional meeting
Western regional meetingartba
 
Western regional meeting
Western regional meetingWestern regional meeting
Western regional meetingartba
 
July/August 2015 TB magazine
July/August 2015 TB magazineJuly/August 2015 TB magazine
July/August 2015 TB magazineartba
 
September/October 2015 TB magazine
September/October 2015 TB magazineSeptember/October 2015 TB magazine
September/October 2015 TB magazineartba
 
November/December 2015 TB
November/December 2015 TBNovember/December 2015 TB
November/December 2015 TBartba
 
January/February 2016 TB
January/February 2016 TBJanuary/February 2016 TB
January/February 2016 TBartba
 
March/April 2016 TB
March/April 2016 TBMarch/April 2016 TB
March/April 2016 TBartba
 
2016 ­ARTBA FIP Schedule
2016 ­ARTBA FIP Schedule2016 ­ARTBA FIP Schedule
2016 ­ARTBA FIP Scheduleartba
 
2016 ARTBA FIP Program
2016 ARTBA FIP Program2016 ARTBA FIP Program
2016 ARTBA FIP Programartba
 
2016 ILDP Agenda
2016 ILDP Agenda2016 ILDP Agenda
2016 ILDP Agendaartba
 
P3 Agenda 2016
P3 Agenda 2016P3 Agenda 2016
P3 Agenda 2016artba
 

More from artba (20)

2017 media kit
2017 media kit2017 media kit
2017 media kit
 
September October tb_2016
September October tb_2016September October tb_2016
September October tb_2016
 
Transportation Builder July/August 2016
Transportation Builder July/August 2016Transportation Builder July/August 2016
Transportation Builder July/August 2016
 
The National Work Zone Management Conference Agenda 2016
The National Work Zone Management Conference Agenda 2016The National Work Zone Management Conference Agenda 2016
The National Work Zone Management Conference Agenda 2016
 
ARTBA 2016 National Convention Program
ARTBA 2016 National Convention ProgramARTBA 2016 National Convention Program
ARTBA 2016 National Convention Program
 
May/June Transportation Builder
May/June Transportation BuilderMay/June Transportation Builder
May/June Transportation Builder
 
Northeastern regional meeting
Northeastern regional meetingNortheastern regional meeting
Northeastern regional meeting
 
Southern regional meeting
Southern regional meetingSouthern regional meeting
Southern regional meeting
 
Central regional meeting
Central regional meetingCentral regional meeting
Central regional meeting
 
Western regional meeting
Western regional meetingWestern regional meeting
Western regional meeting
 
Western regional meeting
Western regional meetingWestern regional meeting
Western regional meeting
 
July/August 2015 TB magazine
July/August 2015 TB magazineJuly/August 2015 TB magazine
July/August 2015 TB magazine
 
September/October 2015 TB magazine
September/October 2015 TB magazineSeptember/October 2015 TB magazine
September/October 2015 TB magazine
 
November/December 2015 TB
November/December 2015 TBNovember/December 2015 TB
November/December 2015 TB
 
January/February 2016 TB
January/February 2016 TBJanuary/February 2016 TB
January/February 2016 TB
 
March/April 2016 TB
March/April 2016 TBMarch/April 2016 TB
March/April 2016 TB
 
2016 ­ARTBA FIP Schedule
2016 ­ARTBA FIP Schedule2016 ­ARTBA FIP Schedule
2016 ­ARTBA FIP Schedule
 
2016 ARTBA FIP Program
2016 ARTBA FIP Program2016 ARTBA FIP Program
2016 ARTBA FIP Program
 
2016 ILDP Agenda
2016 ILDP Agenda2016 ILDP Agenda
2016 ILDP Agenda
 
P3 Agenda 2016
P3 Agenda 2016P3 Agenda 2016
P3 Agenda 2016
 

Tennessee Bridge Report: 6% Structurally Deficient, $9.7B Needed for Repairs

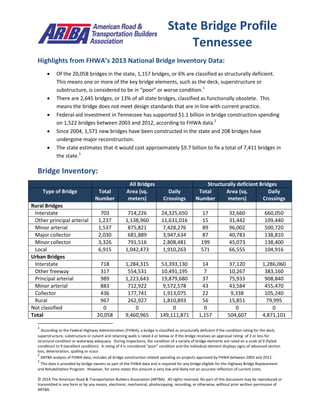
  • 1. © 2014 The American Road & Transportation Builders Association (ARTBA). All rights reserved. No part of this document may be reproduced or transmitted in any form or by any means, electronic, mechanical, photocopying, recording, or otherwise, without prior written permission of ARTBA. Highlights from FHWA’s 2013 National Bridge Inventory Data:  Of the 20,058 bridges in the state, 1,157 bridges, or 6% are classified as structurally deficient. This means one or more of the key bridge elements, such as the deck, superstructure or substructure, is considered to be in “poor” or worse condition.1  There are 2,645 bridges, or 13% of all state bridges, classified as functionally obsolete. This means the bridge does not meet design standards that are in line with current practice.  Federal-aid investment in Tennessee has supported $1.1 billion in bridge construction spending on 1,522 bridges between 2003 and 2012, according to FHWA data.2  Since 2004, 1,571 new bridges have been constructed in the state and 208 bridges have undergone major reconstruction.  The state estimates that it would cost approximately $9.7 billion to fix a total of 7,411 bridges in the state.3 Bridge Inventory: All Bridges Structurally deficient Bridges Type of Bridge Total Number Area (sq. meters) Daily Crossings Total Number Area (sq. meters) Daily Crossings Rural Bridges Interstate 703 714,226 24,325,650 17 32,660 660,050 Other principal arterial 1,237 1,138,960 11,631,016 15 31,442 109,440 Minor arterial 1,537 875,821 7,428,276 89 96,002 500,720 Major collector 2,030 681,889 3,947,634 87 40,783 138,810 Minor collector 3,326 791,516 2,808,481 199 45,073 138,400 Local 6,915 1,042,473 1,910,263 571 66,555 104,916 Urban Bridges Interstate 718 1,284,315 53,393,130 14 37,120 1,286,060 Other freeway 317 554,531 10,491,195 7 10,267 383,160 Principal arterial 989 1,223,643 19,879,680 37 75,933 908,840 Minor arterial 883 712,922 9,572,578 43 43,584 455,470 Collector 436 177,741 1,913,075 22 9,338 105,240 Local 967 262,927 1,810,893 56 15,851 79,995 Not classified 0 0 0 0 0 0 Total 20,058 9,460,965 149,111,871 1,157 504,607 4,871,101 1 According to the Federal Highway Administration (FHWA), a bridge is classified as structurally deficient if the condition rating for the deck, superstructure, substructure or culvert and retaining walls is rated 4 or below or if the bridge receives an appraisal rating of 2 or less for structural condition or waterway adequacy. During inspections, the condition of a variety of bridge elements are rated on a scale of 0 (failed condition) to 9 (excellent condition). A rating of 4 is considered “poor” condition and the individual element displays signs of advanced section loss, deterioration, spalling or scour. 2 ARTBA analysis of FHWA data, includes all bridge construction related spending on projects approved by FHWA between 2003 and 2012. 3 This data is provided by bridge owners as part of the FHWA data and is required for any bridge eligible for the Highway Bridge Replacement and Rehabilitation Program. However, for some states this amount is very low and likely not an accurate reflection of current costs. State Bridge Profile Tennessee
  • 2. © 2014 The American Road & Transportation Builders Association (ARTBA). All rights reserved. No part of this document may be reproduced or transmitted in any form or by any means, electronic, mechanical, photocopying, recording, or otherwise, without prior written permission of ARTBA. Proposed bridge work: Type of Work Number Cost (millions) Daily Crossings Area (sq. meters) Bridge replacement 1,223 $2,974.2 4,185,421 490,538 Widening & rehabilitation 3,594 $1,396.0 19,319,886 1,355,129 Rehabilitation 2,275 $4,543.1 34,225,764 1,238,500 Deck rehabilitation/replacement 111 $478.3 1,116,704 194,141 Other work 208 $310.1 997,213 79,761 Top 10 Most Traveled Structurally Deficient Bridges in the State County Year Built Daily Crossings Type of Bridge Location (route/water under the bridge, traffic on the bridge and location) Shelby 1963 147,030 Urban Interstate I-240 EB / BNSF RWY, I-240EB 663405H, 0.39 MI W OF SR-4 JCT. Davidson 1961 127,370 Urban Interstate I24 / WOODLAND STREET, I24, I24 / WOODLAND ST Davidson 1985 101,310 Urban Interstate L4-SN167-RL/L3-SN164&165, I440, I440-I65 LOOP@MELROSE I/C Shelby 1963 98,490 Urban Interstate I-240 WB / KERR AVE, I-240 WB, 0.2 MI S. OF S. PKWY JCT. Shelby 1963 98,490 Urban Interstate I-240EB / KERR AVE, I-240 EB, 0.2 MI S. OF S. PKWY JCT. Shelby 1962 98,370 Urban Interstate NONCONNAH CREEK, I55, .5 MI S OF I240 JCT Shelby 1962 98,370 Urban Interstate NONCONNAH CREEK, I55 NB, .5 MI S OF I240 JCT Shelby 1962 96,990 Urban Interstate I40 RL / SAM COOPER BLVD, I40, I40 & 1240 EAST JCT Davidson 1967 95,880 Urban Interstate CUMBERLAND RV & COWAN ST, I65 343316H, I65 INNER LOOP Davidson 1962 91,630 Urban Interstate I40 / WESTBORO ROAD, I40, I40/ WESTBORO RD Sources: All data is from the 2013 National Bridge Inventory, released by the Federal Highway Administration in March 2014. Note that specific conditions on bridge may have changed as a result of recent work. Cost estimates of bridge work provided as part of the data and have been adjusted to 2013$ for inflation and estimated project costs. Contract awards data is for state and local government awards and comes from McGraw Hill. Note that additional bridge investment may be a part of other contract awards if a smaller bridge project is included with a highway project, and that would not be accounted for in the total in this profile.