SlideShare a Scribd company logo
1 of 2
Download to read offline
© 2014 The American Road & Transportation Builders Association (ARTBA). All rights reserved. No part of this document may be reproduced or
transmitted in any form or by any means, electronic, mechanical, photocopying, recording, or otherwise, without prior written permission of
ARTBA.
Highlights from FHWA’s 2013 National Bridge Inventory Data:
 Of the 5,291 bridges in the state, 333 bridges, or 6% are classified as structurally deficient. This
means one or more of the key bridge elements, such as the deck, superstructure or
substructure, is considered to be in “poor” or worse condition.1
 There are 1,085 bridges, or 21% of all state bridges, classified as functionally obsolete. This
means the bridge does not meet design standards that are in line with current practice.
 Federal-aid investment in Maryland has supported $1.1 billion in bridge construction spending
on 1,198 bridges between 2003 and 2012, according to FHWA data.2
 Since 2004, 384 new bridges have been constructed in the state and 150 bridges have
undergone major reconstruction.
 The state estimates that it would cost approximately $1.6 billion to fix a total of 1,601 bridges in
the state.3
Bridge Inventory:
All Bridges Structurally deficient Bridges
Type of Bridge Total
Number
Area (sq.
meters)
Daily
Crossings
Total
Number
Area (sq.
meters)
Daily
Crossings
Rural Bridges
Interstate 185 213,980 8,829,983 3 3,071 122,790
Other principal arterial 175 301,484 4,654,879 4 2,866 81,030
Minor arterial 191 111,807 1,604,241 8 2,426 62,398
Major collector 350 146,175 1,454,264 24 8,295 85,549
Minor collector 479 112,582 993,329 31 5,864 56,366
Local 1,012 172,795 1,802,805 113 12,006 50,204
Urban Bridges
Interstate 703 1,767,699 55,409,236 19 48,908 2,269,895
Other freeway 418 797,918 20,065,816 8 7,029 366,268
Principal arterial 459 650,038 12,427,210 28 42,483 725,396
Minor arterial 324 296,635 4,611,032 16 13,521 174,382
Collector 299 177,290 2,108,524 18 3,088 133,051
Local 696 334,812 5,707,716 61 35,643 432,483
Not classified 0 0 0 0 0 0
Total 5,291 5,083,217 119,669,035 333 185,200 4,559,812
1
According to the Federal Highway Administration (FHWA), a bridge is classified as structurally deficient if the condition rating for the deck,
superstructure, substructure or culvert and retaining walls is rated 4 or below or if the bridge receives an appraisal rating of 2 or less for
structural condition or waterway adequacy. During inspections, the condition of a variety of bridge elements are rated on a scale of 0 (failed
condition) to 9 (excellent condition). A rating of 4 is considered “poor” condition and the individual element displays signs of advanced section
loss, deterioration, spalling or scour.
2
ARTBA analysis of FHWA data, includes all bridge construction related spending on projects approved by FHWA between 2003 and 2012.
3
This data is provided by bridge owners as part of the FHWA data and is required for any bridge eligible for the Highway Bridge Replacement
and Rehabilitation Program. However, for some states this amount is very low and likely not an accurate reflection of current costs.
State Bridge Profile
Maryland
© 2014 The American Road & Transportation Builders Association (ARTBA). All rights reserved. No part of this document may be reproduced or
transmitted in any form or by any means, electronic, mechanical, photocopying, recording, or otherwise, without prior written permission of
ARTBA.
Proposed bridge work:
Type of Work Number Cost (millions) Daily Crossings Area (sq. meters)
Bridge replacement 384 $425.5 8,411,376 334,502
Widening & rehabilitation 223 $118.1 3,023,692 199,714
Rehabilitation 576 $431.8 14,916,254 655,263
Deck rehabilitation/replacement 24 $611.4 342,306 172,546
Other work 394 $61.4 4,845,924 471,710
Top 10 Most Traveled Structurally Deficient Bridges in the State
County Year
Built
Daily
Crossings
Type of Bridge Location
(route/water under the bridge, traffic on the bridge and location)
Baltimore 1957 192,702 Urban Interstate US 1 AMTRAK LEEDS AVE, IS 695 IL, 0.77 MILE NORTH OF IS
95
Baltimore 1957 192,302 Urban Interstate MD 372, IS 695 IL, 0.96 MILE NORTH OF US 1
Baltimore 1961 189,237 Urban Interstate MILFORD MILL ROAD, IS 695, 0.74 MILE NORTH OF MD 26
Howard 1970 187,920 Urban Interstate MD 32 WBR, IS 95 NB, 0.14 M S OF GUILFORD ROAD
Prince
George's
1963 185,190 Urban Interstate SUITLAND PARKWAY, IS 95 IL, 0.79 MILE SOUTH OF MD 4
Prince
George's
1963 185,190 Urban Interstate SUITLAND PARKWAY, IS 95 OL, 0.79 MILE SOUTH OF MD 4
Prince
George's
1963 177,270 Urban Interstate SUITLAND ROAD, IS 95 OL, 1.71 MILES SOUTH OF MD 4
Prince
George's
1963 177,270 Urban Interstate SUITLAND ROAD, IS 95 IL, 1.71 MILES SOUTH OF MD 4
Prince
George's
1963 143,828 Urban Interstate MD 414, IS 95/495, 1.56 MILES N OF MD 210
Howard 1970 91,311 Urban
freeway/expressway
IS 95 SBR, MD 32 EB, 1.74 MILES NORTH OF US 1
Sources: All data is from the 2013 National Bridge Inventory, released by the Federal Highway Administration in March 2014.
Note that specific conditions on bridge may have changed as a result of recent work. Cost estimates of bridge work provided as
part of the data and have been adjusted to 2013$ for inflation and estimated project costs. Contract awards data is for state
and local government awards and comes from McGraw Hill. Note that additional bridge investment may be a part of other
contract awards if a smaller bridge project is included with a highway project, and that would not be accounted for in the total
in this profile.

More Related Content

What's hot

Georgia State Bridge Profile
Georgia State Bridge ProfileGeorgia State Bridge Profile
Georgia State Bridge Profileartba
 
Wisconsin State Bridge Profile
Wisconsin State Bridge ProfileWisconsin State Bridge Profile
Wisconsin State Bridge Profileartba
 
Tennessee State Bridge Profile
Tennessee State Bridge ProfileTennessee State Bridge Profile
Tennessee State Bridge Profileartba
 
Kentucky State Bridge Profile
Kentucky State Bridge ProfileKentucky State Bridge Profile
Kentucky State Bridge Profileartba
 
Connecticut State Bridge Profile
Connecticut State Bridge ProfileConnecticut State Bridge Profile
Connecticut State Bridge Profileartba
 
State Bridge Profiles Alabama 2014
State Bridge Profiles Alabama 2014State Bridge Profiles Alabama 2014
State Bridge Profiles Alabama 2014artba
 
New Hampshire State Bridge Profile
New Hampshire State Bridge ProfileNew Hampshire State Bridge Profile
New Hampshire State Bridge Profileartba
 
State Bridge Profile California 2014
State Bridge Profile California 2014State Bridge Profile California 2014
State Bridge Profile California 2014artba
 
State Bridge Profile Kentucky 2014
State Bridge Profile Kentucky 2014State Bridge Profile Kentucky 2014
State Bridge Profile Kentucky 2014artba
 
North Carolina State Bridge Profile
North Carolina State Bridge ProfileNorth Carolina State Bridge Profile
North Carolina State Bridge Profileartba
 
State Bridge Profile Nebraska 2014
State Bridge Profile Nebraska 2014State Bridge Profile Nebraska 2014
State Bridge Profile Nebraska 2014artba
 
Oklahoma State Bridge Profile
Oklahoma State Bridge ProfileOklahoma State Bridge Profile
Oklahoma State Bridge Profileartba
 
Arkansas State Bridge Profile
Arkansas State Bridge ProfileArkansas State Bridge Profile
Arkansas State Bridge Profileartba
 
Rhode Island State Bridge Profile
Rhode Island State Bridge ProfileRhode Island State Bridge Profile
Rhode Island State Bridge Profileartba
 
Nebraska State Bridge Profile
Nebraska State Bridge ProfileNebraska State Bridge Profile
Nebraska State Bridge Profileartba
 
State Bridge Profiles Arizona 2014
State Bridge Profiles Arizona 2014 State Bridge Profiles Arizona 2014
State Bridge Profiles Arizona 2014 artba
 
State Bridge Profile Idaho 2014
State Bridge Profile Idaho 2014State Bridge Profile Idaho 2014
State Bridge Profile Idaho 2014artba
 
Oregon State Bridge Profile
Oregon State Bridge ProfileOregon State Bridge Profile
Oregon State Bridge Profileartba
 
Vermont State Bridge Profile
Vermont State Bridge ProfileVermont State Bridge Profile
Vermont State Bridge Profileartba
 
Indiana State Bridge Profile
Indiana State Bridge ProfileIndiana State Bridge Profile
Indiana State Bridge Profileartba
 

What's hot (20)

Georgia State Bridge Profile
Georgia State Bridge ProfileGeorgia State Bridge Profile
Georgia State Bridge Profile
 
Wisconsin State Bridge Profile
Wisconsin State Bridge ProfileWisconsin State Bridge Profile
Wisconsin State Bridge Profile
 
Tennessee State Bridge Profile
Tennessee State Bridge ProfileTennessee State Bridge Profile
Tennessee State Bridge Profile
 
Kentucky State Bridge Profile
Kentucky State Bridge ProfileKentucky State Bridge Profile
Kentucky State Bridge Profile
 
Connecticut State Bridge Profile
Connecticut State Bridge ProfileConnecticut State Bridge Profile
Connecticut State Bridge Profile
 
State Bridge Profiles Alabama 2014
State Bridge Profiles Alabama 2014State Bridge Profiles Alabama 2014
State Bridge Profiles Alabama 2014
 
New Hampshire State Bridge Profile
New Hampshire State Bridge ProfileNew Hampshire State Bridge Profile
New Hampshire State Bridge Profile
 
State Bridge Profile California 2014
State Bridge Profile California 2014State Bridge Profile California 2014
State Bridge Profile California 2014
 
State Bridge Profile Kentucky 2014
State Bridge Profile Kentucky 2014State Bridge Profile Kentucky 2014
State Bridge Profile Kentucky 2014
 
North Carolina State Bridge Profile
North Carolina State Bridge ProfileNorth Carolina State Bridge Profile
North Carolina State Bridge Profile
 
State Bridge Profile Nebraska 2014
State Bridge Profile Nebraska 2014State Bridge Profile Nebraska 2014
State Bridge Profile Nebraska 2014
 
Oklahoma State Bridge Profile
Oklahoma State Bridge ProfileOklahoma State Bridge Profile
Oklahoma State Bridge Profile
 
Arkansas State Bridge Profile
Arkansas State Bridge ProfileArkansas State Bridge Profile
Arkansas State Bridge Profile
 
Rhode Island State Bridge Profile
Rhode Island State Bridge ProfileRhode Island State Bridge Profile
Rhode Island State Bridge Profile
 
Nebraska State Bridge Profile
Nebraska State Bridge ProfileNebraska State Bridge Profile
Nebraska State Bridge Profile
 
State Bridge Profiles Arizona 2014
State Bridge Profiles Arizona 2014 State Bridge Profiles Arizona 2014
State Bridge Profiles Arizona 2014
 
State Bridge Profile Idaho 2014
State Bridge Profile Idaho 2014State Bridge Profile Idaho 2014
State Bridge Profile Idaho 2014
 
Oregon State Bridge Profile
Oregon State Bridge ProfileOregon State Bridge Profile
Oregon State Bridge Profile
 
Vermont State Bridge Profile
Vermont State Bridge ProfileVermont State Bridge Profile
Vermont State Bridge Profile
 
Indiana State Bridge Profile
Indiana State Bridge ProfileIndiana State Bridge Profile
Indiana State Bridge Profile
 

Viewers also liked

Manual de excel
Manual de excelManual de excel
Manual de excelNelly Malo
 
Calendari escolar 14 15 famílies prades
Calendari escolar 14 15 famílies pradesCalendari escolar 14 15 famílies prades
Calendari escolar 14 15 famílies pradesSerradePrades
 
Ohio State Bridge Profile
Ohio State Bridge ProfileOhio State Bridge Profile
Ohio State Bridge Profileartba
 
Texas State Bridge Profile
Texas State Bridge ProfileTexas State Bridge Profile
Texas State Bridge Profileartba
 
Ageing and managing health
Ageing and managing healthAgeing and managing health
Ageing and managing healthPeter Jones
 
Recent golflayout
Recent golflayoutRecent golflayout
Recent golflayoutslide778
 
Untitled Presentation
Untitled PresentationUntitled Presentation
Untitled PresentationRafael Sousa
 
Actividad extraclase 1
Actividad extraclase 1Actividad extraclase 1
Actividad extraclase 1Al-Hatal Ndsb
 
Vinify poste stagiaire communication
Vinify poste stagiaire communicationVinify poste stagiaire communication
Vinify poste stagiaire communicationAntoine Ayoub
 
Melvin g
Melvin gMelvin g
Melvin gannman5
 
My All Time Favorites
My All Time FavoritesMy All Time Favorites
My All Time Favoritesbrivera2
 

Viewers also liked (17)

Comidas
ComidasComidas
Comidas
 
Manual de excel
Manual de excelManual de excel
Manual de excel
 
musica
musicamusica
musica
 
Calendari escolar 14 15 famílies prades
Calendari escolar 14 15 famílies pradesCalendari escolar 14 15 famílies prades
Calendari escolar 14 15 famílies prades
 
Emilia ferreiro2
Emilia ferreiro2Emilia ferreiro2
Emilia ferreiro2
 
Ohio State Bridge Profile
Ohio State Bridge ProfileOhio State Bridge Profile
Ohio State Bridge Profile
 
NFIL exp certificate
NFIL exp certificateNFIL exp certificate
NFIL exp certificate
 
Finalaya daily wrap_07nov2012
Finalaya daily wrap_07nov2012Finalaya daily wrap_07nov2012
Finalaya daily wrap_07nov2012
 
Texas State Bridge Profile
Texas State Bridge ProfileTexas State Bridge Profile
Texas State Bridge Profile
 
Politicas de datos
Politicas de  datosPoliticas de  datos
Politicas de datos
 
Ageing and managing health
Ageing and managing healthAgeing and managing health
Ageing and managing health
 
Recent golflayout
Recent golflayoutRecent golflayout
Recent golflayout
 
Untitled Presentation
Untitled PresentationUntitled Presentation
Untitled Presentation
 
Actividad extraclase 1
Actividad extraclase 1Actividad extraclase 1
Actividad extraclase 1
 
Vinify poste stagiaire communication
Vinify poste stagiaire communicationVinify poste stagiaire communication
Vinify poste stagiaire communication
 
Melvin g
Melvin gMelvin g
Melvin g
 
My All Time Favorites
My All Time FavoritesMy All Time Favorites
My All Time Favorites
 

Similar to Maryland Bridge Profile: 333 Structurally Deficient Bridges

Illinois State Bridge Profile
Illinois State Bridge ProfileIllinois State Bridge Profile
Illinois State Bridge Profileartba
 
South Dakota State Bridge Profile
South Dakota State Bridge ProfileSouth Dakota State Bridge Profile
South Dakota State Bridge Profileartba
 
New Mexico State Bridge Profile
New Mexico State Bridge ProfileNew Mexico State Bridge Profile
New Mexico State Bridge Profileartba
 
Minnesota State Bridge Profile
Minnesota State Bridge ProfileMinnesota State Bridge Profile
Minnesota State Bridge Profileartba
 
Arizona State Bridge Profile
Arizona State Bridge ProfileArizona State Bridge Profile
Arizona State Bridge Profileartba
 
Missouri State Bridge Profile
Missouri State Bridge ProfileMissouri State Bridge Profile
Missouri State Bridge Profileartba
 
State Bridge Profile North Carolina 2014
State Bridge Profile North Carolina 2014State Bridge Profile North Carolina 2014
State Bridge Profile North Carolina 2014artba
 
Washington State Bridge Profile
Washington State Bridge ProfileWashington State Bridge Profile
Washington State Bridge Profileartba
 
DC State Bridge Profile
DC State Bridge ProfileDC State Bridge Profile
DC State Bridge Profileartba
 
South Carolina State Bridge Profile
South Carolina State Bridge ProfileSouth Carolina State Bridge Profile
South Carolina State Bridge Profileartba
 
Louisiana State Bridge Profile
Louisiana State Bridge ProfileLouisiana State Bridge Profile
Louisiana State Bridge Profileartba
 
Montana State Bridge Profile
Montana State Bridge ProfileMontana State Bridge Profile
Montana State Bridge Profileartba
 
State Bridge Profile South Carolina 2014
State Bridge Profile South Carolina 2014State Bridge Profile South Carolina 2014
State Bridge Profile South Carolina 2014artba
 

Similar to Maryland Bridge Profile: 333 Structurally Deficient Bridges (13)

Illinois State Bridge Profile
Illinois State Bridge ProfileIllinois State Bridge Profile
Illinois State Bridge Profile
 
South Dakota State Bridge Profile
South Dakota State Bridge ProfileSouth Dakota State Bridge Profile
South Dakota State Bridge Profile
 
New Mexico State Bridge Profile
New Mexico State Bridge ProfileNew Mexico State Bridge Profile
New Mexico State Bridge Profile
 
Minnesota State Bridge Profile
Minnesota State Bridge ProfileMinnesota State Bridge Profile
Minnesota State Bridge Profile
 
Arizona State Bridge Profile
Arizona State Bridge ProfileArizona State Bridge Profile
Arizona State Bridge Profile
 
Missouri State Bridge Profile
Missouri State Bridge ProfileMissouri State Bridge Profile
Missouri State Bridge Profile
 
State Bridge Profile North Carolina 2014
State Bridge Profile North Carolina 2014State Bridge Profile North Carolina 2014
State Bridge Profile North Carolina 2014
 
Washington State Bridge Profile
Washington State Bridge ProfileWashington State Bridge Profile
Washington State Bridge Profile
 
DC State Bridge Profile
DC State Bridge ProfileDC State Bridge Profile
DC State Bridge Profile
 
South Carolina State Bridge Profile
South Carolina State Bridge ProfileSouth Carolina State Bridge Profile
South Carolina State Bridge Profile
 
Louisiana State Bridge Profile
Louisiana State Bridge ProfileLouisiana State Bridge Profile
Louisiana State Bridge Profile
 
Montana State Bridge Profile
Montana State Bridge ProfileMontana State Bridge Profile
Montana State Bridge Profile
 
State Bridge Profile South Carolina 2014
State Bridge Profile South Carolina 2014State Bridge Profile South Carolina 2014
State Bridge Profile South Carolina 2014
 

More from artba

2017 media kit
2017 media kit2017 media kit
2017 media kitartba
 
September October tb_2016
September October tb_2016September October tb_2016
September October tb_2016artba
 
Transportation Builder July/August 2016
Transportation Builder July/August 2016Transportation Builder July/August 2016
Transportation Builder July/August 2016artba
 
The National Work Zone Management Conference Agenda 2016
The National Work Zone Management Conference Agenda 2016The National Work Zone Management Conference Agenda 2016
The National Work Zone Management Conference Agenda 2016artba
 
ARTBA 2016 National Convention Program
ARTBA 2016 National Convention ProgramARTBA 2016 National Convention Program
ARTBA 2016 National Convention Programartba
 
May/June Transportation Builder
May/June Transportation BuilderMay/June Transportation Builder
May/June Transportation Builderartba
 
Northeastern regional meeting
Northeastern regional meetingNortheastern regional meeting
Northeastern regional meetingartba
 
Southern regional meeting
Southern regional meetingSouthern regional meeting
Southern regional meetingartba
 
Central regional meeting
Central regional meetingCentral regional meeting
Central regional meetingartba
 
Western regional meeting
Western regional meetingWestern regional meeting
Western regional meetingartba
 
Western regional meeting
Western regional meetingWestern regional meeting
Western regional meetingartba
 
July/August 2015 TB magazine
July/August 2015 TB magazineJuly/August 2015 TB magazine
July/August 2015 TB magazineartba
 
September/October 2015 TB magazine
September/October 2015 TB magazineSeptember/October 2015 TB magazine
September/October 2015 TB magazineartba
 
November/December 2015 TB
November/December 2015 TBNovember/December 2015 TB
November/December 2015 TBartba
 
January/February 2016 TB
January/February 2016 TBJanuary/February 2016 TB
January/February 2016 TBartba
 
March/April 2016 TB
March/April 2016 TBMarch/April 2016 TB
March/April 2016 TBartba
 
2016 ­ARTBA FIP Schedule
2016 ­ARTBA FIP Schedule2016 ­ARTBA FIP Schedule
2016 ­ARTBA FIP Scheduleartba
 
2016 ARTBA FIP Program
2016 ARTBA FIP Program2016 ARTBA FIP Program
2016 ARTBA FIP Programartba
 
2016 ILDP Agenda
2016 ILDP Agenda2016 ILDP Agenda
2016 ILDP Agendaartba
 
P3 Agenda 2016
P3 Agenda 2016P3 Agenda 2016
P3 Agenda 2016artba
 

More from artba (20)

2017 media kit
2017 media kit2017 media kit
2017 media kit
 
September October tb_2016
September October tb_2016September October tb_2016
September October tb_2016
 
Transportation Builder July/August 2016
Transportation Builder July/August 2016Transportation Builder July/August 2016
Transportation Builder July/August 2016
 
The National Work Zone Management Conference Agenda 2016
The National Work Zone Management Conference Agenda 2016The National Work Zone Management Conference Agenda 2016
The National Work Zone Management Conference Agenda 2016
 
ARTBA 2016 National Convention Program
ARTBA 2016 National Convention ProgramARTBA 2016 National Convention Program
ARTBA 2016 National Convention Program
 
May/June Transportation Builder
May/June Transportation BuilderMay/June Transportation Builder
May/June Transportation Builder
 
Northeastern regional meeting
Northeastern regional meetingNortheastern regional meeting
Northeastern regional meeting
 
Southern regional meeting
Southern regional meetingSouthern regional meeting
Southern regional meeting
 
Central regional meeting
Central regional meetingCentral regional meeting
Central regional meeting
 
Western regional meeting
Western regional meetingWestern regional meeting
Western regional meeting
 
Western regional meeting
Western regional meetingWestern regional meeting
Western regional meeting
 
July/August 2015 TB magazine
July/August 2015 TB magazineJuly/August 2015 TB magazine
July/August 2015 TB magazine
 
September/October 2015 TB magazine
September/October 2015 TB magazineSeptember/October 2015 TB magazine
September/October 2015 TB magazine
 
November/December 2015 TB
November/December 2015 TBNovember/December 2015 TB
November/December 2015 TB
 
January/February 2016 TB
January/February 2016 TBJanuary/February 2016 TB
January/February 2016 TB
 
March/April 2016 TB
March/April 2016 TBMarch/April 2016 TB
March/April 2016 TB
 
2016 ­ARTBA FIP Schedule
2016 ­ARTBA FIP Schedule2016 ­ARTBA FIP Schedule
2016 ­ARTBA FIP Schedule
 
2016 ARTBA FIP Program
2016 ARTBA FIP Program2016 ARTBA FIP Program
2016 ARTBA FIP Program
 
2016 ILDP Agenda
2016 ILDP Agenda2016 ILDP Agenda
2016 ILDP Agenda
 
P3 Agenda 2016
P3 Agenda 2016P3 Agenda 2016
P3 Agenda 2016
 

Maryland Bridge Profile: 333 Structurally Deficient Bridges

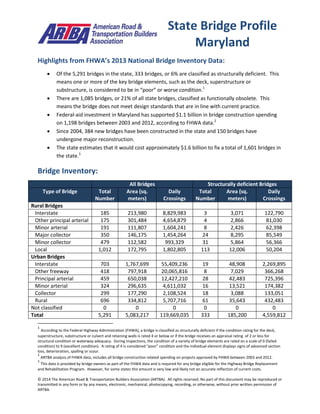
  • 1. © 2014 The American Road & Transportation Builders Association (ARTBA). All rights reserved. No part of this document may be reproduced or transmitted in any form or by any means, electronic, mechanical, photocopying, recording, or otherwise, without prior written permission of ARTBA. Highlights from FHWA’s 2013 National Bridge Inventory Data:  Of the 5,291 bridges in the state, 333 bridges, or 6% are classified as structurally deficient. This means one or more of the key bridge elements, such as the deck, superstructure or substructure, is considered to be in “poor” or worse condition.1  There are 1,085 bridges, or 21% of all state bridges, classified as functionally obsolete. This means the bridge does not meet design standards that are in line with current practice.  Federal-aid investment in Maryland has supported $1.1 billion in bridge construction spending on 1,198 bridges between 2003 and 2012, according to FHWA data.2  Since 2004, 384 new bridges have been constructed in the state and 150 bridges have undergone major reconstruction.  The state estimates that it would cost approximately $1.6 billion to fix a total of 1,601 bridges in the state.3 Bridge Inventory: All Bridges Structurally deficient Bridges Type of Bridge Total Number Area (sq. meters) Daily Crossings Total Number Area (sq. meters) Daily Crossings Rural Bridges Interstate 185 213,980 8,829,983 3 3,071 122,790 Other principal arterial 175 301,484 4,654,879 4 2,866 81,030 Minor arterial 191 111,807 1,604,241 8 2,426 62,398 Major collector 350 146,175 1,454,264 24 8,295 85,549 Minor collector 479 112,582 993,329 31 5,864 56,366 Local 1,012 172,795 1,802,805 113 12,006 50,204 Urban Bridges Interstate 703 1,767,699 55,409,236 19 48,908 2,269,895 Other freeway 418 797,918 20,065,816 8 7,029 366,268 Principal arterial 459 650,038 12,427,210 28 42,483 725,396 Minor arterial 324 296,635 4,611,032 16 13,521 174,382 Collector 299 177,290 2,108,524 18 3,088 133,051 Local 696 334,812 5,707,716 61 35,643 432,483 Not classified 0 0 0 0 0 0 Total 5,291 5,083,217 119,669,035 333 185,200 4,559,812 1 According to the Federal Highway Administration (FHWA), a bridge is classified as structurally deficient if the condition rating for the deck, superstructure, substructure or culvert and retaining walls is rated 4 or below or if the bridge receives an appraisal rating of 2 or less for structural condition or waterway adequacy. During inspections, the condition of a variety of bridge elements are rated on a scale of 0 (failed condition) to 9 (excellent condition). A rating of 4 is considered “poor” condition and the individual element displays signs of advanced section loss, deterioration, spalling or scour. 2 ARTBA analysis of FHWA data, includes all bridge construction related spending on projects approved by FHWA between 2003 and 2012. 3 This data is provided by bridge owners as part of the FHWA data and is required for any bridge eligible for the Highway Bridge Replacement and Rehabilitation Program. However, for some states this amount is very low and likely not an accurate reflection of current costs. State Bridge Profile Maryland
  • 2. © 2014 The American Road & Transportation Builders Association (ARTBA). All rights reserved. No part of this document may be reproduced or transmitted in any form or by any means, electronic, mechanical, photocopying, recording, or otherwise, without prior written permission of ARTBA. Proposed bridge work: Type of Work Number Cost (millions) Daily Crossings Area (sq. meters) Bridge replacement 384 $425.5 8,411,376 334,502 Widening & rehabilitation 223 $118.1 3,023,692 199,714 Rehabilitation 576 $431.8 14,916,254 655,263 Deck rehabilitation/replacement 24 $611.4 342,306 172,546 Other work 394 $61.4 4,845,924 471,710 Top 10 Most Traveled Structurally Deficient Bridges in the State County Year Built Daily Crossings Type of Bridge Location (route/water under the bridge, traffic on the bridge and location) Baltimore 1957 192,702 Urban Interstate US 1 AMTRAK LEEDS AVE, IS 695 IL, 0.77 MILE NORTH OF IS 95 Baltimore 1957 192,302 Urban Interstate MD 372, IS 695 IL, 0.96 MILE NORTH OF US 1 Baltimore 1961 189,237 Urban Interstate MILFORD MILL ROAD, IS 695, 0.74 MILE NORTH OF MD 26 Howard 1970 187,920 Urban Interstate MD 32 WBR, IS 95 NB, 0.14 M S OF GUILFORD ROAD Prince George's 1963 185,190 Urban Interstate SUITLAND PARKWAY, IS 95 IL, 0.79 MILE SOUTH OF MD 4 Prince George's 1963 185,190 Urban Interstate SUITLAND PARKWAY, IS 95 OL, 0.79 MILE SOUTH OF MD 4 Prince George's 1963 177,270 Urban Interstate SUITLAND ROAD, IS 95 OL, 1.71 MILES SOUTH OF MD 4 Prince George's 1963 177,270 Urban Interstate SUITLAND ROAD, IS 95 IL, 1.71 MILES SOUTH OF MD 4 Prince George's 1963 143,828 Urban Interstate MD 414, IS 95/495, 1.56 MILES N OF MD 210 Howard 1970 91,311 Urban freeway/expressway IS 95 SBR, MD 32 EB, 1.74 MILES NORTH OF US 1 Sources: All data is from the 2013 National Bridge Inventory, released by the Federal Highway Administration in March 2014. Note that specific conditions on bridge may have changed as a result of recent work. Cost estimates of bridge work provided as part of the data and have been adjusted to 2013$ for inflation and estimated project costs. Contract awards data is for state and local government awards and comes from McGraw Hill. Note that additional bridge investment may be a part of other contract awards if a smaller bridge project is included with a highway project, and that would not be accounted for in the total in this profile.