More Related Content
Similar to Minnesota State Bridge Profile
Similar to Minnesota State Bridge Profile (14)
Minnesota State Bridge Profile
- 1. © 2014 The American Road & Transportation Builders Association (ARTBA). All rights reserved. No part of this document may be reproduced or
transmitted in any form or by any means, electronic, mechanical, photocopying, recording, or otherwise, without prior written permission of
ARTBA.
Highlights from FHWA’s 2013 National Bridge Inventory Data:
Of the 13,137 bridges in the state, 1,086 bridges, or 8% are classified as structurally deficient.
This means one or more of the key bridge elements, such as the deck, superstructure or
substructure, is considered to be in “poor” or worse condition.1
There are 427 bridges, or 3% of all state bridges, classified as functionally obsolete. This means
the bridge does not meet design standards that are in line with current practice.
Federal-aid investment in Minnesota has supported $1.6 billion in bridge construction spending
on 961 bridges between 2003 and 2012, according to FHWA data.2
Since 2004, 1,334 new bridges have been constructed in the state and 36 bridges have
undergone major reconstruction.
The state estimates that it would cost approximately $1.2 billion to fix a total of 2,607 bridges in
the state.3
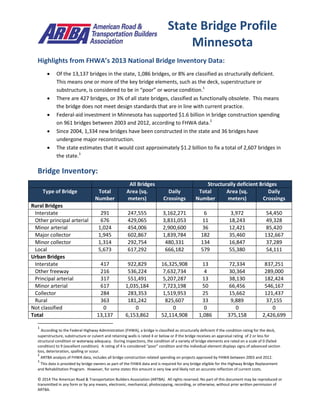
Bridge Inventory:
All Bridges Structurally deficient Bridges
Type of Bridge Total
Number
Area (sq.
meters)
Daily
Crossings
Total
Number
Area (sq.
meters)
Daily
Crossings
Rural Bridges
Interstate 291 247,555 3,162,271 6 3,972 54,450
Other principal arterial 676 429,065 3,831,053 11 18,243 49,328
Minor arterial 1,024 454,006 2,900,600 36 12,421 85,420
Major collector 1,945 602,867 1,839,784 182 35,460 132,667
Minor collector 1,314 292,754 480,331 134 16,847 37,289
Local 5,673 617,292 666,182 579 55,380 54,111
Urban Bridges
Interstate 417 922,829 16,325,908 13 72,334 837,251
Other freeway 216 536,224 7,632,734 4 30,364 289,000
Principal arterial 317 551,491 5,207,287 13 38,130 182,424
Minor arterial 617 1,035,184 7,723,198 50 66,456 546,167
Collector 284 283,353 1,519,953 25 15,662 121,437
Local 363 181,242 825,607 33 9,889 37,155
Not classified 0 0 0 0 0 0
Total 13,137 6,153,862 52,114,908 1,086 375,158 2,426,699
1
According to the Federal Highway Administration (FHWA), a bridge is classified as structurally deficient if the condition rating for the deck,
superstructure, substructure or culvert and retaining walls is rated 4 or below or if the bridge receives an appraisal rating of 2 or less for
structural condition or waterway adequacy. During inspections, the condition of a variety of bridge elements are rated on a scale of 0 (failed
condition) to 9 (excellent condition). A rating of 4 is considered “poor” condition and the individual element displays signs of advanced section
loss, deterioration, spalling or scour.
2
ARTBA analysis of FHWA data, includes all bridge construction related spending on projects approved by FHWA between 2003 and 2012.
3
This data is provided by bridge owners as part of the FHWA data and is required for any bridge eligible for the Highway Bridge Replacement
and Rehabilitation Program. However, for some states this amount is very low and likely not an accurate reflection of current costs.
State Bridge Profile
Minnesota
- 2. © 2014 The American Road & Transportation Builders Association (ARTBA). All rights reserved. No part of this document may be reproduced or
transmitted in any form or by any means, electronic, mechanical, photocopying, recording, or otherwise, without prior written permission of
ARTBA.
Proposed bridge work:
Type of Work Number Cost (millions) Daily Crossings Area (sq. meters)
Bridge replacement 2,057 $1,091.0 7,246,669 753,299
Widening & rehabilitation 415 $70.7 2,358,952 132,808
Rehabilitation 9 $12.5 146,135 23,997
Deck rehabilitation/replacement 46 $36.8 725,781 44,254
Other work 80 $33.2 698,317 49,614
Top 10 Most Traveled Structurally Deficient Bridges in the State
County Year
Built
Daily
Crossings
Type of Bridge Location
(route/water under the bridge, traffic on the bridge and location)
Ramsey 1964 154,000 Urban Interstate PENNSYLVANIA AVE, I 35E, 0.5 MI N OF E JCT TH 94
Ramsey 1963 149,000 Urban Interstate BNSF RR, I 35E, 0.7 MI N OF E JCT TH 94
Ramsey 1965 148,000 Urban Interstate Cayuga St & BNSF RR, I 35E, 0.9 MI N OF E JCT TH 94
Ramsey 1938 85,000 Urban
freeway/expressway
LEXINGTON AVE(CSAH 51), TH 36, 1.0 Mi East of Jct TH 51
Ramsey 1968 81,000 Urban
freeway/expressway
MISS R RR & STREETS, US 52(Lafayette), 0.2 MI SE OF JCT TH
94
Ramsey 1965 74,000 Urban
freeway/expressway
UP RR & Eaton ST, Lafayette (US 52), 0.2 MI N OF JCT TH 56
Hennepin 2008 70,000 Urban Interstate Miss R W R PKWY RD& RR, I 35W SB, 1.0 MI NE OF JCT TH94
Hennepin 2008 70,000 Urban Interstate Miss R W R PKWY RD& RR, I 35W NB, 1.0 MI NE OF JCT TH
94
St. Louis 1970 59,000 Urban Interstate UNSTABLE MATERIAL, I 35, 0.3 MI N OF GARFIELD AVE
Hennepin 2008 49,000 Urban
freeway/expressway
I 35W & NICOLLET AVE S, TH 62 WB, AT THE E JCT MN 62 &
35W
Sources: All data is from the 2013 National Bridge Inventory, released by the Federal Highway Administration in March 2014.
Note that specific conditions on bridge may have changed as a result of recent work. Cost estimates of bridge work provided as
part of the data and have been adjusted to 2013$ for inflation and estimated project costs. Contract awards data is for state
and local government awards and comes from McGraw Hill. Note that additional bridge investment may be a part of other
contract awards if a smaller bridge project is included with a highway project, and that would not be accounted for in the total
in this profile.