SlideShare a Scribd company logo
1 of 2
Download to read offline
© 2014 The American Road & Transportation Builders Association (ARTBA). All rights reserved. No part of this document may be reproduced or
transmitted in any form or by any means, electronic, mechanical, photocopying, recording, or otherwise, without prior written permission of
ARTBA.
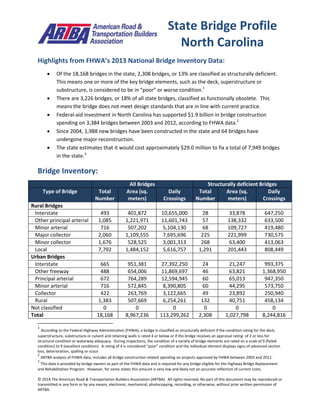
Highlights from FHWA’s 2013 National Bridge Inventory Data:
 Of the 18,168 bridges in the state, 2,308 bridges, or 13% are classified as structurally deficient.
This means one or more of the key bridge elements, such as the deck, superstructure or
substructure, is considered to be in “poor” or worse condition.1
 There are 3,226 bridges, or 18% of all state bridges, classified as functionally obsolete. This
means the bridge does not meet design standards that are in line with current practice.
 Federal-aid investment in North Carolina has supported $1.9 billion in bridge construction
spending on 3,384 bridges between 2003 and 2012, according to FHWA data.2
 Since 2004, 1,988 new bridges have been constructed in the state and 64 bridges have
undergone major reconstruction.
 The state estimates that it would cost approximately $29.0 million to fix a total of 7,949 bridges
in the state.3
Bridge Inventory:
All Bridges Structurally deficient Bridges
Type of Bridge Total
Number
Area (sq.
meters)
Daily
Crossings
Total
Number
Area (sq.
meters)
Daily
Crossings
Rural Bridges
Interstate 493 401,872 10,655,000 28 33,878 647,250
Other principal arterial 1,085 1,221,971 11,601,743 57 138,332 633,500
Minor arterial 716 507,202 5,104,130 68 109,727 419,480
Major collector 2,060 1,109,555 7,695,696 225 221,999 730,575
Minor collector 1,676 528,525 3,001,313 268 63,400 413,063
Local 7,792 1,484,152 5,616,757 1,291 201,443 808,449
Urban Bridges
Interstate 665 951,381 27,392,250 24 21,247 993,375
Other freeway 488 654,006 11,869,697 46 63,821 1,368,950
Principal arterial 672 764,289 12,594,945 60 65,013 947,350
Minor arterial 716 572,845 8,390,805 60 44,295 573,750
Collector 422 263,769 3,122,665 49 23,892 250,940
Local 1,383 507,669 6,254,261 132 40,751 458,134
Not classified 0 0 0 0 0 0
Total 18,168 8,967,236 113,299,262 2,308 1,027,798 8,244,816
1
According to the Federal Highway Administration (FHWA), a bridge is classified as structurally deficient if the condition rating for the deck,
superstructure, substructure or culvert and retaining walls is rated 4 or below or if the bridge receives an appraisal rating of 2 or less for
structural condition or waterway adequacy. During inspections, the condition of a variety of bridge elements are rated on a scale of 0 (failed
condition) to 9 (excellent condition). A rating of 4 is considered “poor” condition and the individual element displays signs of advanced section
loss, deterioration, spalling or scour.
2
ARTBA analysis of FHWA data, includes all bridge construction related spending on projects approved by FHWA between 2003 and 2012.
3
This data is provided by bridge owners as part of the FHWA data and is required for any bridge eligible for the Highway Bridge Replacement
and Rehabilitation Program. However, for some states this amount is very low and likely not an accurate reflection of current costs.
State Bridge Profile
North Carolina
© 2014 The American Road & Transportation Builders Association (ARTBA). All rights reserved. No part of this document may be reproduced or
transmitted in any form or by any means, electronic, mechanical, photocopying, recording, or otherwise, without prior written permission of
ARTBA.
Proposed bridge work:
Type of Work Number Cost (millions) Daily Crossings Area (sq. meters)
Bridge replacement 1,911 $6.0 5,643,097 788,604
Widening & rehabilitation 0 $0.0 0 0
Rehabilitation 5,891 $12.3 42,279,812 2,853,117
Deck rehabilitation/replacement 0 $0.0 0 0
Other work 147 $10.8 143,573 66,404
Top 10 Most Traveled Structurally Deficient Bridges in the State
County Year
Built
Daily
Crossings
Type of Bridge Location
(route/water under the bridge, traffic on the bridge and
location)
Guilford 1955 120,000 Urban Interstate SOUTH BUFFALO CREEK, I40 & I85 BUS., 0.5 MI. N. JCT. I85
BUS.
Wake 1981 113,000 Urban Interstate US70, I40, 0.4MI. W. JCT.SR1564
Forsyth 1963 81,000 Urban
freeway/expressway
US311, US52 US311, 1.0 MI. N. JCT. I40
Mecklenburg 1967 72,000 Urban Interstate BREVARD STREET, I277 & NC1, 0.7 MI.N.JCT.US74 WBL
Forsyth 1955 72,000 Urban
freeway/expressway
SR4315(LIBERTY ST), I40 BUS, 0.7 MI. W. JCT. US52
Forsyth 1964 72,000 Urban
freeway/expressway
28TH STREET, US52, 0.2 MI. S. JCT. SR2456
Forsyth 1964 72,000 Urban
freeway/expressway
25TH STREET, US52, 0.3 MI. S. JCT. SR2456
Forsyth 1960 71,000 Urban
freeway/expressway
LITTLE CREEK, US421, 0.1 MI.W.JCT.I40
Guilford 1954 59,000 Urban Interstate US29 US70 US220 NBL, I40 I85 WBL, 0.3 MI. N. JCT. SR1401
Forsyth 1971 59,000 Urban
freeway/expressway
DIGGS BOULEVARD, US52 US311&NC8, 0.8 MI. S. JCT. I40
Sources: All data is from the 2013 National Bridge Inventory, released by the Federal Highway Administration in March 2014.
Note that specific conditions on bridge may have changed as a result of recent work. Cost estimates of bridge work provided as
part of the data and have been adjusted to 2013$ for inflation and estimated project costs. Contract awards data is for state
and local government awards and comes from McGraw Hill. Note that additional bridge investment may be a part of other
contract awards if a smaller bridge project is included with a highway project, and that would not be accounted for in the total
in this profile.
More Related Content

What's hot

State Bridge Profiles Arizona 2014
State Bridge Profiles Arizona 2014 State Bridge Profiles Arizona 2014
State Bridge Profiles Arizona 2014 artba
 
State Bridge Profiles Alabama 2014
State Bridge Profiles Alabama 2014State Bridge Profiles Alabama 2014
State Bridge Profiles Alabama 2014artba
 
Hawaii State Bridge Profile
Hawaii State Bridge ProfileHawaii State Bridge Profile
Hawaii State Bridge Profileartba
 
State Bridge Profile Arkansas 2014
State Bridge Profile Arkansas 2014State Bridge Profile Arkansas 2014
State Bridge Profile Arkansas 2014artba
 
Indiana State Bridge Profile
Indiana State Bridge ProfileIndiana State Bridge Profile
Indiana State Bridge Profileartba
 
State Bridge Profile Kansas 2014
State Bridge Profile Kansas 2014State Bridge Profile Kansas 2014
State Bridge Profile Kansas 2014artba
 
State Bridge Profile Iowa 2014
State Bridge Profile Iowa 2014State Bridge Profile Iowa 2014
State Bridge Profile Iowa 2014artba
 
State Bridge Profile Ohio 2014
State Bridge Profile Ohio 2014State Bridge Profile Ohio 2014
State Bridge Profile Ohio 2014artba
 
State Bridge Profile Nebraska 2014
State Bridge Profile Nebraska 2014State Bridge Profile Nebraska 2014
State Bridge Profile Nebraska 2014artba
 
South Dakota State Bridge Profile
South Dakota State Bridge ProfileSouth Dakota State Bridge Profile
South Dakota State Bridge Profileartba
 
State Bridge Profile Kentucky 2014
State Bridge Profile Kentucky 2014State Bridge Profile Kentucky 2014
State Bridge Profile Kentucky 2014artba
 
Utah State Bridge Profile
Utah State Bridge ProfileUtah State Bridge Profile
Utah State Bridge Profileartba
 
State Bridge Profile Texas 2014
State Bridge Profile Texas 2014State Bridge Profile Texas 2014
State Bridge Profile Texas 2014artba
 
State Bridge Profile South Dakota 2014
State Bridge Profile South Dakota 2014State Bridge Profile South Dakota 2014
State Bridge Profile South Dakota 2014artba
 
State Bridge Profile Montana 2014
State Bridge Profile Montana 2014State Bridge Profile Montana 2014
State Bridge Profile Montana 2014artba
 
State Bridge Profile West Virginia 2014
State Bridge Profile West Virginia 2014State Bridge Profile West Virginia 2014
State Bridge Profile West Virginia 2014artba
 
State Bridge Profile Michigan 2014
State Bridge Profile Michigan 2014State Bridge Profile Michigan 2014
State Bridge Profile Michigan 2014artba
 
State Bridge Profile New Mexico 2014
State Bridge Profile New Mexico 2014State Bridge Profile New Mexico 2014
State Bridge Profile New Mexico 2014artba
 
West Virginia State Bridge Profile
West Virginia State Bridge ProfileWest Virginia State Bridge Profile
West Virginia State Bridge Profileartba
 
Montana State Bridge Profile
Montana State Bridge ProfileMontana State Bridge Profile
Montana State Bridge Profileartba
 

What's hot (20)

State Bridge Profiles Arizona 2014
State Bridge Profiles Arizona 2014 State Bridge Profiles Arizona 2014
State Bridge Profiles Arizona 2014
 
State Bridge Profiles Alabama 2014
State Bridge Profiles Alabama 2014State Bridge Profiles Alabama 2014
State Bridge Profiles Alabama 2014
 
Hawaii State Bridge Profile
Hawaii State Bridge ProfileHawaii State Bridge Profile
Hawaii State Bridge Profile
 
State Bridge Profile Arkansas 2014
State Bridge Profile Arkansas 2014State Bridge Profile Arkansas 2014
State Bridge Profile Arkansas 2014
 
Indiana State Bridge Profile
Indiana State Bridge ProfileIndiana State Bridge Profile
Indiana State Bridge Profile
 
State Bridge Profile Kansas 2014
State Bridge Profile Kansas 2014State Bridge Profile Kansas 2014
State Bridge Profile Kansas 2014
 
State Bridge Profile Iowa 2014
State Bridge Profile Iowa 2014State Bridge Profile Iowa 2014
State Bridge Profile Iowa 2014
 
State Bridge Profile Ohio 2014
State Bridge Profile Ohio 2014State Bridge Profile Ohio 2014
State Bridge Profile Ohio 2014
 
State Bridge Profile Nebraska 2014
State Bridge Profile Nebraska 2014State Bridge Profile Nebraska 2014
State Bridge Profile Nebraska 2014
 
South Dakota State Bridge Profile
South Dakota State Bridge ProfileSouth Dakota State Bridge Profile
South Dakota State Bridge Profile
 
State Bridge Profile Kentucky 2014
State Bridge Profile Kentucky 2014State Bridge Profile Kentucky 2014
State Bridge Profile Kentucky 2014
 
Utah State Bridge Profile
Utah State Bridge ProfileUtah State Bridge Profile
Utah State Bridge Profile
 
State Bridge Profile Texas 2014
State Bridge Profile Texas 2014State Bridge Profile Texas 2014
State Bridge Profile Texas 2014
 
State Bridge Profile South Dakota 2014
State Bridge Profile South Dakota 2014State Bridge Profile South Dakota 2014
State Bridge Profile South Dakota 2014
 
State Bridge Profile Montana 2014
State Bridge Profile Montana 2014State Bridge Profile Montana 2014
State Bridge Profile Montana 2014
 
State Bridge Profile West Virginia 2014
State Bridge Profile West Virginia 2014State Bridge Profile West Virginia 2014
State Bridge Profile West Virginia 2014
 
State Bridge Profile Michigan 2014
State Bridge Profile Michigan 2014State Bridge Profile Michigan 2014
State Bridge Profile Michigan 2014
 
State Bridge Profile New Mexico 2014
State Bridge Profile New Mexico 2014State Bridge Profile New Mexico 2014
State Bridge Profile New Mexico 2014
 
West Virginia State Bridge Profile
West Virginia State Bridge ProfileWest Virginia State Bridge Profile
West Virginia State Bridge Profile
 
Montana State Bridge Profile
Montana State Bridge ProfileMontana State Bridge Profile
Montana State Bridge Profile
 

Viewers also liked

Letter of Reference DOC (2)
Letter of Reference DOC (2)Letter of Reference DOC (2)
Letter of Reference DOC (2)Claudia Carmona
 
Imprenta norma
Imprenta normaImprenta norma
Imprenta normaFreggy
 
Berria open document aurkezpena
Berria   open document aurkezpenaBerria   open document aurkezpena
Berria open document aurkezpenajagoba1
 
Colorado State Bridge Profile
Colorado State Bridge ProfileColorado State Bridge Profile
Colorado State Bridge Profileartba
 
North Dakota State Bridge Profile
North Dakota State Bridge ProfileNorth Dakota State Bridge Profile
North Dakota State Bridge Profileartba
 
Treino de competencias sociais
Treino de competencias sociaisTreino de competencias sociais
Treino de competencias sociaisSílvia Costa
 
Manucript okada
Manucript okadaManucript okada
Manucript okadarjmchicago
 
Наступление польских войск в Беларуси в 1919 г.
Наступление польских войск в Беларуси в 1919 г.Наступление польских войск в Беларуси в 1919 г.
Наступление польских войск в Беларуси в 1919 г.Пётр Ситник
 
DIE MARKTMEINUNG AUS STUTTGART: Katerstimmung nach der Wahlparty?
DIE MARKTMEINUNG AUS STUTTGART: Katerstimmung nach der Wahlparty?DIE MARKTMEINUNG AUS STUTTGART: Katerstimmung nach der Wahlparty?
DIE MARKTMEINUNG AUS STUTTGART: Katerstimmung nach der Wahlparty?Ellwanger & Geiger Privatbankiers
 
Tennessee State Bridge Profile
Tennessee State Bridge ProfileTennessee State Bridge Profile
Tennessee State Bridge Profileartba
 
Iowa State Bridge Profile
Iowa State Bridge ProfileIowa State Bridge Profile
Iowa State Bridge Profileartba
 

Viewers also liked (15)

Letter of Reference DOC (2)
Letter of Reference DOC (2)Letter of Reference DOC (2)
Letter of Reference DOC (2)
 
Imprenta norma
Imprenta normaImprenta norma
Imprenta norma
 
Berria open document aurkezpena
Berria   open document aurkezpenaBerria   open document aurkezpena
Berria open document aurkezpena
 
Pacto por el Bien Común
Pacto por el Bien ComúnPacto por el Bien Común
Pacto por el Bien Común
 
Colorado State Bridge Profile
Colorado State Bridge ProfileColorado State Bridge Profile
Colorado State Bridge Profile
 
North Dakota State Bridge Profile
North Dakota State Bridge ProfileNorth Dakota State Bridge Profile
North Dakota State Bridge Profile
 
Treino de competencias sociais
Treino de competencias sociaisTreino de competencias sociais
Treino de competencias sociais
 
NFIL exp certificate
NFIL exp certificateNFIL exp certificate
NFIL exp certificate
 
Manucript okada
Manucript okadaManucript okada
Manucript okada
 
Наступление польских войск в Беларуси в 1919 г.
Наступление польских войск в Беларуси в 1919 г.Наступление польских войск в Беларуси в 1919 г.
Наступление польских войск в Беларуси в 1919 г.
 
802719 cs hats_offtomother
802719 cs hats_offtomother802719 cs hats_offtomother
802719 cs hats_offtomother
 
DIE MARKTMEINUNG AUS STUTTGART: Katerstimmung nach der Wahlparty?
DIE MARKTMEINUNG AUS STUTTGART: Katerstimmung nach der Wahlparty?DIE MARKTMEINUNG AUS STUTTGART: Katerstimmung nach der Wahlparty?
DIE MARKTMEINUNG AUS STUTTGART: Katerstimmung nach der Wahlparty?
 
Tennessee State Bridge Profile
Tennessee State Bridge ProfileTennessee State Bridge Profile
Tennessee State Bridge Profile
 
Iowa State Bridge Profile
Iowa State Bridge ProfileIowa State Bridge Profile
Iowa State Bridge Profile
 
Más allá hay dragones
Más allá hay dragonesMás allá hay dragones
Más allá hay dragones
 

Similar to North Carolina State Bridge Profile

State Bridge Profile Vermont 2014
State Bridge Profile Vermont 2014State Bridge Profile Vermont 2014
State Bridge Profile Vermont 2014artba
 
State Bridge Profiles Alaska 2014
State Bridge Profiles Alaska 2014 State Bridge Profiles Alaska 2014
State Bridge Profiles Alaska 2014 artba
 
DC State Bridge Profile
DC State Bridge ProfileDC State Bridge Profile
DC State Bridge Profileartba
 
Idaho State Bridge Profile
Idaho State Bridge ProfileIdaho State Bridge Profile
Idaho State Bridge Profileartba
 
Rhode Island State Bridge Profile
Rhode Island State Bridge ProfileRhode Island State Bridge Profile
Rhode Island State Bridge Profileartba
 
Maine State Bridge Profile
Maine State Bridge ProfileMaine State Bridge Profile
Maine State Bridge Profileartba
 
Vermont State Bridge Profile
Vermont State Bridge ProfileVermont State Bridge Profile
Vermont State Bridge Profileartba
 
Arkansas State Bridge Profile
Arkansas State Bridge ProfileArkansas State Bridge Profile
Arkansas State Bridge Profileartba
 
State Bridge Profile Nevada 2014
State Bridge Profile Nevada 2014State Bridge Profile Nevada 2014
State Bridge Profile Nevada 2014artba
 
Oregon State Bridge Profile
Oregon State Bridge ProfileOregon State Bridge Profile
Oregon State Bridge Profileartba
 
Alaska State Bridge Profile
Alaska State Bridge ProfileAlaska State Bridge Profile
Alaska State Bridge Profileartba
 
State Bridge Profile New Hampshire 2014
State Bridge Profile New Hampshire 2014State Bridge Profile New Hampshire 2014
State Bridge Profile New Hampshire 2014artba
 
New Hampshire State Bridge Profile
New Hampshire State Bridge ProfileNew Hampshire State Bridge Profile
New Hampshire State Bridge Profileartba
 
State Bridge Profile Illinois 2014
State Bridge Profile Illinois 2014State Bridge Profile Illinois 2014
State Bridge Profile Illinois 2014artba
 
Michigan State Bridge Profile
Michigan State Bridge Profile Michigan State Bridge Profile
Michigan State Bridge Profile artba
 
State Bridge Profile Florida 2014
State Bridge Profile Florida 2014State Bridge Profile Florida 2014
State Bridge Profile Florida 2014artba
 
Florida State Bridge Profile
Florida State Bridge ProfileFlorida State Bridge Profile
Florida State Bridge Profileartba
 

Similar to North Carolina State Bridge Profile (17)

State Bridge Profile Vermont 2014
State Bridge Profile Vermont 2014State Bridge Profile Vermont 2014
State Bridge Profile Vermont 2014
 
State Bridge Profiles Alaska 2014
State Bridge Profiles Alaska 2014 State Bridge Profiles Alaska 2014
State Bridge Profiles Alaska 2014
 
DC State Bridge Profile
DC State Bridge ProfileDC State Bridge Profile
DC State Bridge Profile
 
Idaho State Bridge Profile
Idaho State Bridge ProfileIdaho State Bridge Profile
Idaho State Bridge Profile
 
Rhode Island State Bridge Profile
Rhode Island State Bridge ProfileRhode Island State Bridge Profile
Rhode Island State Bridge Profile
 
Maine State Bridge Profile
Maine State Bridge ProfileMaine State Bridge Profile
Maine State Bridge Profile
 
Vermont State Bridge Profile
Vermont State Bridge ProfileVermont State Bridge Profile
Vermont State Bridge Profile
 
Arkansas State Bridge Profile
Arkansas State Bridge ProfileArkansas State Bridge Profile
Arkansas State Bridge Profile
 
State Bridge Profile Nevada 2014
State Bridge Profile Nevada 2014State Bridge Profile Nevada 2014
State Bridge Profile Nevada 2014
 
Oregon State Bridge Profile
Oregon State Bridge ProfileOregon State Bridge Profile
Oregon State Bridge Profile
 
Alaska State Bridge Profile
Alaska State Bridge ProfileAlaska State Bridge Profile
Alaska State Bridge Profile
 
State Bridge Profile New Hampshire 2014
State Bridge Profile New Hampshire 2014State Bridge Profile New Hampshire 2014
State Bridge Profile New Hampshire 2014
 
New Hampshire State Bridge Profile
New Hampshire State Bridge ProfileNew Hampshire State Bridge Profile
New Hampshire State Bridge Profile
 
State Bridge Profile Illinois 2014
State Bridge Profile Illinois 2014State Bridge Profile Illinois 2014
State Bridge Profile Illinois 2014
 
Michigan State Bridge Profile
Michigan State Bridge Profile Michigan State Bridge Profile
Michigan State Bridge Profile
 
State Bridge Profile Florida 2014
State Bridge Profile Florida 2014State Bridge Profile Florida 2014
State Bridge Profile Florida 2014
 
Florida State Bridge Profile
Florida State Bridge ProfileFlorida State Bridge Profile
Florida State Bridge Profile
 

More from artba

2017 media kit
2017 media kit2017 media kit
2017 media kitartba
 
September October tb_2016
September October tb_2016September October tb_2016
September October tb_2016artba
 
Transportation Builder July/August 2016
Transportation Builder July/August 2016Transportation Builder July/August 2016
Transportation Builder July/August 2016artba
 
The National Work Zone Management Conference Agenda 2016
The National Work Zone Management Conference Agenda 2016The National Work Zone Management Conference Agenda 2016
The National Work Zone Management Conference Agenda 2016artba
 
ARTBA 2016 National Convention Program
ARTBA 2016 National Convention ProgramARTBA 2016 National Convention Program
ARTBA 2016 National Convention Programartba
 
May/June Transportation Builder
May/June Transportation BuilderMay/June Transportation Builder
May/June Transportation Builderartba
 
Northeastern regional meeting
Northeastern regional meetingNortheastern regional meeting
Northeastern regional meetingartba
 
Southern regional meeting
Southern regional meetingSouthern regional meeting
Southern regional meetingartba
 
Central regional meeting
Central regional meetingCentral regional meeting
Central regional meetingartba
 
Western regional meeting
Western regional meetingWestern regional meeting
Western regional meetingartba
 
Western regional meeting
Western regional meetingWestern regional meeting
Western regional meetingartba
 
July/August 2015 TB magazine
July/August 2015 TB magazineJuly/August 2015 TB magazine
July/August 2015 TB magazineartba
 
September/October 2015 TB magazine
September/October 2015 TB magazineSeptember/October 2015 TB magazine
September/October 2015 TB magazineartba
 
November/December 2015 TB
November/December 2015 TBNovember/December 2015 TB
November/December 2015 TBartba
 
January/February 2016 TB
January/February 2016 TBJanuary/February 2016 TB
January/February 2016 TBartba
 
March/April 2016 TB
March/April 2016 TBMarch/April 2016 TB
March/April 2016 TBartba
 
2016 ­ARTBA FIP Schedule
2016 ­ARTBA FIP Schedule2016 ­ARTBA FIP Schedule
2016 ­ARTBA FIP Scheduleartba
 
2016 ARTBA FIP Program
2016 ARTBA FIP Program2016 ARTBA FIP Program
2016 ARTBA FIP Programartba
 
2016 ILDP Agenda
2016 ILDP Agenda2016 ILDP Agenda
2016 ILDP Agendaartba
 
P3 Agenda 2016
P3 Agenda 2016P3 Agenda 2016
P3 Agenda 2016artba
 

More from artba (20)

2017 media kit
2017 media kit2017 media kit
2017 media kit
 
September October tb_2016
September October tb_2016September October tb_2016
September October tb_2016
 
Transportation Builder July/August 2016
Transportation Builder July/August 2016Transportation Builder July/August 2016
Transportation Builder July/August 2016
 
The National Work Zone Management Conference Agenda 2016
The National Work Zone Management Conference Agenda 2016The National Work Zone Management Conference Agenda 2016
The National Work Zone Management Conference Agenda 2016
 
ARTBA 2016 National Convention Program
ARTBA 2016 National Convention ProgramARTBA 2016 National Convention Program
ARTBA 2016 National Convention Program
 
May/June Transportation Builder
May/June Transportation BuilderMay/June Transportation Builder
May/June Transportation Builder
 
Northeastern regional meeting
Northeastern regional meetingNortheastern regional meeting
Northeastern regional meeting
 
Southern regional meeting
Southern regional meetingSouthern regional meeting
Southern regional meeting
 
Central regional meeting
Central regional meetingCentral regional meeting
Central regional meeting
 
Western regional meeting
Western regional meetingWestern regional meeting
Western regional meeting
 
Western regional meeting
Western regional meetingWestern regional meeting
Western regional meeting
 
July/August 2015 TB magazine
July/August 2015 TB magazineJuly/August 2015 TB magazine
July/August 2015 TB magazine
 
September/October 2015 TB magazine
September/October 2015 TB magazineSeptember/October 2015 TB magazine
September/October 2015 TB magazine
 
November/December 2015 TB
November/December 2015 TBNovember/December 2015 TB
November/December 2015 TB
 
January/February 2016 TB
January/February 2016 TBJanuary/February 2016 TB
January/February 2016 TB
 
March/April 2016 TB
March/April 2016 TBMarch/April 2016 TB
March/April 2016 TB
 
2016 ­ARTBA FIP Schedule
2016 ­ARTBA FIP Schedule2016 ­ARTBA FIP Schedule
2016 ­ARTBA FIP Schedule
 
2016 ARTBA FIP Program
2016 ARTBA FIP Program2016 ARTBA FIP Program
2016 ARTBA FIP Program
 
2016 ILDP Agenda
2016 ILDP Agenda2016 ILDP Agenda
2016 ILDP Agenda
 
P3 Agenda 2016
P3 Agenda 2016P3 Agenda 2016
P3 Agenda 2016
 

North Carolina State Bridge Profile

  • 1. © 2014 The American Road & Transportation Builders Association (ARTBA). All rights reserved. No part of this document may be reproduced or transmitted in any form or by any means, electronic, mechanical, photocopying, recording, or otherwise, without prior written permission of ARTBA. Highlights from FHWA’s 2013 National Bridge Inventory Data:  Of the 18,168 bridges in the state, 2,308 bridges, or 13% are classified as structurally deficient. This means one or more of the key bridge elements, such as the deck, superstructure or substructure, is considered to be in “poor” or worse condition.1  There are 3,226 bridges, or 18% of all state bridges, classified as functionally obsolete. This means the bridge does not meet design standards that are in line with current practice.  Federal-aid investment in North Carolina has supported $1.9 billion in bridge construction spending on 3,384 bridges between 2003 and 2012, according to FHWA data.2  Since 2004, 1,988 new bridges have been constructed in the state and 64 bridges have undergone major reconstruction.  The state estimates that it would cost approximately $29.0 million to fix a total of 7,949 bridges in the state.3 Bridge Inventory: All Bridges Structurally deficient Bridges Type of Bridge Total Number Area (sq. meters) Daily Crossings Total Number Area (sq. meters) Daily Crossings Rural Bridges Interstate 493 401,872 10,655,000 28 33,878 647,250 Other principal arterial 1,085 1,221,971 11,601,743 57 138,332 633,500 Minor arterial 716 507,202 5,104,130 68 109,727 419,480 Major collector 2,060 1,109,555 7,695,696 225 221,999 730,575 Minor collector 1,676 528,525 3,001,313 268 63,400 413,063 Local 7,792 1,484,152 5,616,757 1,291 201,443 808,449 Urban Bridges Interstate 665 951,381 27,392,250 24 21,247 993,375 Other freeway 488 654,006 11,869,697 46 63,821 1,368,950 Principal arterial 672 764,289 12,594,945 60 65,013 947,350 Minor arterial 716 572,845 8,390,805 60 44,295 573,750 Collector 422 263,769 3,122,665 49 23,892 250,940 Local 1,383 507,669 6,254,261 132 40,751 458,134 Not classified 0 0 0 0 0 0 Total 18,168 8,967,236 113,299,262 2,308 1,027,798 8,244,816 1 According to the Federal Highway Administration (FHWA), a bridge is classified as structurally deficient if the condition rating for the deck, superstructure, substructure or culvert and retaining walls is rated 4 or below or if the bridge receives an appraisal rating of 2 or less for structural condition or waterway adequacy. During inspections, the condition of a variety of bridge elements are rated on a scale of 0 (failed condition) to 9 (excellent condition). A rating of 4 is considered “poor” condition and the individual element displays signs of advanced section loss, deterioration, spalling or scour. 2 ARTBA analysis of FHWA data, includes all bridge construction related spending on projects approved by FHWA between 2003 and 2012. 3 This data is provided by bridge owners as part of the FHWA data and is required for any bridge eligible for the Highway Bridge Replacement and Rehabilitation Program. However, for some states this amount is very low and likely not an accurate reflection of current costs. State Bridge Profile North Carolina
  • 2. © 2014 The American Road & Transportation Builders Association (ARTBA). All rights reserved. No part of this document may be reproduced or transmitted in any form or by any means, electronic, mechanical, photocopying, recording, or otherwise, without prior written permission of ARTBA. Proposed bridge work: Type of Work Number Cost (millions) Daily Crossings Area (sq. meters) Bridge replacement 1,911 $6.0 5,643,097 788,604 Widening & rehabilitation 0 $0.0 0 0 Rehabilitation 5,891 $12.3 42,279,812 2,853,117 Deck rehabilitation/replacement 0 $0.0 0 0 Other work 147 $10.8 143,573 66,404 Top 10 Most Traveled Structurally Deficient Bridges in the State County Year Built Daily Crossings Type of Bridge Location (route/water under the bridge, traffic on the bridge and location) Guilford 1955 120,000 Urban Interstate SOUTH BUFFALO CREEK, I40 & I85 BUS., 0.5 MI. N. JCT. I85 BUS. Wake 1981 113,000 Urban Interstate US70, I40, 0.4MI. W. JCT.SR1564 Forsyth 1963 81,000 Urban freeway/expressway US311, US52 US311, 1.0 MI. N. JCT. I40 Mecklenburg 1967 72,000 Urban Interstate BREVARD STREET, I277 & NC1, 0.7 MI.N.JCT.US74 WBL Forsyth 1955 72,000 Urban freeway/expressway SR4315(LIBERTY ST), I40 BUS, 0.7 MI. W. JCT. US52 Forsyth 1964 72,000 Urban freeway/expressway 28TH STREET, US52, 0.2 MI. S. JCT. SR2456 Forsyth 1964 72,000 Urban freeway/expressway 25TH STREET, US52, 0.3 MI. S. JCT. SR2456 Forsyth 1960 71,000 Urban freeway/expressway LITTLE CREEK, US421, 0.1 MI.W.JCT.I40 Guilford 1954 59,000 Urban Interstate US29 US70 US220 NBL, I40 I85 WBL, 0.3 MI. N. JCT. SR1401 Forsyth 1971 59,000 Urban freeway/expressway DIGGS BOULEVARD, US52 US311&NC8, 0.8 MI. S. JCT. I40 Sources: All data is from the 2013 National Bridge Inventory, released by the Federal Highway Administration in March 2014. Note that specific conditions on bridge may have changed as a result of recent work. Cost estimates of bridge work provided as part of the data and have been adjusted to 2013$ for inflation and estimated project costs. Contract awards data is for state and local government awards and comes from McGraw Hill. Note that additional bridge investment may be a part of other contract awards if a smaller bridge project is included with a highway project, and that would not be accounted for in the total in this profile.