More Related Content
Similar to Alabama State Bridge Profile
Similar to Alabama State Bridge Profile (11)
Alabama State Bridge Profile
- 1. © 2014 The American Road & Transportation Builders Association (ARTBA). All rights reserved. No part of this document may be reproduced or
transmitted in any form or by any means, electronic, mechanical, photocopying, recording, or otherwise, without prior written permission of
ARTBA.
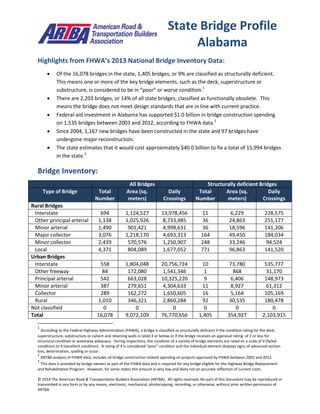
Highlights from FHWA’s 2013 National Bridge Inventory Data:
Of the 16,078 bridges in the state, 1,405 bridges, or 9% are classified as structurally deficient.
This means one or more of the key bridge elements, such as the deck, superstructure or
substructure, is considered to be in “poor” or worse condition.1
There are 2,203 bridges, or 14% of all state bridges, classified as functionally obsolete. This
means the bridge does not meet design standards that are in line with current practice.
Federal-aid investment in Alabama has supported $1.0 billion in bridge construction spending
on 1,535 bridges between 2003 and 2012, according to FHWA data.2
Since 2004, 1,167 new bridges have been constructed in the state and 97 bridges have
undergone major reconstruction.
The state estimates that it would cost approximately $40.0 billion to fix a total of 15,994 bridges
in the state.3
Bridge Inventory:
All Bridges Structurally deficient Bridges
Type of Bridge Total
Number
Area (sq.
meters)
Daily
Crossings
Total
Number
Area (sq.
meters)
Daily
Crossings
Rural Bridges
Interstate 694 1,124,527 13,978,456 11 6,229 228,575
Other principal arterial 1,138 1,025,926 8,733,485 36 24,863 251,177
Minor arterial 1,490 901,421 4,998,631 36 18,596 141,206
Major collector 3,076 1,218,170 4,693,313 164 49,450 184,034
Minor collector 2,439 570,576 1,250,907 248 33,246 94,524
Local 4,371 804,089 1,677,052 771 96,863 141,520
Urban Bridges
Interstate 558 1,804,048 20,756,724 10 73,780 535,777
Other freeway 84 172,080 1,541,346 1 868 31,170
Principal arterial 542 663,028 10,325,220 9 6,406 148,973
Minor arterial 387 279,651 4,304,633 11 8,927 61,312
Collector 289 162,272 1,650,605 16 5,164 105,169
Local 1,010 346,321 2,860,284 92 30,535 180,478
Not classified 0 0 0 0 0 0
Total 16,078 9,072,109 76,770,656 1,405 354,927 2,103,915
1
According to the Federal Highway Administration (FHWA), a bridge is classified as structurally deficient if the condition rating for the deck,
superstructure, substructure or culvert and retaining walls is rated 4 or below or if the bridge receives an appraisal rating of 2 or less for
structural condition or waterway adequacy. During inspections, the condition of a variety of bridge elements are rated on a scale of 0 (failed
condition) to 9 (excellent condition). A rating of 4 is considered “poor” condition and the individual element displays signs of advanced section
loss, deterioration, spalling or scour.
2
ARTBA analysis of FHWA data, includes all bridge construction related spending on projects approved by FHWA between 2003 and 2012.
3
This data is provided by bridge owners as part of the FHWA data and is required for any bridge eligible for the Highway Bridge Replacement
and Rehabilitation Program. However, for some states this amount is very low and likely not an accurate reflection of current costs.
State Bridge Profile
Alabama
- 2. © 2014 The American Road & Transportation Builders Association (ARTBA). All rights reserved. No part of this document may be reproduced or
transmitted in any form or by any means, electronic, mechanical, photocopying, recording, or otherwise, without prior written permission of
ARTBA.
Proposed bridge work:
Type of Work Number Cost (millions) Daily Crossings Area (sq. meters)
Bridge replacement 4,900 $8,413.9 14,528,695 1,626,938
Widening & rehabilitation 574 $1,440.6 4,069,577 289,571
Rehabilitation 3,015 $11,662.3 26,720,940 3,082,326
Deck rehabilitation/replacement 9 $14.3 85,751 4,023
Other work 7,496 $18,502.3 31,335,680 4,050,011
Top 10 Most Traveled Structurally Deficient Bridges in the State
County Year
Built
Daily
Crossings
Type of Bridge Location
(route/water under the bridge, traffic on the bridge and location)
Jefferson 1970 136,370 Urban Interstate U.S.11 RR&CITY STREETS, I65, I65 2ND AVE.TO 2ND AVE.NO
Mobile 1964 85,510 Urban Interstate HALLS MILL CREEK, I-10 WB & EB, 2.2 MI E US 90
Jefferson 1972 78,675 Urban Interstate US 31 RRS&CITY STREETS, I-59/20, BHAM CIVIC CENTER
Mobile 1966 75,350 Urban Interstate SOUTHERN DRAIN CANAL, I-10 WB & EB, 3.3 MI E JCT SR 163
Baldwin 1969 52,690 Rural Interstate D OLIVE STREAM, I-10, 1.5 MI E JCT US 90 & I-10
Mobile 1964 43,710 Rural Interstate WARREN CREEK, I-10, 3.2 MI E MISS ST LINE
Jefferson 1968 41,015 Urban Interstate ARRON ARONOV DRIVE, I 59/20, I 59 & ARRON ARONOV DR.
Jefferson 1936 39,710 Urban other
principal arterial
VILLAGE CK & FRISCO RR, US 78, US 78 & VILLAGE CREEK
Houston 1958 34,500 Urban other
principal arterial
STREAM, SR 210 MP 2.425, 0.9 MI. S. US 84 W.
Mobile 1967 33,770 Urban Interstate HELLS SWAMP CREEK, I-65, 1.1 MI N CELESTE ROAD
Sources: All data is from the 2013 National Bridge Inventory, released by the Federal Highway Administration in March 2014.
Note that specific conditions on bridge may have changed as a result of recent work. Cost estimates of bridge work provided as
part of the data and have been adjusted to 2013$ for inflation and estimated project costs. Contract awards data is for state
and local government awards and comes from McGraw Hill. Note that additional bridge investment may be a part of other
contract awards if a smaller bridge project is included with a highway project, and that would not be accounted for in the total
in this profile.