More Related Content
Similar to SC Bridges: 11% Structurally Deficient
Similar to SC Bridges: 11% Structurally Deficient (19)
SC Bridges: 11% Structurally Deficient
- 1. © 2014 The American Road & Transportation Builders Association (ARTBA). All rights reserved. No part of this document may be reproduced or
transmitted in any form or by any means, electronic, mechanical, photocopying, recording, or otherwise, without prior written permission of
ARTBA.
Highlights from FHWA’s 2013 National Bridge Inventory Data:
Of the 9,275 bridges in the state, 1,048 bridges, or 11% are classified as structurally deficient.
This means one or more of the key bridge elements, such as the deck, superstructure or
substructure, is considered to be in “poor” or worse condition.1
There are 872 bridges, or 9% of all state bridges, classified as functionally obsolete. This means
the bridge does not meet design standards that are in line with current practice.
Federal-aid investment in South Carolina has supported $968.2 million in bridge construction
spending on 1,079 bridges between 2003 and 2012, according to FHWA data.2
Since 2004, 696 new bridges have been constructed in the state and 79 bridges have undergone
major reconstruction.
The state estimates that it would cost approximately $999.2 million to fix a total of 1,674
bridges in the state.3
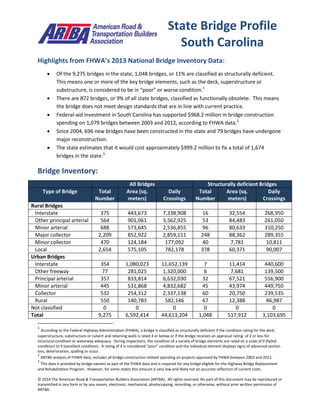
Bridge Inventory:
All Bridges Structurally deficient Bridges
Type of Bridge Total
Number
Area (sq.
meters)
Daily
Crossings
Total
Number
Area (sq.
meters)
Daily
Crossings
Rural Bridges
Interstate 375 443,673 7,338,908 16 32,554 268,950
Other principal arterial 564 901,061 3,562,925 53 84,483 261,050
Minor arterial 688 573,645 2,536,855 96 80,633 310,250
Major collector 2,209 852,922 2,859,111 248 88,362 289,355
Minor collector 470 124,184 177,092 40 7,781 10,811
Local 2,654 575,105 782,178 378 60,371 90,007
Urban Bridges
Interstate 354 1,080,023 11,652,139 7 11,414 440,600
Other freeway 77 281,025 1,320,000 6 7,681 139,500
Principal arterial 357 833,814 6,632,030 32 67,521 556,900
Minor arterial 445 531,868 4,832,682 45 43,974 449,750
Collector 532 254,312 2,337,138 60 20,750 239,535
Local 550 140,783 582,146 67 12,388 46,987
Not classified 0 0 0 0 0 0
Total 9,275 6,592,414 44,613,204 1,048 517,912 3,103,695
1
According to the Federal Highway Administration (FHWA), a bridge is classified as structurally deficient if the condition rating for the deck,
superstructure, substructure or culvert and retaining walls is rated 4 or below or if the bridge receives an appraisal rating of 2 or less for
structural condition or waterway adequacy. During inspections, the condition of a variety of bridge elements are rated on a scale of 0 (failed
condition) to 9 (excellent condition). A rating of 4 is considered “poor” condition and the individual element displays signs of advanced section
loss, deterioration, spalling or scour.
2
ARTBA analysis of FHWA data, includes all bridge construction related spending on projects approved by FHWA between 2003 and 2012.
3
This data is provided by bridge owners as part of the FHWA data and is required for any bridge eligible for the Highway Bridge Replacement
and Rehabilitation Program. However, for some states this amount is very low and likely not an accurate reflection of current costs.
State Bridge Profile
South Carolina
- 2. © 2014 The American Road & Transportation Builders Association (ARTBA). All rights reserved. No part of this document may be reproduced or
transmitted in any form or by any means, electronic, mechanical, photocopying, recording, or otherwise, without prior written permission of
ARTBA.
Proposed bridge work:
Type of Work Number Cost (millions) Daily Crossings Area (sq. meters)
Bridge replacement 857 $670.6 1,811,130 344,110
Widening & rehabilitation 584 $257.8 4,056,200 469,559
Rehabilitation 225 $70.7 1,305,533 174,289
Deck rehabilitation/replacement 0 $0.0 0 0
Other work 8 $0.1 18,310 2,854
Top 10 Most Traveled Structurally Deficient Bridges in the State
County Year
Built
Daily
Crossings
Type of Bridge Location
(route/water under the bridge, traffic on the bridge and location)
Greenville 1960 92,700 Urban Interstate TRIB LAUREL CRK, I-85, 4.9 MI E OF GREENVILLE
Lexington 1958 81,200 Urban Interstate SOUTHERN RWY (NO. 1), I-26, 3MI W OF W COLA
Richland 1958 78,200 Urban Interstate C.N. AND L. RAILROAD, I-26, 3MI NW OF COLA
Lexington 1959 77,100 Urban Interstate SC 302, I-26, 2MI SW OF W COLA
Lexington 1959 75,800 Urban Interstate US 1, I-26, 1.0 MI W W COLA
Richland 1977 41,200 Urban
freeway/expressway
I-77, SC 277, 7 MI N OF COLA
Spartanburg 1953 32,600 Urban
freeway/expressway
S-2, SC 85, 3.2 MI NW SPARTANBURG
Spartanburg 1953 32,600 Urban
freeway/expressway
SOUTHERN RR & S-42-995, SC 85, 3.2 MI NW SPARTANBURG
Greenville 1939 31,400 Urban other
principal arterial
ENOREE RIVER, US 29, 4.5 MI SW OF GREER
Greenville 1939 31,400 Urban other
principal arterial
MOUNTAIN CREEK, US 29, 4.5 MI SW OF GREER
Sources: All data is from the 2013 National Bridge Inventory, released by the Federal Highway Administration in March 2014.
Note that specific conditions on bridge may have changed as a result of recent work. Cost estimates of bridge work provided as
part of the data and have been adjusted to 2013$ for inflation and estimated project costs. Contract awards data is for state
and local government awards and comes from McGraw Hill. Note that additional bridge investment may be a part of other
contract awards if a smaller bridge project is included with a highway project, and that would not be accounted for in the total
in this profile.