SlideShare a Scribd company logo
1 of 2
Download to read offline
© 2014 The American Road & Transportation Builders Association (ARTBA). All rights reserved. No part of this document may be reproduced or
transmitted in any form or by any means, electronic, mechanical, photocopying, recording, or otherwise, without prior written permission of
ARTBA.
Highlights from FHWA’s 2013 National Bridge Inventory Data:
 Of the 2,402 bridges in the state, 366 bridges, or 15% are classified as structurally deficient. This
means one or more of the key bridge elements, such as the deck, superstructure or
substructure, is considered to be in “poor” or worse condition.1
 There are 425 bridges, or 18% of all state bridges, classified as functionally obsolete. This means
the bridge does not meet design standards that are in line with current practice.
 Federal-aid investment in Maine has supported $705.8 million in bridge construction spending
on 709 bridges between 2003 and 2012, according to FHWA data.2
 Since 2004, 207 new bridges have been constructed in the state and 64 bridges have undergone
major reconstruction.
 The state estimates that it would cost approximately $912.0 million to fix a total of 775 bridges
in the state.3
Bridge Inventory:
All Bridges Structurally deficient Bridges
Type of Bridge Total
Number
Area (sq.
meters)
Daily
Crossings
Total
Number
Area (sq.
meters)
Daily
Crossings
Rural Bridges
Interstate 159 119,069 1,647,197 11 10,106 169,445
Other principal arterial 139 103,510 1,042,102 16 15,748 106,840
Minor arterial 185 98,884 977,810 24 14,396 109,926
Major collector 449 158,871 962,438 57 20,633 114,883
Minor collector 260 67,056 298,576 45 10,814 63,989
Local 736 124,921 338,103 150 15,827 38,165
Urban Bridges
Interstate 126 187,957 2,576,272 3 4,848 81,945
Other freeway 19 33,529 277,542 2 4,490 24,681
Principal arterial 56 88,788 787,961 7 5,929 97,932
Minor arterial 82 136,580 980,535 9 12,107 76,268
Collector 109 64,941 630,313 19 15,296 146,426
Local 82 22,988 109,819 23 6,705 25,195
Not classified 0 0 0 0 0 0
Total 2,402 1,207,094 10,628,668 366 136,899 1,055,695
1
According to the Federal Highway Administration (FHWA), a bridge is classified as structurally deficient if the condition rating for the deck,
superstructure, substructure or culvert and retaining walls is rated 4 or below or if the bridge receives an appraisal rating of 2 or less for
structural condition or waterway adequacy. During inspections, the condition of a variety of bridge elements are rated on a scale of 0 (failed
condition) to 9 (excellent condition). A rating of 4 is considered “poor” condition and the individual element displays signs of advanced section
loss, deterioration, spalling or scour.
2
ARTBA analysis of FHWA data, includes all bridge construction related spending on projects approved by FHWA between 2003 and 2012.
3
This data is provided by bridge owners as part of the FHWA data and is required for any bridge eligible for the Highway Bridge Replacement
and Rehabilitation Program. However, for some states this amount is very low and likely not an accurate reflection of current costs.
State Bridge Profile
Maine
© 2014 The American Road & Transportation Builders Association (ARTBA). All rights reserved. No part of this document may be reproduced or
transmitted in any form or by any means, electronic, mechanical, photocopying, recording, or otherwise, without prior written permission of
ARTBA.
Proposed bridge work:
Type of Work Number Cost (millions) Daily Crossings Area (sq. meters)
Bridge replacement 339 $807.4 1,001,222 135,126
Widening & rehabilitation 296 $76.5 1,079,907 106,879
Rehabilitation 140 $28.1 764,155 90,979
Deck rehabilitation/replacement 0 $0.0 0 0
Other work 0 $0.0 0 0
Top 10 Most Traveled Structurally Deficient Bridges in the State
County Year
Built
Daily
Crossings
Type of Bridge Location
(route/water under the bridge, traffic on the bridge and location)
Penobscot 1960 50,330 Urban Interstate KENDUSKEAG STR&VALLEY AV, INTERSTATE 95, 0.7 MI W JCT
RTE 15
Cumberland 1956 27,415 Rural Interstate PISCATIQUA RIVER STR#28, I-95, 0.567 mi W of SR 100&26
Cumberland 1956 27,415 Rural Interstate PISCATIQUA RIVER STR #31, I-95, 0.095 mi NE of Hurricane
Cumberland 1989 23,248 Urban other
principal arterial
STROUDWATER RIVER, ROUTES 9 & 22, 0.6 MI NE OF SW JCT
9&22
Somerset 1960 20,830 Rural Interstate ROUTE 201, I-95, 2 MI N TOWNLINE
Somerset 1964 18,750 Rural Interstate M C RR, INTERSTATE 95, 0.1 MI E OF 95 / US201
Sagadahoc 1933 17,999 Rural arterial M C RR & A MARSH, US ROUTE 1, 1.1 MI NE OF BATH T L
Sagadahoc 1958 17,980 Urban
freeway/expressway
SMO RR - CITY STREETS, US RTE # 1, 0.1 MI E OF JCT RTE 209
Cumberland 1943 17,073 Urban collector PRESUMPSCOT*RIVER, RTE 1, FALMOUTH-PORTLAND TL
Penobscot 1960 16,735 Urban other
principal arterial
INTERSTATE 95, ROUTE 222, INTERCHANGE #47
Sources: All data is from the 2013 National Bridge Inventory, released by the Federal Highway Administration in March 2014.
Note that specific conditions on bridge may have changed as a result of recent work. Cost estimates of bridge work provided as
part of the data and have been adjusted to 2013$ for inflation and estimated project costs. Contract awards data is for state
and local government awards and comes from McGraw Hill. Note that additional bridge investment may be a part of other
contract awards if a smaller bridge project is included with a highway project, and that would not be accounted for in the total
in this profile.

More Related Content

What's hot

Vermont State Bridge Profile
Vermont State Bridge ProfileVermont State Bridge Profile
Vermont State Bridge Profileartba
 
Utah State Bridge Profile
Utah State Bridge ProfileUtah State Bridge Profile
Utah State Bridge Profileartba
 
State Bridge Profiles Alabama 2014
State Bridge Profiles Alabama 2014State Bridge Profiles Alabama 2014
State Bridge Profiles Alabama 2014artba
 
Massachusetts State Bridge Profile
Massachusetts State Bridge ProfileMassachusetts State Bridge Profile
Massachusetts State Bridge Profileartba
 
Kentucky State Bridge Profile
Kentucky State Bridge ProfileKentucky State Bridge Profile
Kentucky State Bridge Profileartba
 
Arizona State Bridge Profile
Arizona State Bridge ProfileArizona State Bridge Profile
Arizona State Bridge Profileartba
 
Maryland State Bridge Profile
Maryland State Bridge ProfileMaryland State Bridge Profile
Maryland State Bridge Profileartba
 
Georgia State Bridge Profile
Georgia State Bridge ProfileGeorgia State Bridge Profile
Georgia State Bridge Profileartba
 
Wisconsin State Bridge Profile
Wisconsin State Bridge ProfileWisconsin State Bridge Profile
Wisconsin State Bridge Profileartba
 
Rhode Island State Bridge Profile
Rhode Island State Bridge ProfileRhode Island State Bridge Profile
Rhode Island State Bridge Profileartba
 
Iowa State Bridge Profile
Iowa State Bridge ProfileIowa State Bridge Profile
Iowa State Bridge Profileartba
 
State Bridge Profile North Dakota 2014
State Bridge Profile North Dakota 2014State Bridge Profile North Dakota 2014
State Bridge Profile North Dakota 2014artba
 
Kansas State Bridge Profile
Kansas State Bridge ProfileKansas State Bridge Profile
Kansas State Bridge Profileartba
 
State Bridge Profile New York 2014
State Bridge Profile New York 2014State Bridge Profile New York 2014
State Bridge Profile New York 2014artba
 
Tennessee State Bridge Profile
Tennessee State Bridge ProfileTennessee State Bridge Profile
Tennessee State Bridge Profileartba
 
New Hampshire State Bridge Profile
New Hampshire State Bridge ProfileNew Hampshire State Bridge Profile
New Hampshire State Bridge Profileartba
 
State Bridge Profile Arkansas 2014
State Bridge Profile Arkansas 2014State Bridge Profile Arkansas 2014
State Bridge Profile Arkansas 2014artba
 
Ohio State Bridge Profile
Ohio State Bridge ProfileOhio State Bridge Profile
Ohio State Bridge Profileartba
 
Texas State Bridge Profile
Texas State Bridge ProfileTexas State Bridge Profile
Texas State Bridge Profileartba
 
State Bridge Profile California 2014
State Bridge Profile California 2014State Bridge Profile California 2014
State Bridge Profile California 2014artba
 

What's hot (20)

Vermont State Bridge Profile
Vermont State Bridge ProfileVermont State Bridge Profile
Vermont State Bridge Profile
 
Utah State Bridge Profile
Utah State Bridge ProfileUtah State Bridge Profile
Utah State Bridge Profile
 
State Bridge Profiles Alabama 2014
State Bridge Profiles Alabama 2014State Bridge Profiles Alabama 2014
State Bridge Profiles Alabama 2014
 
Massachusetts State Bridge Profile
Massachusetts State Bridge ProfileMassachusetts State Bridge Profile
Massachusetts State Bridge Profile
 
Kentucky State Bridge Profile
Kentucky State Bridge ProfileKentucky State Bridge Profile
Kentucky State Bridge Profile
 
Arizona State Bridge Profile
Arizona State Bridge ProfileArizona State Bridge Profile
Arizona State Bridge Profile
 
Maryland State Bridge Profile
Maryland State Bridge ProfileMaryland State Bridge Profile
Maryland State Bridge Profile
 
Georgia State Bridge Profile
Georgia State Bridge ProfileGeorgia State Bridge Profile
Georgia State Bridge Profile
 
Wisconsin State Bridge Profile
Wisconsin State Bridge ProfileWisconsin State Bridge Profile
Wisconsin State Bridge Profile
 
Rhode Island State Bridge Profile
Rhode Island State Bridge ProfileRhode Island State Bridge Profile
Rhode Island State Bridge Profile
 
Iowa State Bridge Profile
Iowa State Bridge ProfileIowa State Bridge Profile
Iowa State Bridge Profile
 
State Bridge Profile North Dakota 2014
State Bridge Profile North Dakota 2014State Bridge Profile North Dakota 2014
State Bridge Profile North Dakota 2014
 
Kansas State Bridge Profile
Kansas State Bridge ProfileKansas State Bridge Profile
Kansas State Bridge Profile
 
State Bridge Profile New York 2014
State Bridge Profile New York 2014State Bridge Profile New York 2014
State Bridge Profile New York 2014
 
Tennessee State Bridge Profile
Tennessee State Bridge ProfileTennessee State Bridge Profile
Tennessee State Bridge Profile
 
New Hampshire State Bridge Profile
New Hampshire State Bridge ProfileNew Hampshire State Bridge Profile
New Hampshire State Bridge Profile
 
State Bridge Profile Arkansas 2014
State Bridge Profile Arkansas 2014State Bridge Profile Arkansas 2014
State Bridge Profile Arkansas 2014
 
Ohio State Bridge Profile
Ohio State Bridge ProfileOhio State Bridge Profile
Ohio State Bridge Profile
 
Texas State Bridge Profile
Texas State Bridge ProfileTexas State Bridge Profile
Texas State Bridge Profile
 
State Bridge Profile California 2014
State Bridge Profile California 2014State Bridge Profile California 2014
State Bridge Profile California 2014
 

Viewers also liked (11)

MMA: seguiré trabajando por los chilpancinguenses
MMA: seguiré trabajando por los chilpancinguensesMMA: seguiré trabajando por los chilpancinguenses
MMA: seguiré trabajando por los chilpancinguenses
 
My All Time Favorites
My All Time FavoritesMy All Time Favorites
My All Time Favorites
 
Qué es un wikispace
Qué es un wikispaceQué es un wikispace
Qué es un wikispace
 
Pacto por el Bien Común
Pacto por el Bien ComúnPacto por el Bien Común
Pacto por el Bien Común
 
Carnegie1
Carnegie1Carnegie1
Carnegie1
 
Politicas de datos
Politicas de  datosPoliticas de  datos
Politicas de datos
 
Transcript
TranscriptTranscript
Transcript
 
California State Bridge Profile
California State Bridge ProfileCalifornia State Bridge Profile
California State Bridge Profile
 
Administracion de empresas
Administracion de empresasAdministracion de empresas
Administracion de empresas
 
Los números enteros
Los números enterosLos números enteros
Los números enteros
 
Program anger 2014
Program anger 2014 Program anger 2014
Program anger 2014
 

Similar to Maine's Structurally Deficient Bridges

Illinois State Bridge Profile
Illinois State Bridge ProfileIllinois State Bridge Profile
Illinois State Bridge Profileartba
 
Missouri State Bridge Profile
Missouri State Bridge ProfileMissouri State Bridge Profile
Missouri State Bridge Profileartba
 
North Carolina State Bridge Profile
North Carolina State Bridge ProfileNorth Carolina State Bridge Profile
North Carolina State Bridge Profileartba
 
Nebraska State Bridge Profile
Nebraska State Bridge ProfileNebraska State Bridge Profile
Nebraska State Bridge Profileartba
 
Oklahoma State Bridge Profile
Oklahoma State Bridge ProfileOklahoma State Bridge Profile
Oklahoma State Bridge Profileartba
 
DC State Bridge Profile
DC State Bridge ProfileDC State Bridge Profile
DC State Bridge Profileartba
 
State Bridge Profile North Carolina 2014
State Bridge Profile North Carolina 2014State Bridge Profile North Carolina 2014
State Bridge Profile North Carolina 2014artba
 
South Carolina State Bridge Profile
South Carolina State Bridge ProfileSouth Carolina State Bridge Profile
South Carolina State Bridge Profileartba
 
State Bridge Profile Nebraska 2014
State Bridge Profile Nebraska 2014State Bridge Profile Nebraska 2014
State Bridge Profile Nebraska 2014artba
 
State Bridge Profile Vermont 2014
State Bridge Profile Vermont 2014State Bridge Profile Vermont 2014
State Bridge Profile Vermont 2014artba
 
Oregon State Bridge Profile
Oregon State Bridge ProfileOregon State Bridge Profile
Oregon State Bridge Profileartba
 
Louisiana State Bridge Profile
Louisiana State Bridge ProfileLouisiana State Bridge Profile
Louisiana State Bridge Profileartba
 
State Bridge Profile South Carolina 2014
State Bridge Profile South Carolina 2014State Bridge Profile South Carolina 2014
State Bridge Profile South Carolina 2014artba
 

Similar to Maine's Structurally Deficient Bridges (13)

Illinois State Bridge Profile
Illinois State Bridge ProfileIllinois State Bridge Profile
Illinois State Bridge Profile
 
Missouri State Bridge Profile
Missouri State Bridge ProfileMissouri State Bridge Profile
Missouri State Bridge Profile
 
North Carolina State Bridge Profile
North Carolina State Bridge ProfileNorth Carolina State Bridge Profile
North Carolina State Bridge Profile
 
Nebraska State Bridge Profile
Nebraska State Bridge ProfileNebraska State Bridge Profile
Nebraska State Bridge Profile
 
Oklahoma State Bridge Profile
Oklahoma State Bridge ProfileOklahoma State Bridge Profile
Oklahoma State Bridge Profile
 
DC State Bridge Profile
DC State Bridge ProfileDC State Bridge Profile
DC State Bridge Profile
 
State Bridge Profile North Carolina 2014
State Bridge Profile North Carolina 2014State Bridge Profile North Carolina 2014
State Bridge Profile North Carolina 2014
 
South Carolina State Bridge Profile
South Carolina State Bridge ProfileSouth Carolina State Bridge Profile
South Carolina State Bridge Profile
 
State Bridge Profile Nebraska 2014
State Bridge Profile Nebraska 2014State Bridge Profile Nebraska 2014
State Bridge Profile Nebraska 2014
 
State Bridge Profile Vermont 2014
State Bridge Profile Vermont 2014State Bridge Profile Vermont 2014
State Bridge Profile Vermont 2014
 
Oregon State Bridge Profile
Oregon State Bridge ProfileOregon State Bridge Profile
Oregon State Bridge Profile
 
Louisiana State Bridge Profile
Louisiana State Bridge ProfileLouisiana State Bridge Profile
Louisiana State Bridge Profile
 
State Bridge Profile South Carolina 2014
State Bridge Profile South Carolina 2014State Bridge Profile South Carolina 2014
State Bridge Profile South Carolina 2014
 

More from artba

2017 media kit
2017 media kit2017 media kit
2017 media kitartba
 
September October tb_2016
September October tb_2016September October tb_2016
September October tb_2016artba
 
Transportation Builder July/August 2016
Transportation Builder July/August 2016Transportation Builder July/August 2016
Transportation Builder July/August 2016artba
 
The National Work Zone Management Conference Agenda 2016
The National Work Zone Management Conference Agenda 2016The National Work Zone Management Conference Agenda 2016
The National Work Zone Management Conference Agenda 2016artba
 
ARTBA 2016 National Convention Program
ARTBA 2016 National Convention ProgramARTBA 2016 National Convention Program
ARTBA 2016 National Convention Programartba
 
May/June Transportation Builder
May/June Transportation BuilderMay/June Transportation Builder
May/June Transportation Builderartba
 
Northeastern regional meeting
Northeastern regional meetingNortheastern regional meeting
Northeastern regional meetingartba
 
Southern regional meeting
Southern regional meetingSouthern regional meeting
Southern regional meetingartba
 
Central regional meeting
Central regional meetingCentral regional meeting
Central regional meetingartba
 
Western regional meeting
Western regional meetingWestern regional meeting
Western regional meetingartba
 
Western regional meeting
Western regional meetingWestern regional meeting
Western regional meetingartba
 
July/August 2015 TB magazine
July/August 2015 TB magazineJuly/August 2015 TB magazine
July/August 2015 TB magazineartba
 
September/October 2015 TB magazine
September/October 2015 TB magazineSeptember/October 2015 TB magazine
September/October 2015 TB magazineartba
 
November/December 2015 TB
November/December 2015 TBNovember/December 2015 TB
November/December 2015 TBartba
 
January/February 2016 TB
January/February 2016 TBJanuary/February 2016 TB
January/February 2016 TBartba
 
March/April 2016 TB
March/April 2016 TBMarch/April 2016 TB
March/April 2016 TBartba
 
2016 ­ARTBA FIP Schedule
2016 ­ARTBA FIP Schedule2016 ­ARTBA FIP Schedule
2016 ­ARTBA FIP Scheduleartba
 
2016 ARTBA FIP Program
2016 ARTBA FIP Program2016 ARTBA FIP Program
2016 ARTBA FIP Programartba
 
2016 ILDP Agenda
2016 ILDP Agenda2016 ILDP Agenda
2016 ILDP Agendaartba
 
P3 Agenda 2016
P3 Agenda 2016P3 Agenda 2016
P3 Agenda 2016artba
 

More from artba (20)

2017 media kit
2017 media kit2017 media kit
2017 media kit
 
September October tb_2016
September October tb_2016September October tb_2016
September October tb_2016
 
Transportation Builder July/August 2016
Transportation Builder July/August 2016Transportation Builder July/August 2016
Transportation Builder July/August 2016
 
The National Work Zone Management Conference Agenda 2016
The National Work Zone Management Conference Agenda 2016The National Work Zone Management Conference Agenda 2016
The National Work Zone Management Conference Agenda 2016
 
ARTBA 2016 National Convention Program
ARTBA 2016 National Convention ProgramARTBA 2016 National Convention Program
ARTBA 2016 National Convention Program
 
May/June Transportation Builder
May/June Transportation BuilderMay/June Transportation Builder
May/June Transportation Builder
 
Northeastern regional meeting
Northeastern regional meetingNortheastern regional meeting
Northeastern regional meeting
 
Southern regional meeting
Southern regional meetingSouthern regional meeting
Southern regional meeting
 
Central regional meeting
Central regional meetingCentral regional meeting
Central regional meeting
 
Western regional meeting
Western regional meetingWestern regional meeting
Western regional meeting
 
Western regional meeting
Western regional meetingWestern regional meeting
Western regional meeting
 
July/August 2015 TB magazine
July/August 2015 TB magazineJuly/August 2015 TB magazine
July/August 2015 TB magazine
 
September/October 2015 TB magazine
September/October 2015 TB magazineSeptember/October 2015 TB magazine
September/October 2015 TB magazine
 
November/December 2015 TB
November/December 2015 TBNovember/December 2015 TB
November/December 2015 TB
 
January/February 2016 TB
January/February 2016 TBJanuary/February 2016 TB
January/February 2016 TB
 
March/April 2016 TB
March/April 2016 TBMarch/April 2016 TB
March/April 2016 TB
 
2016 ­ARTBA FIP Schedule
2016 ­ARTBA FIP Schedule2016 ­ARTBA FIP Schedule
2016 ­ARTBA FIP Schedule
 
2016 ARTBA FIP Program
2016 ARTBA FIP Program2016 ARTBA FIP Program
2016 ARTBA FIP Program
 
2016 ILDP Agenda
2016 ILDP Agenda2016 ILDP Agenda
2016 ILDP Agenda
 
P3 Agenda 2016
P3 Agenda 2016P3 Agenda 2016
P3 Agenda 2016
 

Maine's Structurally Deficient Bridges

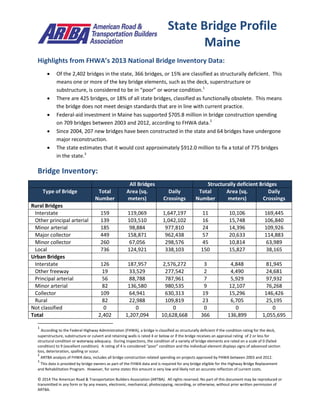
  • 1. © 2014 The American Road & Transportation Builders Association (ARTBA). All rights reserved. No part of this document may be reproduced or transmitted in any form or by any means, electronic, mechanical, photocopying, recording, or otherwise, without prior written permission of ARTBA. Highlights from FHWA’s 2013 National Bridge Inventory Data:  Of the 2,402 bridges in the state, 366 bridges, or 15% are classified as structurally deficient. This means one or more of the key bridge elements, such as the deck, superstructure or substructure, is considered to be in “poor” or worse condition.1  There are 425 bridges, or 18% of all state bridges, classified as functionally obsolete. This means the bridge does not meet design standards that are in line with current practice.  Federal-aid investment in Maine has supported $705.8 million in bridge construction spending on 709 bridges between 2003 and 2012, according to FHWA data.2  Since 2004, 207 new bridges have been constructed in the state and 64 bridges have undergone major reconstruction.  The state estimates that it would cost approximately $912.0 million to fix a total of 775 bridges in the state.3 Bridge Inventory: All Bridges Structurally deficient Bridges Type of Bridge Total Number Area (sq. meters) Daily Crossings Total Number Area (sq. meters) Daily Crossings Rural Bridges Interstate 159 119,069 1,647,197 11 10,106 169,445 Other principal arterial 139 103,510 1,042,102 16 15,748 106,840 Minor arterial 185 98,884 977,810 24 14,396 109,926 Major collector 449 158,871 962,438 57 20,633 114,883 Minor collector 260 67,056 298,576 45 10,814 63,989 Local 736 124,921 338,103 150 15,827 38,165 Urban Bridges Interstate 126 187,957 2,576,272 3 4,848 81,945 Other freeway 19 33,529 277,542 2 4,490 24,681 Principal arterial 56 88,788 787,961 7 5,929 97,932 Minor arterial 82 136,580 980,535 9 12,107 76,268 Collector 109 64,941 630,313 19 15,296 146,426 Local 82 22,988 109,819 23 6,705 25,195 Not classified 0 0 0 0 0 0 Total 2,402 1,207,094 10,628,668 366 136,899 1,055,695 1 According to the Federal Highway Administration (FHWA), a bridge is classified as structurally deficient if the condition rating for the deck, superstructure, substructure or culvert and retaining walls is rated 4 or below or if the bridge receives an appraisal rating of 2 or less for structural condition or waterway adequacy. During inspections, the condition of a variety of bridge elements are rated on a scale of 0 (failed condition) to 9 (excellent condition). A rating of 4 is considered “poor” condition and the individual element displays signs of advanced section loss, deterioration, spalling or scour. 2 ARTBA analysis of FHWA data, includes all bridge construction related spending on projects approved by FHWA between 2003 and 2012. 3 This data is provided by bridge owners as part of the FHWA data and is required for any bridge eligible for the Highway Bridge Replacement and Rehabilitation Program. However, for some states this amount is very low and likely not an accurate reflection of current costs. State Bridge Profile Maine
  • 2. © 2014 The American Road & Transportation Builders Association (ARTBA). All rights reserved. No part of this document may be reproduced or transmitted in any form or by any means, electronic, mechanical, photocopying, recording, or otherwise, without prior written permission of ARTBA. Proposed bridge work: Type of Work Number Cost (millions) Daily Crossings Area (sq. meters) Bridge replacement 339 $807.4 1,001,222 135,126 Widening & rehabilitation 296 $76.5 1,079,907 106,879 Rehabilitation 140 $28.1 764,155 90,979 Deck rehabilitation/replacement 0 $0.0 0 0 Other work 0 $0.0 0 0 Top 10 Most Traveled Structurally Deficient Bridges in the State County Year Built Daily Crossings Type of Bridge Location (route/water under the bridge, traffic on the bridge and location) Penobscot 1960 50,330 Urban Interstate KENDUSKEAG STR&VALLEY AV, INTERSTATE 95, 0.7 MI W JCT RTE 15 Cumberland 1956 27,415 Rural Interstate PISCATIQUA RIVER STR#28, I-95, 0.567 mi W of SR 100&26 Cumberland 1956 27,415 Rural Interstate PISCATIQUA RIVER STR #31, I-95, 0.095 mi NE of Hurricane Cumberland 1989 23,248 Urban other principal arterial STROUDWATER RIVER, ROUTES 9 & 22, 0.6 MI NE OF SW JCT 9&22 Somerset 1960 20,830 Rural Interstate ROUTE 201, I-95, 2 MI N TOWNLINE Somerset 1964 18,750 Rural Interstate M C RR, INTERSTATE 95, 0.1 MI E OF 95 / US201 Sagadahoc 1933 17,999 Rural arterial M C RR & A MARSH, US ROUTE 1, 1.1 MI NE OF BATH T L Sagadahoc 1958 17,980 Urban freeway/expressway SMO RR - CITY STREETS, US RTE # 1, 0.1 MI E OF JCT RTE 209 Cumberland 1943 17,073 Urban collector PRESUMPSCOT*RIVER, RTE 1, FALMOUTH-PORTLAND TL Penobscot 1960 16,735 Urban other principal arterial INTERSTATE 95, ROUTE 222, INTERCHANGE #47 Sources: All data is from the 2013 National Bridge Inventory, released by the Federal Highway Administration in March 2014. Note that specific conditions on bridge may have changed as a result of recent work. Cost estimates of bridge work provided as part of the data and have been adjusted to 2013$ for inflation and estimated project costs. Contract awards data is for state and local government awards and comes from McGraw Hill. Note that additional bridge investment may be a part of other contract awards if a smaller bridge project is included with a highway project, and that would not be accounted for in the total in this profile.