More Related Content
Similar to Missouri State Bridge Profile
Similar to Missouri State Bridge Profile (13)
Missouri State Bridge Profile
- 1. © 2014 The American Road & Transportation Builders Association (ARTBA). All rights reserved. No part of this document may be reproduced or
transmitted in any form or by any means, electronic, mechanical, photocopying, recording, or otherwise, without prior written permission of
ARTBA.
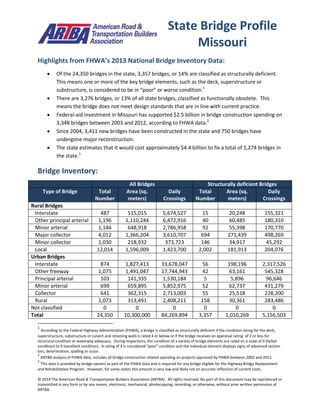
Highlights from FHWA’s 2013 National Bridge Inventory Data:
Of the 24,350 bridges in the state, 3,357 bridges, or 14% are classified as structurally deficient.
This means one or more of the key bridge elements, such as the deck, superstructure or
substructure, is considered to be in “poor” or worse condition.1
There are 3,276 bridges, or 13% of all state bridges, classified as functionally obsolete. This
means the bridge does not meet design standards that are in line with current practice.
Federal-aid investment in Missouri has supported $2.5 billion in bridge construction spending on
3,348 bridges between 2003 and 2012, according to FHWA data.2
Since 2004, 3,411 new bridges have been constructed in the state and 750 bridges have
undergone major reconstruction.
The state estimates that it would cost approximately $4.4 billion to fix a total of 5,274 bridges in
the state.3
Bridge Inventory:
All Bridges Structurally deficient Bridges
Type of Bridge Total
Number
Area (sq.
meters)
Daily
Crossings
Total
Number
Area (sq.
meters)
Daily
Crossings
Rural Bridges
Interstate 487 515,015 5,674,527 15 20,248 155,321
Other principal arterial 1,196 1,110,244 6,472,916 40 60,485 180,310
Minor arterial 1,146 648,918 2,786,958 92 55,398 170,770
Major collector 4,012 1,366,204 3,610,707 694 271,439 498,269
Minor collector 1,030 218,932 373,723 146 34,917 45,292
Local 12,014 1,596,009 1,423,700 2,002 181,913 204,076
Urban Bridges
Interstate 874 1,827,413 33,678,047 56 198,196 2,317,526
Other freeway 1,075 1,491,047 17,744,943 42 63,161 545,328
Principal arterial 103 141,335 1,530,184 5 5,896 96,646
Minor arterial 699 659,895 5,852,975 52 62,737 431,279
Collector 641 362,315 2,713,003 55 25,518 228,200
Local 1,073 313,491 2,408,211 158 30,361 283,486
Not classified 0 0 0 0 0 0
Total 24,350 10,300,000 84,269,894 3,357 1,010,269 5,156,503
1
According to the Federal Highway Administration (FHWA), a bridge is classified as structurally deficient if the condition rating for the deck,
superstructure, substructure or culvert and retaining walls is rated 4 or below or if the bridge receives an appraisal rating of 2 or less for
structural condition or waterway adequacy. During inspections, the condition of a variety of bridge elements are rated on a scale of 0 (failed
condition) to 9 (excellent condition). A rating of 4 is considered “poor” condition and the individual element displays signs of advanced section
loss, deterioration, spalling or scour.
2
ARTBA analysis of FHWA data, includes all bridge construction related spending on projects approved by FHWA between 2003 and 2012.
3
This data is provided by bridge owners as part of the FHWA data and is required for any bridge eligible for the Highway Bridge Replacement
and Rehabilitation Program. However, for some states this amount is very low and likely not an accurate reflection of current costs.
State Bridge Profile
Missouri
- 2. © 2014 The American Road & Transportation Builders Association (ARTBA). All rights reserved. No part of this document may be reproduced or
transmitted in any form or by any means, electronic, mechanical, photocopying, recording, or otherwise, without prior written permission of
ARTBA.
Proposed bridge work:
Type of Work Number Cost (millions) Daily Crossings Area (sq. meters)
Bridge replacement 3,400 $2,835.5 3,607,606 831,350
Widening & rehabilitation 1 $0.0 5,396 1,810
Rehabilitation 1,842 $1,547.4 8,655,812 895,183
Deck rehabilitation/replacement 0 $0.0 0 0
Other work 31 $3.7 4,971 8,258
Top 10 Most Traveled Structurally Deficient Bridges in the State
County Year
Built
Daily
Crossings
Type of Bridge Location
(route/water under the bridge, traffic on the bridge and location)
St. Louis 1964 199,598 Urban Interstate CST CONWAY RD, IS 270 E, S 15 T 45 N R 5 E
St. Louis 1931 89,239 Urban Interstate WATKINS CR, IS 270 E, S 34 T 47 N R 7 E
Platte 1957 80,493 Urban Interstate RT AA, IS 29 S, S 33 T 51 N R 33 W
St. Louis 1970 79,729 Urban Interstate CST JEFFERSON AVE, IS 44 E, S 27 T 45 N R 7 E
St. Louis 1958 75,616 Urban Interstate MISSOURI RVR CST MAIN S, IS 70 W, S 32 T 47 N R 5 E
Clay 1972 75,150 Urban Interstate MISSOURI RVR CST ELDON, IS 435 S, S 9 T 50 N R 32 W
Clay 1967 75,150 Urban Interstate DRAIN DTCH, IS 435 S, S 9 T 50 N R 32 W
St. Louis 1960 71,006 Urban Interstate RT N, IS 270 E, S 34 T 47 N R 6 E
St. Louis 1960 68,012 Urban Interstate RT N, IS 270 W, S 34 T 47 N R 6 E
St. Louis 1964 59,830 Urban Interstate MISSISSIPPI RVR, IS 270 E, S 36 T 47 N R 7 E
Sources: All data is from the 2013 National Bridge Inventory, released by the Federal Highway Administration in March 2014.
Note that specific conditions on bridge may have changed as a result of recent work. Cost estimates of bridge work provided as
part of the data and have been adjusted to 2013$ for inflation and estimated project costs. Contract awards data is for state
and local government awards and comes from McGraw Hill. Note that additional bridge investment may be a part of other
contract awards if a smaller bridge project is included with a highway project, and that would not be accounted for in the total
in this profile.