More Related Content
Similar to Iowa State Bridge Profile
Similar to Iowa State Bridge Profile (11)
Iowa State Bridge Profile
- 1. © 2014 The American Road & Transportation Builders Association (ARTBA). All rights reserved. No part of this document may be reproduced or
transmitted in any form or by any means, electronic, mechanical, photocopying, recording, or otherwise, without prior written permission of
ARTBA.
Highlights from FHWA’s 2013 National Bridge Inventory Data:
Of the 24,398 bridges in the state, 5,043 bridges, or 21% are classified as structurally deficient.
This means one or more of the key bridge elements, such as the deck, superstructure or
substructure, is considered to be in “poor” or worse condition.1
There are 1,228 bridges, or 5% of all state bridges, classified as functionally obsolete. This
means the bridge does not meet design standards that are in line with current practice.
Federal-aid investment in Iowa has supported $1.3 billion in bridge construction spending on
1,837 bridges between 2003 and 2012, according to FHWA data.2
Since 2004, 2,187 new bridges have been constructed in the state and 242 bridges have
undergone major reconstruction.
The state estimates that it would cost approximately $6.0 million to fix a total of 15,148 bridges
in the state.3
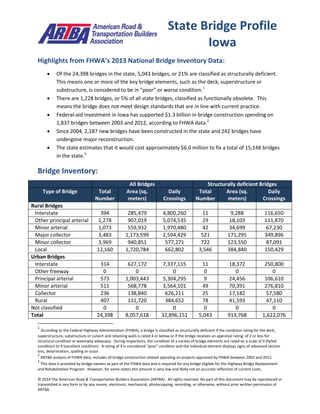
Bridge Inventory:
All Bridges Structurally deficient Bridges
Type of Bridge Total
Number
Area (sq.
meters)
Daily
Crossings
Total
Number
Area (sq.
meters)
Daily
Crossings
Rural Bridges
Interstate 394 285,479 4,800,260 11 9,288 116,650
Other principal arterial 1,278 907,019 5,074,535 29 18,103 111,870
Minor arterial 1,073 559,932 1,970,480 42 34,699 67,230
Major collector 3,483 1,173,599 2,594,429 521 171,295 349,896
Minor collector 3,969 940,851 577,271 722 123,550 87,091
Local 12,160 1,720,784 662,802 3,546 384,840 150,429
Urban Bridges
Interstate 314 627,172 7,337,115 11 18,372 250,800
Other freeway 0 0 0 0 0 0
Principal arterial 573 1,003,443 5,304,295 9 24,456 106,610
Minor arterial 511 568,778 3,564,101 49 70,391 276,810
Collector 236 138,840 626,211 25 17,182 57,580
Local 407 131,720 384,652 78 41,593 47,110
Not classified 0 0 0 0 0 0
Total 24,398 8,057,618 32,896,151 5,043 913,768 1,622,076
1
According to the Federal Highway Administration (FHWA), a bridge is classified as structurally deficient if the condition rating for the deck,
superstructure, substructure or culvert and retaining walls is rated 4 or below or if the bridge receives an appraisal rating of 2 or less for
structural condition or waterway adequacy. During inspections, the condition of a variety of bridge elements are rated on a scale of 0 (failed
condition) to 9 (excellent condition). A rating of 4 is considered “poor” condition and the individual element displays signs of advanced section
loss, deterioration, spalling or scour.
2
ARTBA analysis of FHWA data, includes all bridge construction related spending on projects approved by FHWA between 2003 and 2012.
3
This data is provided by bridge owners as part of the FHWA data and is required for any bridge eligible for the Highway Bridge Replacement
and Rehabilitation Program. However, for some states this amount is very low and likely not an accurate reflection of current costs.
State Bridge Profile
Iowa
- 2. © 2014 The American Road & Transportation Builders Association (ARTBA). All rights reserved. No part of this document may be reproduced or
transmitted in any form or by any means, electronic, mechanical, photocopying, recording, or otherwise, without prior written permission of
ARTBA.
Proposed bridge work:
Type of Work Number Cost (millions) Daily Crossings Area (sq. meters)
Bridge replacement 8,264 $1.3 1,667,874 1,300,702
Widening & rehabilitation 112 $0.0 140,719 32,873
Rehabilitation 1,387 $0.1 911,127 366,802
Deck rehabilitation/replacement 59 $0.0 50,945 29,403
Other work 5,326 $4.5 2,312,025 1,260,288
Top 10 Most Traveled Structurally Deficient Bridges in the State
County Year
Built
Daily
Crossings
Type of Bridge Location
(route/water under the bridge, traffic on the bridge and location)
Woodbury 1962 36,400 Urban Interstate CHANNEL FLOYD RIVER, I-29, 3.5 mi. N of N jct. US 75
Woodbury 1959 36,400 Urban Interstate FLOYD RIVER, I-29, 3.0 mi. N of Jct. U.S. 75
Woodbury 1959 32,400 Urban Interstate UP RR & WALL ST, I-29, 3.0 mi.N.of jct U.S.75
Scott 1940 31,800 Urban other
principal arterial
MISS.RVR RR & IA 461, US 67, at Davenport
Polk 1957 28,100 Urban Interstate RR TRUE PKWY CREEK, NB I-35, 1.2 mi. S of S Jct. I-80
Polk 1957 22,000 Urban Interstate GRAND AVE, SB I-35, 1.1 mi. N Jct. Iowa #5
Polk 1957 22,000 Urban Interstate GRAND AVE, NB I-35, 1.1 MI. N OF JCT. IA #5
Polk 1959 18,400 Urban Interstate US 65, EB I-80, AT JCT. U.S. 65
Polk 1959 18,400 Urban Interstate US 65, WB I-80, AT JCT. U.S. 65
Polk 1942 17,600 Urban other
principal arterial
NW 66TH AVE, IA 415, 2.1 MI. N OF JCT. I-80
Sources: All data is from the 2013 National Bridge Inventory, released by the Federal Highway Administration in March 2014.
Note that specific conditions on bridge may have changed as a result of recent work. Cost estimates of bridge work provided as
part of the data and have been adjusted to 2013$ for inflation and estimated project costs. Contract awards data is for state
and local government awards and comes from McGraw Hill. Note that additional bridge investment may be a part of other
contract awards if a smaller bridge project is included with a highway project, and that would not be accounted for in the total
in this profile.