Downloaded 16 times


![Which tissues are to be washed in water after fixation?
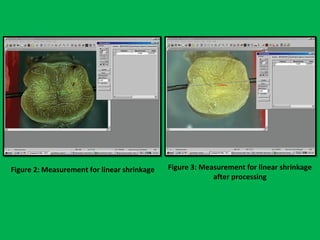
Pre processing preparation and measurements
Begg’s wire
Linear measurement in mm
(length)
3 chip CCD camera on Trinocular stereo microscope
(Olympus SZX7, Japan) calibrated for millimetre under × 10 magnification
Morphometric analysis
[8 mm × 8 mm × 6 mm]
a two dimension measurement of surface
area in square millimetres was done](https://image.slidesharecdn.com/presentation1-160209100045/85/A-rapid-manual-processing-technique-for-resource-limited-small-laboratories-14-320.jpg)
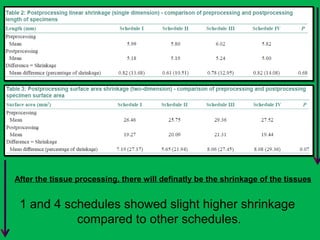
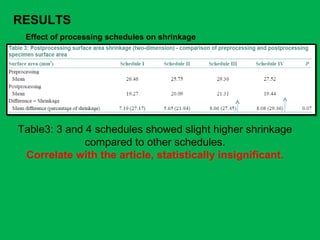
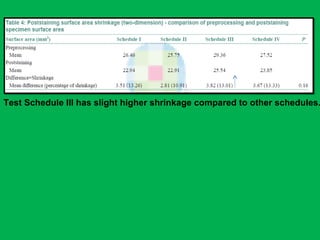
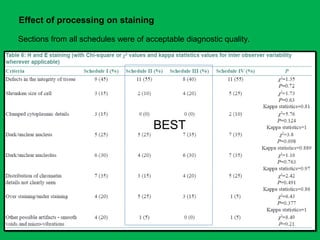
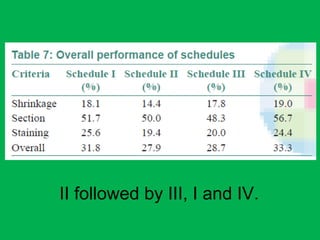
![•Summary of the mean percentages [Table 5]
calculated from overall shrinkage values
demonstrated a range of 14.4–19% shrinkage
of specimens by the Schedules and showed
schedule II to have the least overall shrinkage
followed by schedule III, schedule I and
schedule IV.](https://image.slidesharecdn.com/presentation1-160209100045/85/A-rapid-manual-processing-technique-for-resource-limited-small-laboratories-28-320.jpg)
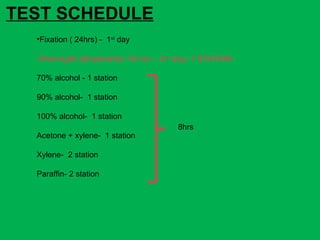


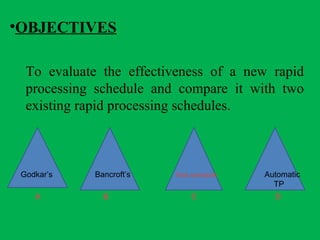
The document discusses a rapid manual processing technique for tissue samples in resource-limited small laboratories, focusing on the effectiveness of a new processing schedule. It evaluates the effectiveness of this schedule against two existing ones, analyzing qualitative results and tissue shrinkage. The findings suggest that while all schedules produce acceptable diagnostic quality, the new schedule offers a balance of efficiency and quality compared to traditional methods.