Downloaded 329 times


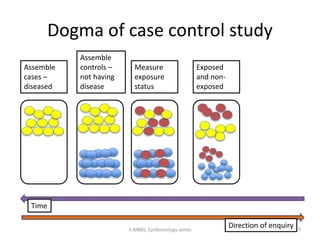


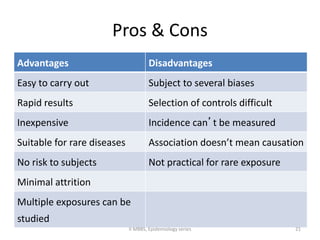
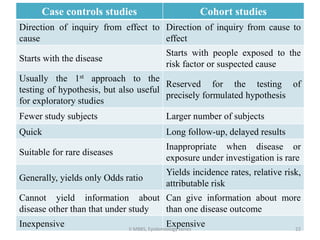


This document discusses case control studies, an observational study design that compares individuals with a disease or condition (cases) to individuals without the disease or condition (controls) to determine associations between exposures and disease outcomes. It provides an overview of key elements of case control studies, including the selection and matching of cases and controls, measurement of exposure, analysis using odds ratios, potential biases, advantages and disadvantages compared to cohort studies, and examples of case control studies conducted.


