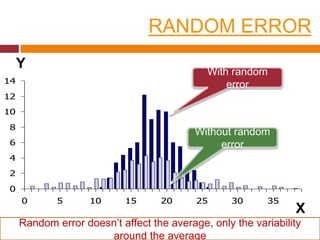
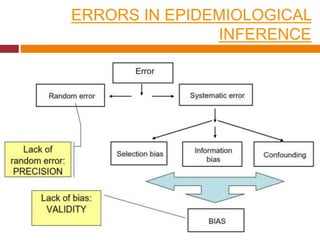
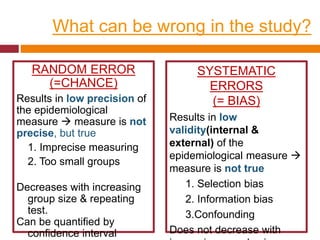
ERROR, 
BIAS 
& 
CONFOUNDING 
Dr. Amandeep Kaur
CONTENTS 
 Introduction 
 ERROR 
Types of error 
Random error 
 Type I & Type II error 
Systematic error 
Bias 
Types of bias 
Confounding 
 What to look for in observational studies?
EPIDEMIOLOGIC STUDY DESIGNS
ERROR 
Is considered as the difference between the unknown 
correct effect 
measure value and the study’s observed effect 
measure value. 
TYPES OF ERROR: 
 Random error/Non-differential: use of invalid outcome 
measure that equally misclassifies cases and controls 
 Systematic error/Differential: use of an invalid measure 
that misclassifies cases in one direction and misclassifies 
controls in another
14 
12 
10 
8 
6 
4 
2 
0 
RANDOM ERROR 
0 5 10 15 20 25 30 35 
X 
Y 
With random 
error 
Without random 
error 
Random error doesn’t affect the average, only the variability 
around the average
14 
12 
10 
8 
6 
4 
2 
0 
SYSTEMATIC ERROR 
With systematic 
error 
Without systematic 
error 
0 5 10 15 20 25 30 
Systematic error does affect the average, called as bias 
X 
Y
ERRORS IN EPIDEMIOLOGICAL 
INFERENCE
What can be wrong in the study? 
RANDOM ERROR 
(=CHANCE) 
Results in low precision of 
the epidemiological 
measure  measure is not 
precise, but true 
1. Imprecise measuring 
2. Too small groups 
Decreases with increasing 
group size & repeating 
test. 
Can be quantified by 
confidence interval 
SYSTEMATIC 
ERRORS 
(= BIAS) 
Results in low 
validity(internal & 
external) of the 
epidemiological measure  
measure is not true 
1. Selection bias 
2. Information bias 
3.Confounding 
Does not decrease with 
increasing sample size or
ERRORS IN EPIDEMIOLOGICAL 
STUDIES
x 
xxx 
80 90 
Diastolic Blood Pressure 
N 
True BP 
(cannula 
) 
Observed 
BP 
(cuff) 
xxxxxxx 
xxxx 
Chance 
Bias 
Adapted from Fletcher, 
Fletcher & Wagner,
A SKEPTIC'S ALGORITHM FOR 
ASSOCIATIONS
RANDOM ERROR 
TYPE II ERROR 
(PROBABILITY=β) 
CORRECT 
DECISION 
(PROBABLITY=1- 
β) 
POWER OF 
STUDY 
TREATMENTS 
NOT 
DIFFERENT 
CORRECT 
DECISION 
TYPE I ERROR 
(PROBABILITY=α) 
TREATMENTS 
ARE 
DIFFERENT 
CONCLUDE 
TREATMENTS 
NOT 
DIFFERENT 
CONCLUDE 
TREATMENTS 
ARE 
DIFFERENT 
REALITY 
DECISION
RANDOM ERROR
REDUCING RANDOM ERROR 
 Reducing the Risk of Type I Errors: 
 Lower  (p<0.05) 
 Repeat the study 
 Reducing the Risk of Type 2 Errors: 
 Providing adequate sample size, and 
 Hypothesizing large differences
BIAS 
DEFINITION: 
 Any systematic error in the design, 
conduct or analysis of a study that results 
in a mistaken estimate of an exposure’s 
effect on the risk of disease.
DIRECTION OF BIAS 
 Positive bias – observed effect is higher than the true value 
(causal effect) 
 Negative bias – observed effect is lower than the true 
value (causal effect) 
A BETTER APPROACH IS: 
 Bias towards the null – observed value is closer to 1.0 
than is the true value (causal effect)* 
 Bias away from the null – observed value is farther from 
1.0 than is the true value (causal effect)* 
*Note: 1 is the null value for ratio measures (e.g. OR, RR)
CLASSIFICATION ACCORDING TO 
STAGES OF RESEARCH 
Bias is a result of an error anywhere in the 
study 
 Literature Review 
 Study Design 
 Study Execution 
 Data Collection 
 Analysis 
 Interpretation of Results 
 Publication
SELECTION BIAS 
 If the way in which cases and controls, or exposed and non-exposed 
individuals, were selected is such that an apparent 
association is observed—even if, in reality, exposure and 
disease are not associated—the apparent association is the 
result of selection bias. 
Results from: 
 Self selection (volunteering) 
 Nonresponse (refusal) 
 Loss to follow-up (attrition, migration) 
 Selective survival 
 Health care utilization patterns 
 Systematic errors in detection and diagnosis of health conditions 
 Choice of an inappropriate comparison group (investigator
SELECTION BIAS 
SELF-SELECTION BIAS 
PUBLICITY BIAS: 
People referring themselves to investigators following publicity 
about the study. 
Considered a threat to validity. 
For example: study of leukemia among troops present at the 
Smoky Atomic Test in Nevada, 18% of participants contacted 
the investigators after publicity, and leukemia may have been 
over-represented in these people(had an axe to grind) 
HEALTHY WORKER EFFECT: 
Occurs before subjects are identified into study 
Relatively healthy people become or remain workers
SELECTION BIAS 
DIAGNOSTIC BIAS/WORK-UP BIAS: 
Occurs before the subjects are identified for study 
Diagnosis may be influenced by physician’s knowledge of 
exposure 
For example: A case-control study: for relationship between 
DVT and OCPs: general practitioners knew about the possible 
link between the two…. Could lead to over-estimation of the 
effect of OCPs on DVT 
HOSPITAL ADMISSION OR BERKSON’S BIAS: 
Occurs when the combination of exposure and disease under 
study increases the risk of hospital admission, thus leading to a 
higher exposure rate among the hospital cases than the
SELECTION BIAS 
PREVALENCE-INCIDENCE BIAS: 
When prevalent cases are used to study exposure-disease 
relationships 
Related to the phenomena: 
Once a person is diagnosed with a disease, they may 
change the habit that contributed to the disease. 
Prevalent cases represent survivors of the condition 
being studied and as survivors may be atypical with 
respect to exposure status they may misrepresent 
effects. (Selective survival/Neyman’s bias)
SELECTION BIAS 
EXCLUSION BIAS: 
 If the exclusion criteria are different for cases and 
controls or different for the exposed and non-exposed 
 A case–control hospital-based study: to find association 
between breast cancer & reserpine….. women who had 
medical conditions that would lead to the prescribed use 
of reserpine were excluded from the control group…. 
Leading to overestimation of the association between 
breast cancer and reserpine
SELECTION BIAS 
In CASE-CONTROL STUDIES: Potential Bias: due to poor 
choice of controls 
CASES CONTROL 
SELECTION 
Colorectal cancer 
patients admitted to 
hospital 
Patients admitted 
to hospital with 
arthritis 
Colorectal cancer 
patients admitted to 
hospital 
Patients admitted 
to hospital with 
peptic ulcers 
In COHORT STUDY: 
NON-REPRESENTATIV 
ENESS 
Controls probably 
have high degrees 
of exposure to 
NSAIDS 
Controls probably 
have low degrees 
of exposure to 
NSAIDS 
Differential loss to follow-up….. Differential Attrition 
SELECTION BIAS 
Would spuriously 
reduce the 
estimate of effect 
Would spuriously 
increase the 
estimate of effect 
Subjects in follow-up study of multiple sclerosis may differentially drop out 
due to disease severity
SELECTION BIAS 
NON-RESPONSE BIAS: 
In a prevalence study of asthma, chronic bronchitis, and 
respiratory symptoms, the characteristics of non-responders 
and the reasons for non-response were studied. 
Data were obtained by a mailed questionnaire. 
Non-responders were contacted by telephone and interviewed 
using the same questionnaire. 
Found a significantly higher proportion of current smokers and 
manual labourers among the non-responders than among the 
responders. 
Prevalence rates of wheezing, chronic cough, sputum 
production, attacks of breathlessness, and asthma and use of 
asthma medications were significantly higher among the non-responders 
than among the responders. 
Ronmark et al,
CONTROLLING SELECTION BIAS 
 Develop an explicit (objective) case definition. 
 Enroll all cases in a defined time and region. 
 Strive for high participation rates. 
 Take precautions to ensure representativeness. 
AMONG CASES: 
 Ensure that all medical facilities are thoroughly canvassed. 
 Develop an effective system for case ascertainment. 
AMONG CONTROLS: 
 Compare the prevalence of the exposure with other sources 
to evaluate credibility. 
 Attempt to draw controls from a variety of sources.
INFORMATION BIAS 
 When the means for obtaining information about the subjects 
in the study are inadequate so that as a result some of the 
information gathered regarding exposures and/or disease 
outcome is incorrect, Information bias can occur. 
Some sources of information bias are: 
 Subject variation 
 Observer variation 
 Deficiency of tools 
 Technical errors in measurement
INFORMATION BIAS 
MISCLASSIFICATION BIAS: 
Due to inaccuracies in methods of data acquisition, the 
subjects, at times, may be misclassified. 
For example, 
In a case-control study, cases may be misclassified as 
controls, and vice versa, due to 
the limited sensitivity and specificity of the diagnostic tests or 
from inadequacy of information derived from medical or other 
records. 
Person’s exposure status may be misclassified
INFORMATION BIAS 
MISCLASSIFICATION BIAS: 
Two forms: 
 Differential: If misclassification of exposure (or disease) is related 
to disease (or exposure) 
Women who had a baby with a malformation tend to remember 
more mild infections that occurred during their pregnancies than 
mothers of normal infants. 
 Non-differential: If misclassification of exposure (or disease) is 
unrelated to disease (or exposure) 
By mistake, some diseased persons are included in control 
group and some non-diseased persons in case 
group(misclassified in regard to diagnosis). 
As a result, a smaller difference in exposure will be found 
between our cases and our controls than actually exists between
TYPES OF INFORMATION BIAS 
 Recall bias 
 Reporting bias 
 Bias in abstracting records 
 Bias in interviewing 
 Bias from surrogate interviews 
 Surveillance bias
INFORMATION BIAS 
Recall bias: 
 Those exposed have a greater sensitivity for recalling 
exposure (reduced specificity) 
 Specifically important in case-control studies- when 
exposure history is obtained retrospectively 
 cases may more closely scrutinize their past history looking for ways 
to explain their illness 
 controls, not feeling a burden of disease, may less closely examine 
their past history 
Those who develop a cold are more likely to identify the 
exposure than those who do not – differential misclassification 
 Case: Yes, I was sneezed on 
 Control: No, can’t remember any sneezing
INFORMATION BIAS 
Reporting bias: 
 Individuals with severe disease tends to have complete records 
therefore more complete information about exposures and greater 
association found 
 Individuals who are aware of being participants of a study behave 
differently (Hawthorne effect) 
Wish bias: 
 Bias introduced by subjects who have developed a disease and 
who in attempting to answer the question “Why me?” seek to show, 
often unintentionally, that the disease is not their fault. 
 May deny certain exposures related to lifestyle (such as smoking or 
drinking); if contemplating litigation, may overemphasize 
workplace-related exposures. 
 Can be considered one type of reporting bias.
INFORMATION BIAS 
Surveillance bias: 
 If a population is monitored over a period of time, disease 
ascertainment may be better in the monitored population than 
in the general population 
 Leads to an erroneous estimate of the relative risk or odds 
ratio 
Surrogate interviews: 
 Obtaining information from person other than subject. 
 E.g., in case of diseases with high case-fatality rate
CONTROLLING INFORMATION BIAS 
 Blinding 
 prevents investigators and interviewers from knowing case/control or 
exposed/non-exposed status of a given participant 
 Form of survey 
 mail may impose less “white coat tension” than a phone or face-to-face 
interview 
 Questionnaire 
 use multiple questions that ask same information 
 acts as a built in double-check 
 Accuracy 
 multiple checks in medical records 
 gathering diagnosis data from multiple sources
PUBLICATION BIAS OR NON-PUBLICATION 
BIAS 
 Occurs because of the influence of study results 
on the chance of publication. 
Studies with positive results are more likely to be 
published than studies with negative results. 
 May result in a preponderance of false-positive 
results in the literature. 
 Bias is compounded when published studies are 
subjected to meta-analysis.
CONFOUNDING 
“a confusion of effects” 
Defined as: 
 a situation in which the measure of effect of 
exposure on disease is distorted because of the 
association of the study factor with other factors that 
influence the outcome. These other factors are 
called confounders.
CONFOUNDER 
 In a study of whether factor A is a cause of disease 
B, a third factor, factor X, is a confounder if the 
following are true: 
1. Factor X is a known risk factor for disease B. 
2. Factor X is associated with factor A, but is not a 
result of factor A.
EXAMPLE OF CONFOUNDING 
CAUSAL CONFOUN 
DING 
PANCREATIC 
CANCER 
PANCREATIC 
CANCER 
Coffee 
Drinking 
Coffee 
Drinking 
SMOKING 
OBSERVED 
ASSOCIATION 
OBSERVED 
ASSOCIATION
Cases of Down syndroms by birth order 
180 
160 
140 
120 
100 
80 
60 
40 
20 
0 
EXAMPLE OF CONFOUNDING 
1 2 3 4 5 
Birth order 
Cases per 100 000 
live births 
Cases of Down Syndrome by Birth Order
EXAMPLE OF CONFOUNDING 
Cases of Down Syndrom by age groups 
1000 
900 
800 
700 
600 
500 
400 
300 
200 
100 
0 
< 20 20-24 25-29 30-34 35-39 40+ 
Age groups 
Cases per 
100000 live 
births 
Cases of Down Syndrome by Age Groups
EXAMPLE OF CONFOUNDING 
Birth Order Down Syndrome 
Maternal Age 
Maternal age is correlated with birth 
order and a risk factor even if birth 
order is low
EXAMPLE OF CONFOUNDING 
Maternal Age Down Syndrome 
Birth Order 
Birth order is correlated with maternal 
age but not a risk factor in younger 
mothers
Cases per 100000 
1000 
900 
800 
700 
600 
500 
400 
300 
200 
100 
0 
CONFOUNDING 
1 2 3 4 5 
< 20 
25-29 
20-24 
35-39 
30-34 
40+ 
Birth order 
Age groups 
Cases of Down syndrom 
by birth order and mother's age 
Cases of Down Syndrome by Birth Order and Maternal Age 
If each case is matched with a same-age control, there will be 
no association. If analysis is repeated after stratification by 
age, there will be no association with birth order.
CONTROL OF CONFOUNDING 
 Control at the design stage 
Randomization: of subjects to study groups to attempt 
to even out unknown confounders 
Restriction: of subjects according to potential 
confounders (i.e. simply don’t include confounder in 
study) 
Matching: subjects on potential confounder thus 
assuring even distribution among study groups
CONTROL OF CONFOUNDING 
 Control at the analysis stage 
Conventional approaches 
 Stratified analyses 
 Multivariate analyses 
Newer approaches 
 Graphical approaches using Directed acyclic 
graph(DAGs) 
 Propensity scores 
 Instrumental variables 
 Marginal structural models
What to look for in observational studies? 
 Is the selection bias present? 
In a cohort study, are participants in the exposed and 
unexposed groups similar in all important respects except 
for the exposure? 
In a case-control study, are cases and controls similar in all 
important respects except for the disease in question? 
 Is the information bias present? 
In a cohort study, is information about outcome obtained in 
the same way for those exposed and unexposed? 
In a case-control study, is information about exposure 
gathered in the same way for cases and controls?
What to look for in observational studies? 
 Is confounding present? 
Could the results be accounted for by the presence of a 
factor – e.g., age, smoking, diet, -- associated with both 
the exposure and the outcome but not directly involved 
in the causal pathway? 
 If the results cannot be explained by these three 
biases, could they be the result of chance? 
What are the relative risk or odds ratio and 
95%Confidence Interval? 
Is the difference statistically significant, and, if not, did 
the study have adequate power to find a clinically 
important difference?
What to look for in observational studies? 
 If the results still cannot be explained, then 
(and only then) might the findings be real and 
worthy of note?
IDEAL GROUP COMPARISON MODEL 
Factors affecting the Dependent Variable 
140 
120 
100 
80 
60 
40 
20 
0 
Control Group Experimental Group 
Effect 
Independent Variable 
Confounder(s) - others 
Confounder: Placebo 
effect 
Confounder: Hawthorne 
effect 
Natural history
CLASSIFIED ACCORDING 
TO STAGES OF 
RESEARCH
LITERATURE REVIEW 
 Foreign language exclusion bias 
 Literature search bias 
 One-sided reference bias 
 Rhetoric bias
STUDY DESIGN 
 - Selection bias 
 - Sampling frame bias 
Berkson (admission rate) 
bias 
Centripetal bias 
Diagnostic access bias 
Diagnostic purity bias 
Hospital access bias 
Migrator bias 
Prevalence-incidence 
(Neyman / selective 
survival; attrition) bias 
 Nonrandom sampling 
bias 
Autopsy series bias 
Detection bias 
Diagnostic work-up bias 
Door-to-door solicitation 
bias 
Previous opinion bias 
Referral filter bias 
Sampling bias 
Self-selection bias 
Unmasking bias
STUDY DESIGN 
 - Non-coverage bias 
Early-comer bias 
Illegal immigrant bias 
Loss to follow-up 
(attrition) bias 
Response bias 
Withdrawal bias 
 Non-comparability 
bias 
Ecological 
(aggregation) bias 
Healthy worker effect 
(HWE) 
Lead-time bias 
Length bias 
Membership bias 
Mimicry bias 
Non-simultaneous 
comparison bias 
Sample size bias
STUDY EXECUTION 
 Bogus control bias 
 Contamination bias 
 Compliance bias
DATA COLLECTION 
 - Instrument bias 
Case definition bias 
Diagnostic vogue bias 
Forced choice bias 
Framing bias 
Insensitive measure bias 
Juxtaposed scale bias 
Laboratory data bias 
Questionnaire bias 
Scale format bias 
Sensitive question bias 
Stage bias 
Unacceptability bias 
Underlying/contributing cause of 
death bias 
Voluntary reporting bias 
 - Data source bias 
Competing death bias 
Family history bias 
Hospital discharge bias 
Spatial bias 
 - Observer bias 
Diagnostic suspicion 
bias 
Exposure suspicion 
bias 
Expectation bias 
Interviewer bias 
Therapeutic personality 
bias
DATA COLLECTION 
 - Subject bias 
Apprehension bias 
Attention bias (Hawthorne 
effect) 
Culture bias 
End-aversion bias (end-of-scale 
or central tendency 
bias) 
Faking bad bias 
Faking good bias 
Family information bias 
Interview setting bias 
Obsequiousness bias 
Positive satisfaction bias 
Proxy respondent bias 
 - Recall bias 
Reporting bias 
Response fatigue bias 
Unacceptable disease 
bias 
Unacceptable exposure 
bias 
Underlying cause 
(rumination bias) 
Yes-saying bias 
 - Data handling bias 
Data capture error 
Data entry bias 
Data merging error 
Digit preference bias 
Record linkage bias
ANALYSIS 
 - Confounding bias 
Latency bias 
Multiple exposure bias 
Nonrandom sampling bias 
Standard population bias 
Spectrum bias 
 - Post hoc analysis bias 
Data dredging bias 
Post hoc significance bias 
Repeated peeks bias 
 - Analysis strategy 
bias 
Distribution assumption 
bias 
Enquiry unit bias 
Estimator bias 
Missing data handling 
bias 
Outlier handling bias 
Overmatching bias 
Scale degradation bias
INTERPRETATION OF RESULTS 
 Assumption bias 
 Cognitive dissonance bias 
 Correlation bias 
 Generalization bias 
 Magnitude bias 
 Significance bias 
 Under-exhaustion bias
PUBLICATION 
 All's well literature bias 
 Positive result bias 
 Hot topic bias
LEAD TIME BIAS 
 Overestimation of survival duration among screen 
detected cases when survival is measured from 
diagnosis.
LENGTH TIME BIAS 
Overestimation of survival duration among screen-detected 
cases due to the relative excess of slowly 
progressing cases. 
These are disproportionally identified by screening 
because the probability of detection is directly 
proportional to the length of time during which they 
are detectable.
OVER DIAGNOSIS BIAS 
 Over diagnosis occurs when all of these people with 
harmless abnormalities are counted as "lives saved" 
by the screening, rather than as "healthy people 
needlessly harmed by over diagnosis". 
 Screening may identify abnormalities that would 
never cause a problem in a person's lifetime. For 
example, prostate cancer screening; it has been 
said that "more men die with prostate cancer than of 
it". 
 Issues unnecessary treatment.
Potential Role of Chance in Affecting the Effect: 
Meaning of Statistical Significance 
77 Factors affecting the Dependent Variable 
140 
120 
100 
80 
60 
40 
20 
0 
Control Group Experimental Group 
Effect 
Independent Variable 
Confounder(s) - others 
Confounder: Placebo 
effect 
Confounder: Hawthorne 
effect 
Natural history 
p< 
p>
Flawed Model 
Control groFuacpto rrse acffeecivtinegs t hteh Dee pinenddeenpt eVanrdiabelent variable. 
120 
100 
80 
60 
40 
20 
0 
Control Group Experimental Group 
Effect 
Independent Variable 
Confounder(s) - others 
Confounder: Placebo 
effect 
Confounder: Hawthorne 
effect 
Natural history
Flawed Model 
Unbalanced confounding variables 
Factors affecting the Dependent Variable 
S. Wetstone 
90 
80 
70 
60 
50 
40 
30 
20 
10 
0 
Control Group Experimental Group 
Effect 
Independent Variable 
Confounder(s) - others 
Confounder: Placebo 
effect 
Confounder: Hawthorne 
effect 
Natural history

Error, confounding and bias

  • 1.
    ERROR, BIAS & CONFOUNDING Dr. Amandeep Kaur
  • 2.
    CONTENTS  Introduction  ERROR Types of error Random error  Type I & Type II error Systematic error Bias Types of bias Confounding  What to look for in observational studies?
  • 4.
  • 5.
    ERROR Is consideredas the difference between the unknown correct effect measure value and the study’s observed effect measure value. TYPES OF ERROR:  Random error/Non-differential: use of invalid outcome measure that equally misclassifies cases and controls  Systematic error/Differential: use of an invalid measure that misclassifies cases in one direction and misclassifies controls in another
  • 6.
    14 12 10 8 6 4 2 0 RANDOM ERROR 0 5 10 15 20 25 30 35 X Y With random error Without random error Random error doesn’t affect the average, only the variability around the average
  • 7.
    14 12 10 8 6 4 2 0 SYSTEMATIC ERROR With systematic error Without systematic error 0 5 10 15 20 25 30 Systematic error does affect the average, called as bias X Y
  • 8.
  • 9.
    What can bewrong in the study? RANDOM ERROR (=CHANCE) Results in low precision of the epidemiological measure  measure is not precise, but true 1. Imprecise measuring 2. Too small groups Decreases with increasing group size & repeating test. Can be quantified by confidence interval SYSTEMATIC ERRORS (= BIAS) Results in low validity(internal & external) of the epidemiological measure  measure is not true 1. Selection bias 2. Information bias 3.Confounding Does not decrease with increasing sample size or
  • 10.
  • 12.
    x xxx 8090 Diastolic Blood Pressure N True BP (cannula ) Observed BP (cuff) xxxxxxx xxxx Chance Bias Adapted from Fletcher, Fletcher & Wagner,
  • 13.
    A SKEPTIC'S ALGORITHMFOR ASSOCIATIONS
  • 15.
    RANDOM ERROR TYPEII ERROR (PROBABILITY=β) CORRECT DECISION (PROBABLITY=1- β) POWER OF STUDY TREATMENTS NOT DIFFERENT CORRECT DECISION TYPE I ERROR (PROBABILITY=α) TREATMENTS ARE DIFFERENT CONCLUDE TREATMENTS NOT DIFFERENT CONCLUDE TREATMENTS ARE DIFFERENT REALITY DECISION
  • 16.
  • 17.
    REDUCING RANDOM ERROR  Reducing the Risk of Type I Errors:  Lower  (p<0.05)  Repeat the study  Reducing the Risk of Type 2 Errors:  Providing adequate sample size, and  Hypothesizing large differences
  • 19.
    BIAS DEFINITION: Any systematic error in the design, conduct or analysis of a study that results in a mistaken estimate of an exposure’s effect on the risk of disease.
  • 20.
    DIRECTION OF BIAS  Positive bias – observed effect is higher than the true value (causal effect)  Negative bias – observed effect is lower than the true value (causal effect) A BETTER APPROACH IS:  Bias towards the null – observed value is closer to 1.0 than is the true value (causal effect)*  Bias away from the null – observed value is farther from 1.0 than is the true value (causal effect)* *Note: 1 is the null value for ratio measures (e.g. OR, RR)
  • 21.
    CLASSIFICATION ACCORDING TO STAGES OF RESEARCH Bias is a result of an error anywhere in the study  Literature Review  Study Design  Study Execution  Data Collection  Analysis  Interpretation of Results  Publication
  • 24.
    SELECTION BIAS If the way in which cases and controls, or exposed and non-exposed individuals, were selected is such that an apparent association is observed—even if, in reality, exposure and disease are not associated—the apparent association is the result of selection bias. Results from:  Self selection (volunteering)  Nonresponse (refusal)  Loss to follow-up (attrition, migration)  Selective survival  Health care utilization patterns  Systematic errors in detection and diagnosis of health conditions  Choice of an inappropriate comparison group (investigator
  • 25.
    SELECTION BIAS SELF-SELECTIONBIAS PUBLICITY BIAS: People referring themselves to investigators following publicity about the study. Considered a threat to validity. For example: study of leukemia among troops present at the Smoky Atomic Test in Nevada, 18% of participants contacted the investigators after publicity, and leukemia may have been over-represented in these people(had an axe to grind) HEALTHY WORKER EFFECT: Occurs before subjects are identified into study Relatively healthy people become or remain workers
  • 26.
    SELECTION BIAS DIAGNOSTICBIAS/WORK-UP BIAS: Occurs before the subjects are identified for study Diagnosis may be influenced by physician’s knowledge of exposure For example: A case-control study: for relationship between DVT and OCPs: general practitioners knew about the possible link between the two…. Could lead to over-estimation of the effect of OCPs on DVT HOSPITAL ADMISSION OR BERKSON’S BIAS: Occurs when the combination of exposure and disease under study increases the risk of hospital admission, thus leading to a higher exposure rate among the hospital cases than the
  • 27.
    SELECTION BIAS PREVALENCE-INCIDENCEBIAS: When prevalent cases are used to study exposure-disease relationships Related to the phenomena: Once a person is diagnosed with a disease, they may change the habit that contributed to the disease. Prevalent cases represent survivors of the condition being studied and as survivors may be atypical with respect to exposure status they may misrepresent effects. (Selective survival/Neyman’s bias)
  • 28.
    SELECTION BIAS EXCLUSIONBIAS:  If the exclusion criteria are different for cases and controls or different for the exposed and non-exposed  A case–control hospital-based study: to find association between breast cancer & reserpine….. women who had medical conditions that would lead to the prescribed use of reserpine were excluded from the control group…. Leading to overestimation of the association between breast cancer and reserpine
  • 29.
    SELECTION BIAS InCASE-CONTROL STUDIES: Potential Bias: due to poor choice of controls CASES CONTROL SELECTION Colorectal cancer patients admitted to hospital Patients admitted to hospital with arthritis Colorectal cancer patients admitted to hospital Patients admitted to hospital with peptic ulcers In COHORT STUDY: NON-REPRESENTATIV ENESS Controls probably have high degrees of exposure to NSAIDS Controls probably have low degrees of exposure to NSAIDS Differential loss to follow-up….. Differential Attrition SELECTION BIAS Would spuriously reduce the estimate of effect Would spuriously increase the estimate of effect Subjects in follow-up study of multiple sclerosis may differentially drop out due to disease severity
  • 30.
    SELECTION BIAS NON-RESPONSEBIAS: In a prevalence study of asthma, chronic bronchitis, and respiratory symptoms, the characteristics of non-responders and the reasons for non-response were studied. Data were obtained by a mailed questionnaire. Non-responders were contacted by telephone and interviewed using the same questionnaire. Found a significantly higher proportion of current smokers and manual labourers among the non-responders than among the responders. Prevalence rates of wheezing, chronic cough, sputum production, attacks of breathlessness, and asthma and use of asthma medications were significantly higher among the non-responders than among the responders. Ronmark et al,
  • 31.
    CONTROLLING SELECTION BIAS  Develop an explicit (objective) case definition.  Enroll all cases in a defined time and region.  Strive for high participation rates.  Take precautions to ensure representativeness. AMONG CASES:  Ensure that all medical facilities are thoroughly canvassed.  Develop an effective system for case ascertainment. AMONG CONTROLS:  Compare the prevalence of the exposure with other sources to evaluate credibility.  Attempt to draw controls from a variety of sources.
  • 33.
    INFORMATION BIAS When the means for obtaining information about the subjects in the study are inadequate so that as a result some of the information gathered regarding exposures and/or disease outcome is incorrect, Information bias can occur. Some sources of information bias are:  Subject variation  Observer variation  Deficiency of tools  Technical errors in measurement
  • 34.
    INFORMATION BIAS MISCLASSIFICATIONBIAS: Due to inaccuracies in methods of data acquisition, the subjects, at times, may be misclassified. For example, In a case-control study, cases may be misclassified as controls, and vice versa, due to the limited sensitivity and specificity of the diagnostic tests or from inadequacy of information derived from medical or other records. Person’s exposure status may be misclassified
  • 35.
    INFORMATION BIAS MISCLASSIFICATIONBIAS: Two forms:  Differential: If misclassification of exposure (or disease) is related to disease (or exposure) Women who had a baby with a malformation tend to remember more mild infections that occurred during their pregnancies than mothers of normal infants.  Non-differential: If misclassification of exposure (or disease) is unrelated to disease (or exposure) By mistake, some diseased persons are included in control group and some non-diseased persons in case group(misclassified in regard to diagnosis). As a result, a smaller difference in exposure will be found between our cases and our controls than actually exists between
  • 36.
    TYPES OF INFORMATIONBIAS  Recall bias  Reporting bias  Bias in abstracting records  Bias in interviewing  Bias from surrogate interviews  Surveillance bias
  • 37.
    INFORMATION BIAS Recallbias:  Those exposed have a greater sensitivity for recalling exposure (reduced specificity)  Specifically important in case-control studies- when exposure history is obtained retrospectively  cases may more closely scrutinize their past history looking for ways to explain their illness  controls, not feeling a burden of disease, may less closely examine their past history Those who develop a cold are more likely to identify the exposure than those who do not – differential misclassification  Case: Yes, I was sneezed on  Control: No, can’t remember any sneezing
  • 38.
    INFORMATION BIAS Reportingbias:  Individuals with severe disease tends to have complete records therefore more complete information about exposures and greater association found  Individuals who are aware of being participants of a study behave differently (Hawthorne effect) Wish bias:  Bias introduced by subjects who have developed a disease and who in attempting to answer the question “Why me?” seek to show, often unintentionally, that the disease is not their fault.  May deny certain exposures related to lifestyle (such as smoking or drinking); if contemplating litigation, may overemphasize workplace-related exposures.  Can be considered one type of reporting bias.
  • 39.
    INFORMATION BIAS Surveillancebias:  If a population is monitored over a period of time, disease ascertainment may be better in the monitored population than in the general population  Leads to an erroneous estimate of the relative risk or odds ratio Surrogate interviews:  Obtaining information from person other than subject.  E.g., in case of diseases with high case-fatality rate
  • 40.
    CONTROLLING INFORMATION BIAS  Blinding  prevents investigators and interviewers from knowing case/control or exposed/non-exposed status of a given participant  Form of survey  mail may impose less “white coat tension” than a phone or face-to-face interview  Questionnaire  use multiple questions that ask same information  acts as a built in double-check  Accuracy  multiple checks in medical records  gathering diagnosis data from multiple sources
  • 41.
    PUBLICATION BIAS ORNON-PUBLICATION BIAS  Occurs because of the influence of study results on the chance of publication. Studies with positive results are more likely to be published than studies with negative results.  May result in a preponderance of false-positive results in the literature.  Bias is compounded when published studies are subjected to meta-analysis.
  • 43.
    CONFOUNDING “a confusionof effects” Defined as:  a situation in which the measure of effect of exposure on disease is distorted because of the association of the study factor with other factors that influence the outcome. These other factors are called confounders.
  • 44.
    CONFOUNDER  Ina study of whether factor A is a cause of disease B, a third factor, factor X, is a confounder if the following are true: 1. Factor X is a known risk factor for disease B. 2. Factor X is associated with factor A, but is not a result of factor A.
  • 45.
    EXAMPLE OF CONFOUNDING CAUSAL CONFOUN DING PANCREATIC CANCER PANCREATIC CANCER Coffee Drinking Coffee Drinking SMOKING OBSERVED ASSOCIATION OBSERVED ASSOCIATION
  • 46.
    Cases of Downsyndroms by birth order 180 160 140 120 100 80 60 40 20 0 EXAMPLE OF CONFOUNDING 1 2 3 4 5 Birth order Cases per 100 000 live births Cases of Down Syndrome by Birth Order
  • 47.
    EXAMPLE OF CONFOUNDING Cases of Down Syndrom by age groups 1000 900 800 700 600 500 400 300 200 100 0 < 20 20-24 25-29 30-34 35-39 40+ Age groups Cases per 100000 live births Cases of Down Syndrome by Age Groups
  • 48.
    EXAMPLE OF CONFOUNDING Birth Order Down Syndrome Maternal Age Maternal age is correlated with birth order and a risk factor even if birth order is low
  • 49.
    EXAMPLE OF CONFOUNDING Maternal Age Down Syndrome Birth Order Birth order is correlated with maternal age but not a risk factor in younger mothers
  • 50.
    Cases per 100000 1000 900 800 700 600 500 400 300 200 100 0 CONFOUNDING 1 2 3 4 5 < 20 25-29 20-24 35-39 30-34 40+ Birth order Age groups Cases of Down syndrom by birth order and mother's age Cases of Down Syndrome by Birth Order and Maternal Age If each case is matched with a same-age control, there will be no association. If analysis is repeated after stratification by age, there will be no association with birth order.
  • 51.
    CONTROL OF CONFOUNDING  Control at the design stage Randomization: of subjects to study groups to attempt to even out unknown confounders Restriction: of subjects according to potential confounders (i.e. simply don’t include confounder in study) Matching: subjects on potential confounder thus assuring even distribution among study groups
  • 52.
    CONTROL OF CONFOUNDING  Control at the analysis stage Conventional approaches  Stratified analyses  Multivariate analyses Newer approaches  Graphical approaches using Directed acyclic graph(DAGs)  Propensity scores  Instrumental variables  Marginal structural models
  • 54.
    What to lookfor in observational studies?  Is the selection bias present? In a cohort study, are participants in the exposed and unexposed groups similar in all important respects except for the exposure? In a case-control study, are cases and controls similar in all important respects except for the disease in question?  Is the information bias present? In a cohort study, is information about outcome obtained in the same way for those exposed and unexposed? In a case-control study, is information about exposure gathered in the same way for cases and controls?
  • 55.
    What to lookfor in observational studies?  Is confounding present? Could the results be accounted for by the presence of a factor – e.g., age, smoking, diet, -- associated with both the exposure and the outcome but not directly involved in the causal pathway?  If the results cannot be explained by these three biases, could they be the result of chance? What are the relative risk or odds ratio and 95%Confidence Interval? Is the difference statistically significant, and, if not, did the study have adequate power to find a clinically important difference?
  • 56.
    What to lookfor in observational studies?  If the results still cannot be explained, then (and only then) might the findings be real and worthy of note?
  • 57.
    IDEAL GROUP COMPARISONMODEL Factors affecting the Dependent Variable 140 120 100 80 60 40 20 0 Control Group Experimental Group Effect Independent Variable Confounder(s) - others Confounder: Placebo effect Confounder: Hawthorne effect Natural history
  • 59.
    CLASSIFIED ACCORDING TOSTAGES OF RESEARCH
  • 60.
    LITERATURE REVIEW Foreign language exclusion bias  Literature search bias  One-sided reference bias  Rhetoric bias
  • 61.
    STUDY DESIGN - Selection bias  - Sampling frame bias Berkson (admission rate) bias Centripetal bias Diagnostic access bias Diagnostic purity bias Hospital access bias Migrator bias Prevalence-incidence (Neyman / selective survival; attrition) bias  Nonrandom sampling bias Autopsy series bias Detection bias Diagnostic work-up bias Door-to-door solicitation bias Previous opinion bias Referral filter bias Sampling bias Self-selection bias Unmasking bias
  • 62.
    STUDY DESIGN - Non-coverage bias Early-comer bias Illegal immigrant bias Loss to follow-up (attrition) bias Response bias Withdrawal bias  Non-comparability bias Ecological (aggregation) bias Healthy worker effect (HWE) Lead-time bias Length bias Membership bias Mimicry bias Non-simultaneous comparison bias Sample size bias
  • 63.
    STUDY EXECUTION Bogus control bias  Contamination bias  Compliance bias
  • 64.
    DATA COLLECTION - Instrument bias Case definition bias Diagnostic vogue bias Forced choice bias Framing bias Insensitive measure bias Juxtaposed scale bias Laboratory data bias Questionnaire bias Scale format bias Sensitive question bias Stage bias Unacceptability bias Underlying/contributing cause of death bias Voluntary reporting bias  - Data source bias Competing death bias Family history bias Hospital discharge bias Spatial bias  - Observer bias Diagnostic suspicion bias Exposure suspicion bias Expectation bias Interviewer bias Therapeutic personality bias
  • 65.
    DATA COLLECTION - Subject bias Apprehension bias Attention bias (Hawthorne effect) Culture bias End-aversion bias (end-of-scale or central tendency bias) Faking bad bias Faking good bias Family information bias Interview setting bias Obsequiousness bias Positive satisfaction bias Proxy respondent bias  - Recall bias Reporting bias Response fatigue bias Unacceptable disease bias Unacceptable exposure bias Underlying cause (rumination bias) Yes-saying bias  - Data handling bias Data capture error Data entry bias Data merging error Digit preference bias Record linkage bias
  • 66.
    ANALYSIS  -Confounding bias Latency bias Multiple exposure bias Nonrandom sampling bias Standard population bias Spectrum bias  - Post hoc analysis bias Data dredging bias Post hoc significance bias Repeated peeks bias  - Analysis strategy bias Distribution assumption bias Enquiry unit bias Estimator bias Missing data handling bias Outlier handling bias Overmatching bias Scale degradation bias
  • 67.
    INTERPRETATION OF RESULTS  Assumption bias  Cognitive dissonance bias  Correlation bias  Generalization bias  Magnitude bias  Significance bias  Under-exhaustion bias
  • 68.
    PUBLICATION  All'swell literature bias  Positive result bias  Hot topic bias
  • 70.
    LEAD TIME BIAS  Overestimation of survival duration among screen detected cases when survival is measured from diagnosis.
  • 72.
    LENGTH TIME BIAS Overestimation of survival duration among screen-detected cases due to the relative excess of slowly progressing cases. These are disproportionally identified by screening because the probability of detection is directly proportional to the length of time during which they are detectable.
  • 74.
    OVER DIAGNOSIS BIAS  Over diagnosis occurs when all of these people with harmless abnormalities are counted as "lives saved" by the screening, rather than as "healthy people needlessly harmed by over diagnosis".  Screening may identify abnormalities that would never cause a problem in a person's lifetime. For example, prostate cancer screening; it has been said that "more men die with prostate cancer than of it".  Issues unnecessary treatment.
  • 75.
    Potential Role ofChance in Affecting the Effect: Meaning of Statistical Significance 77 Factors affecting the Dependent Variable 140 120 100 80 60 40 20 0 Control Group Experimental Group Effect Independent Variable Confounder(s) - others Confounder: Placebo effect Confounder: Hawthorne effect Natural history p< p>
  • 76.
    Flawed Model ControlgroFuacpto rrse acffeecivtinegs t hteh Dee pinenddeenpt eVanrdiabelent variable. 120 100 80 60 40 20 0 Control Group Experimental Group Effect Independent Variable Confounder(s) - others Confounder: Placebo effect Confounder: Hawthorne effect Natural history
  • 77.
    Flawed Model Unbalancedconfounding variables Factors affecting the Dependent Variable S. Wetstone 90 80 70 60 50 40 30 20 10 0 Control Group Experimental Group Effect Independent Variable Confounder(s) - others Confounder: Placebo effect Confounder: Hawthorne effect Natural history