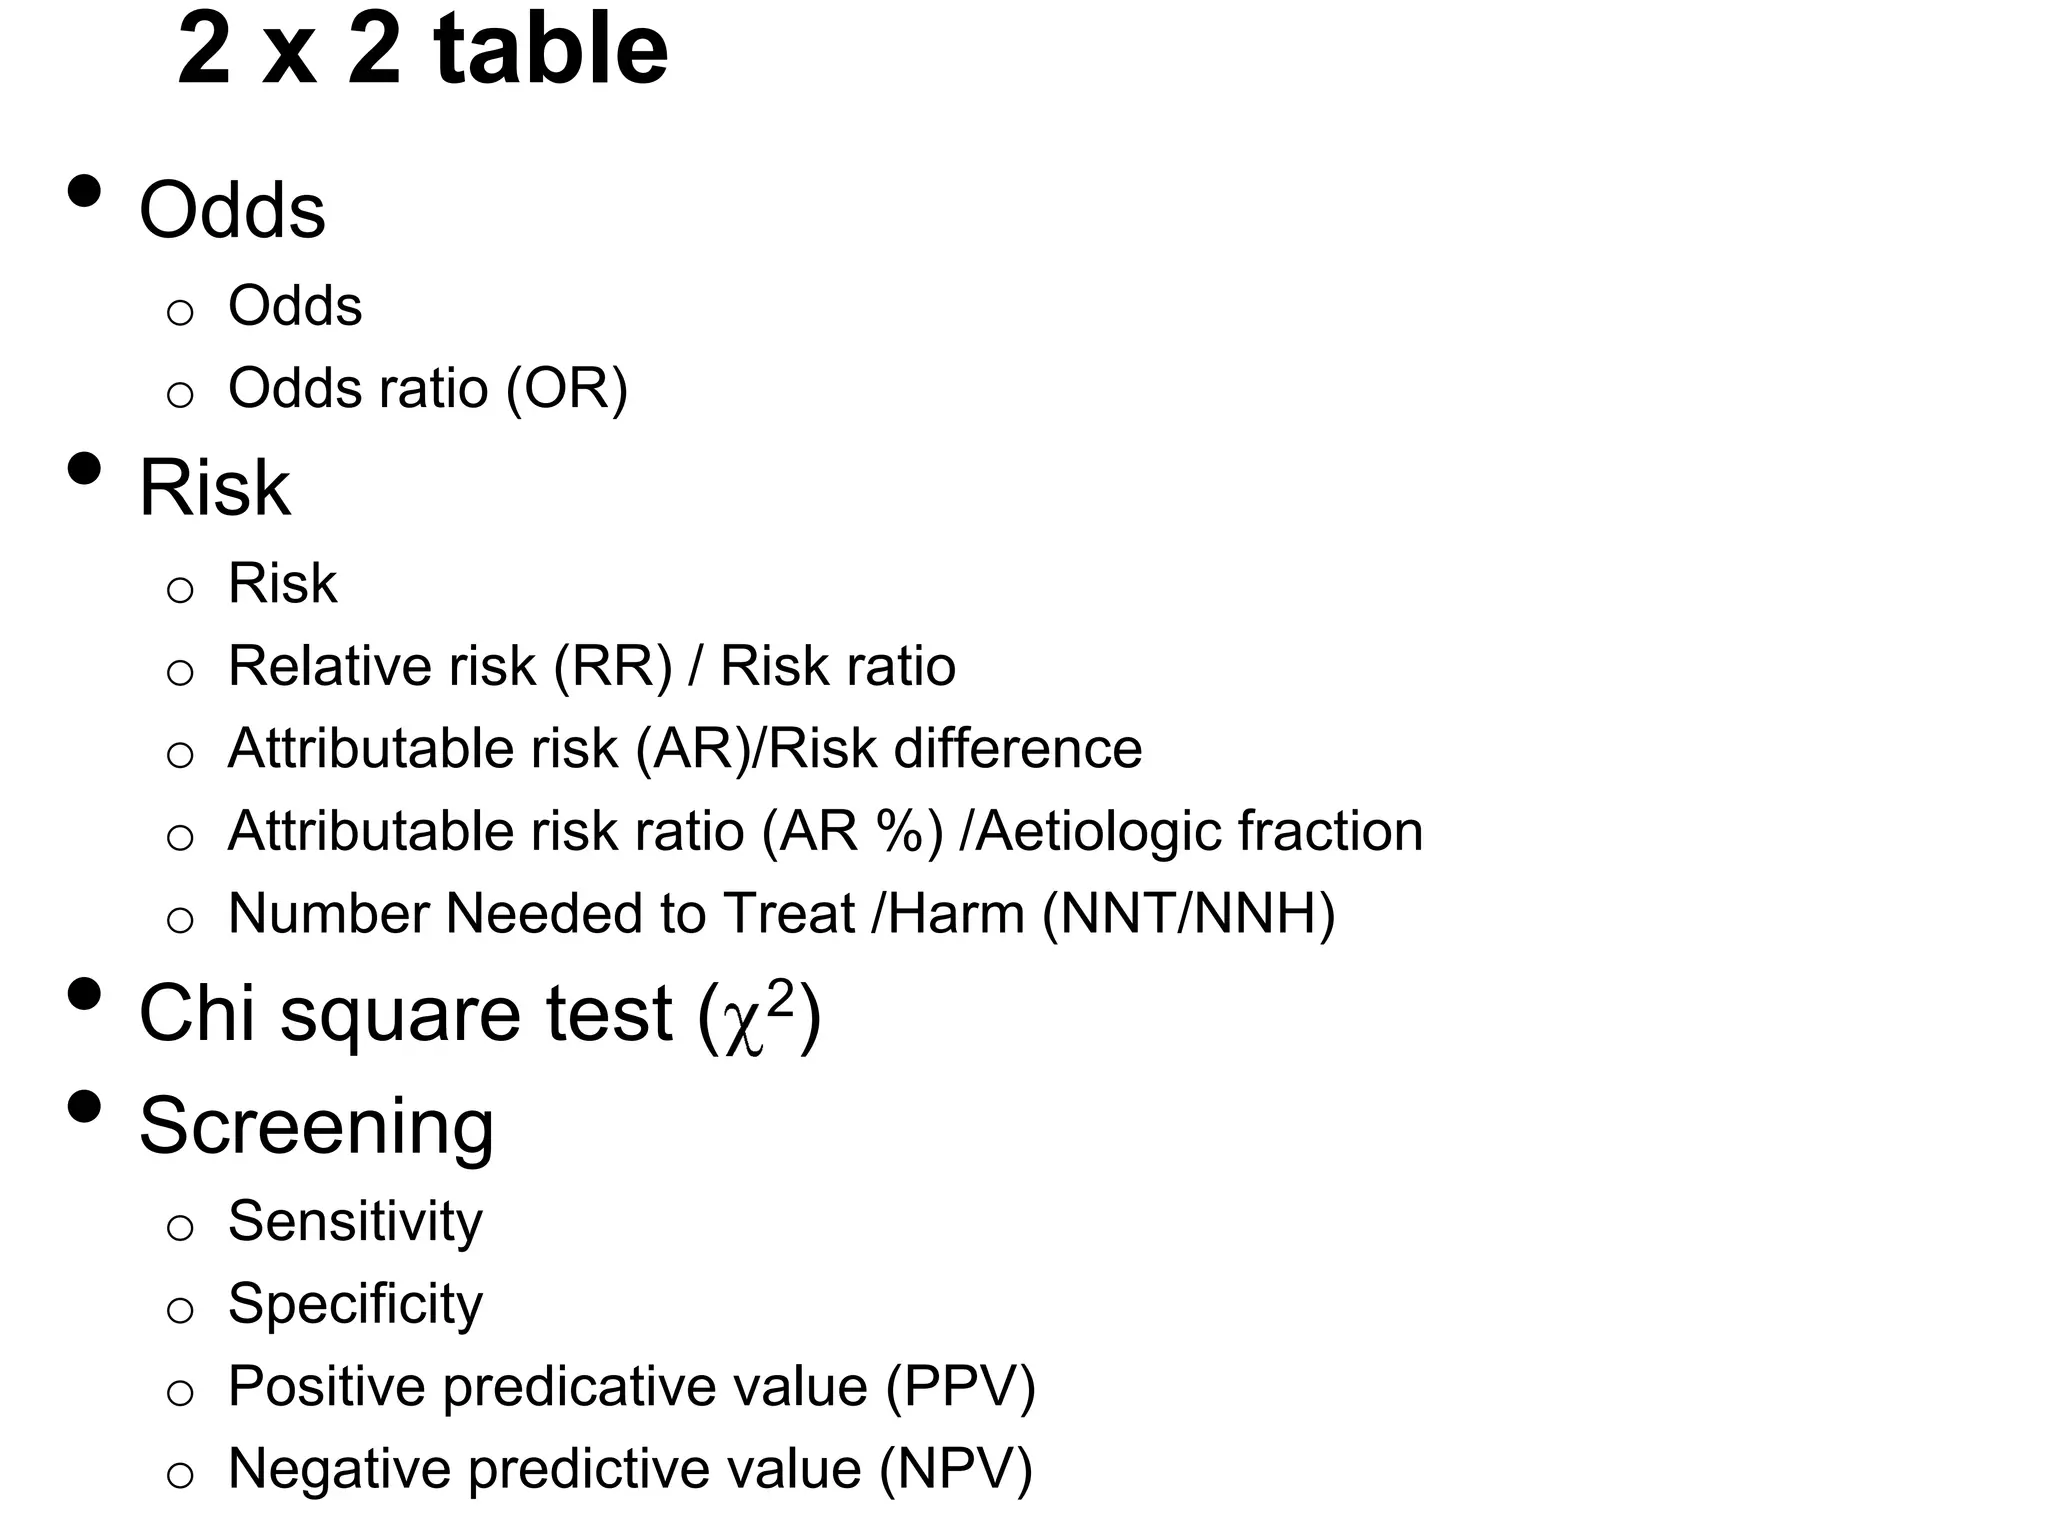
![Risk
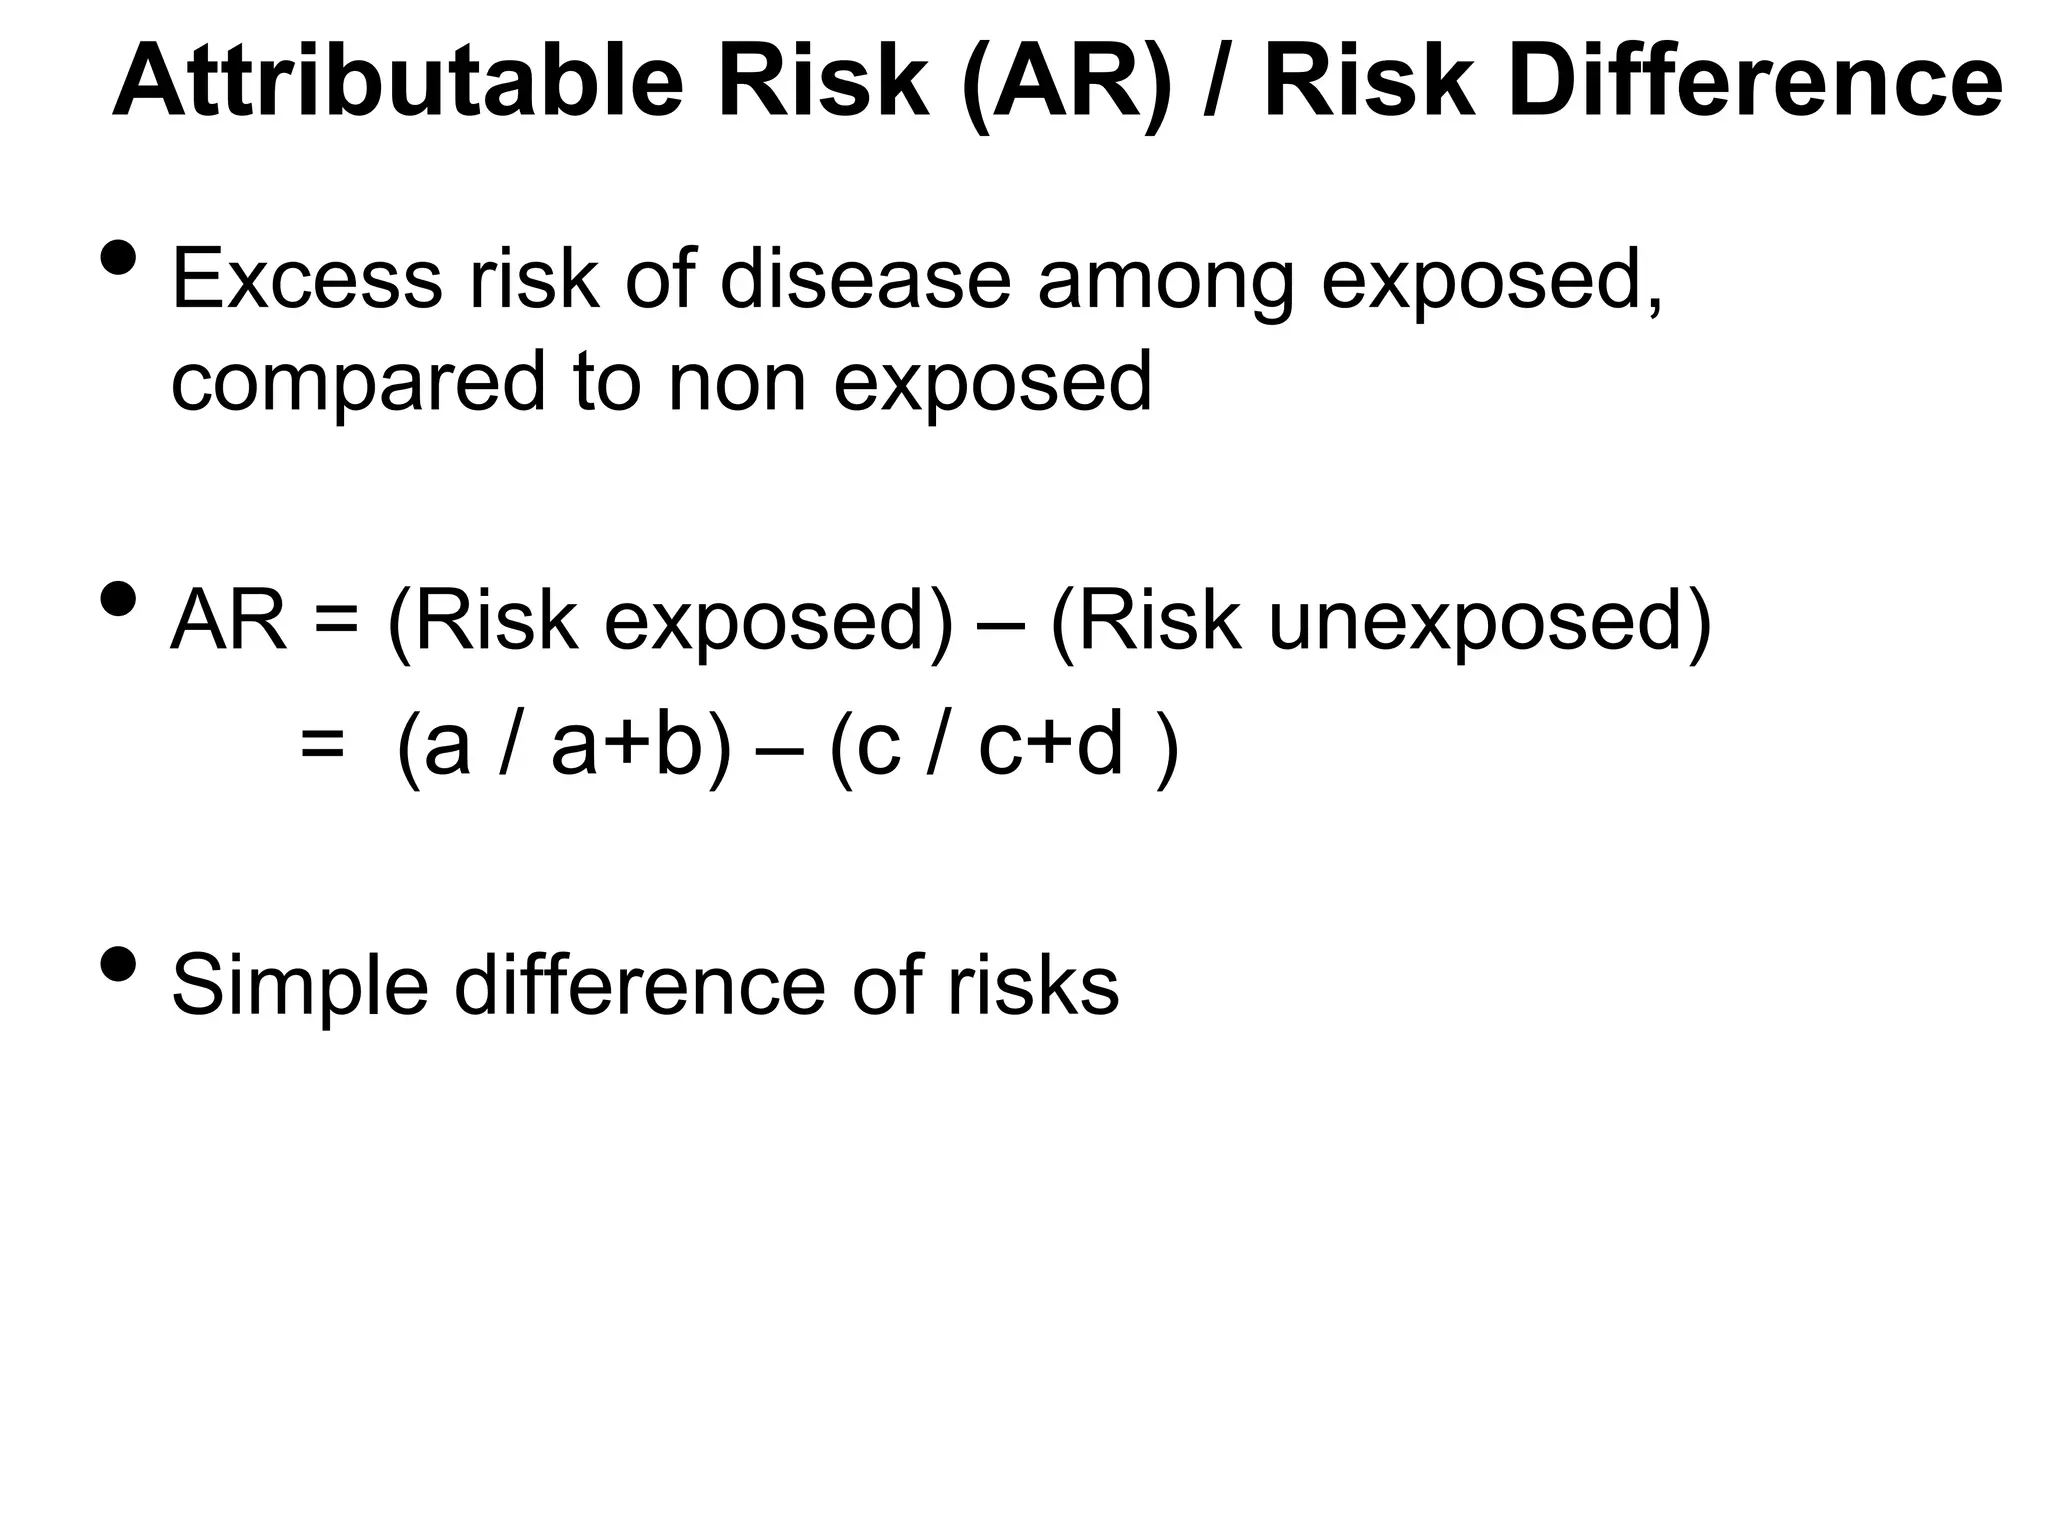
• Risk ( proportion ) =
Diseased / Pop. at risk(Total
exposed) [also known as (Cumulative) Incidence]
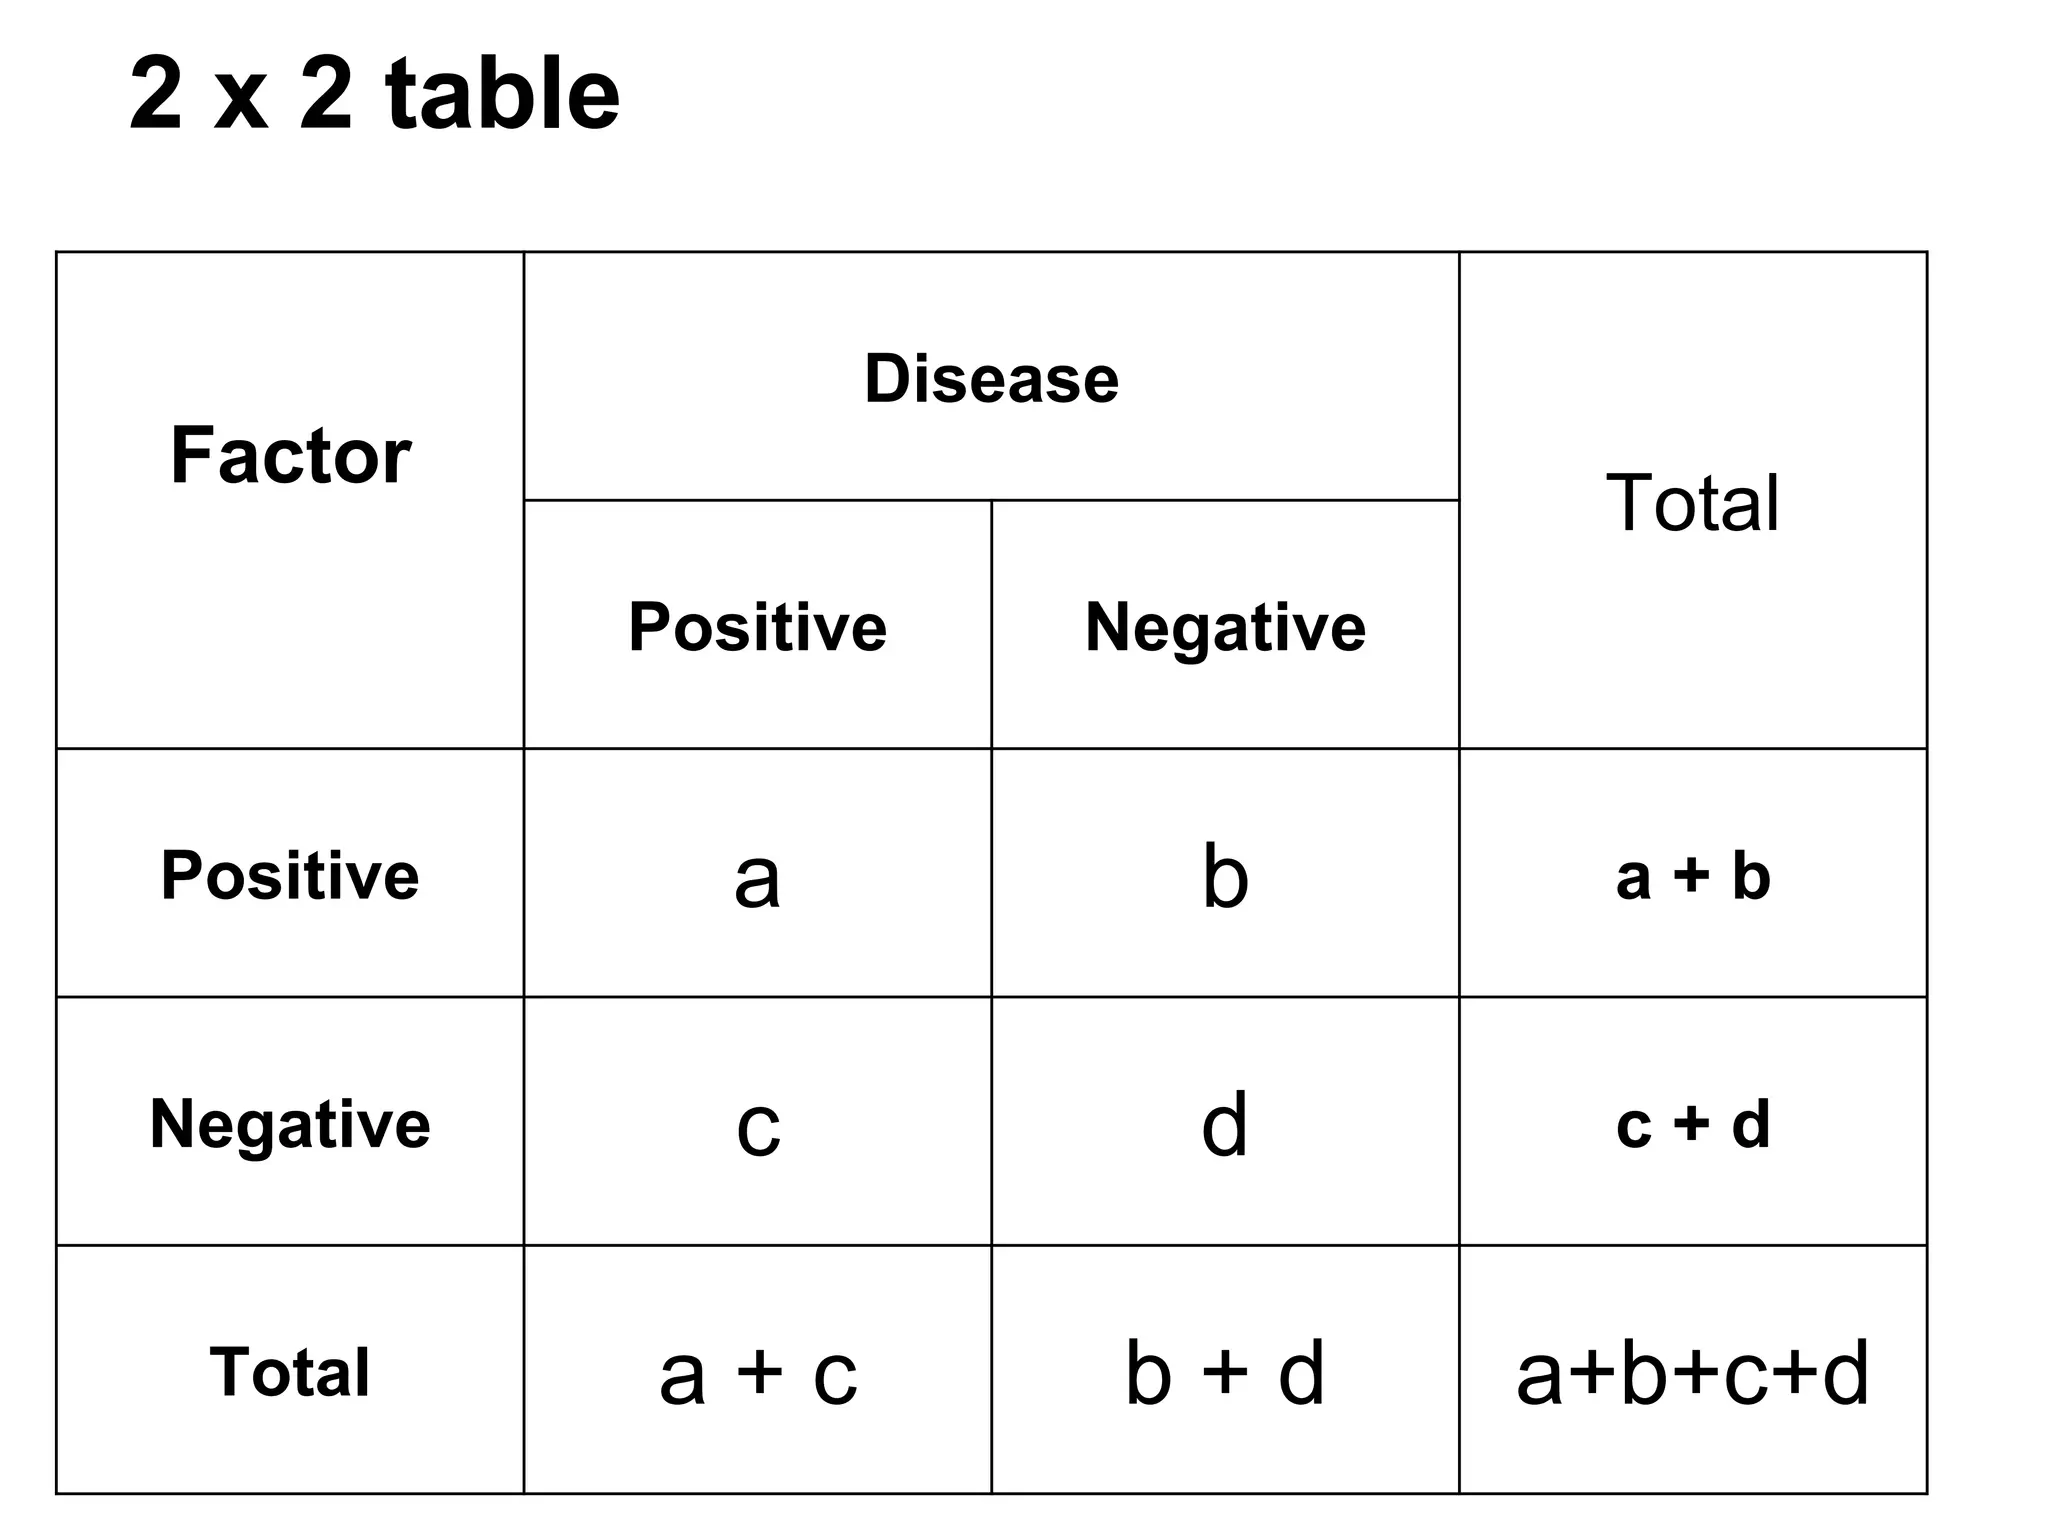
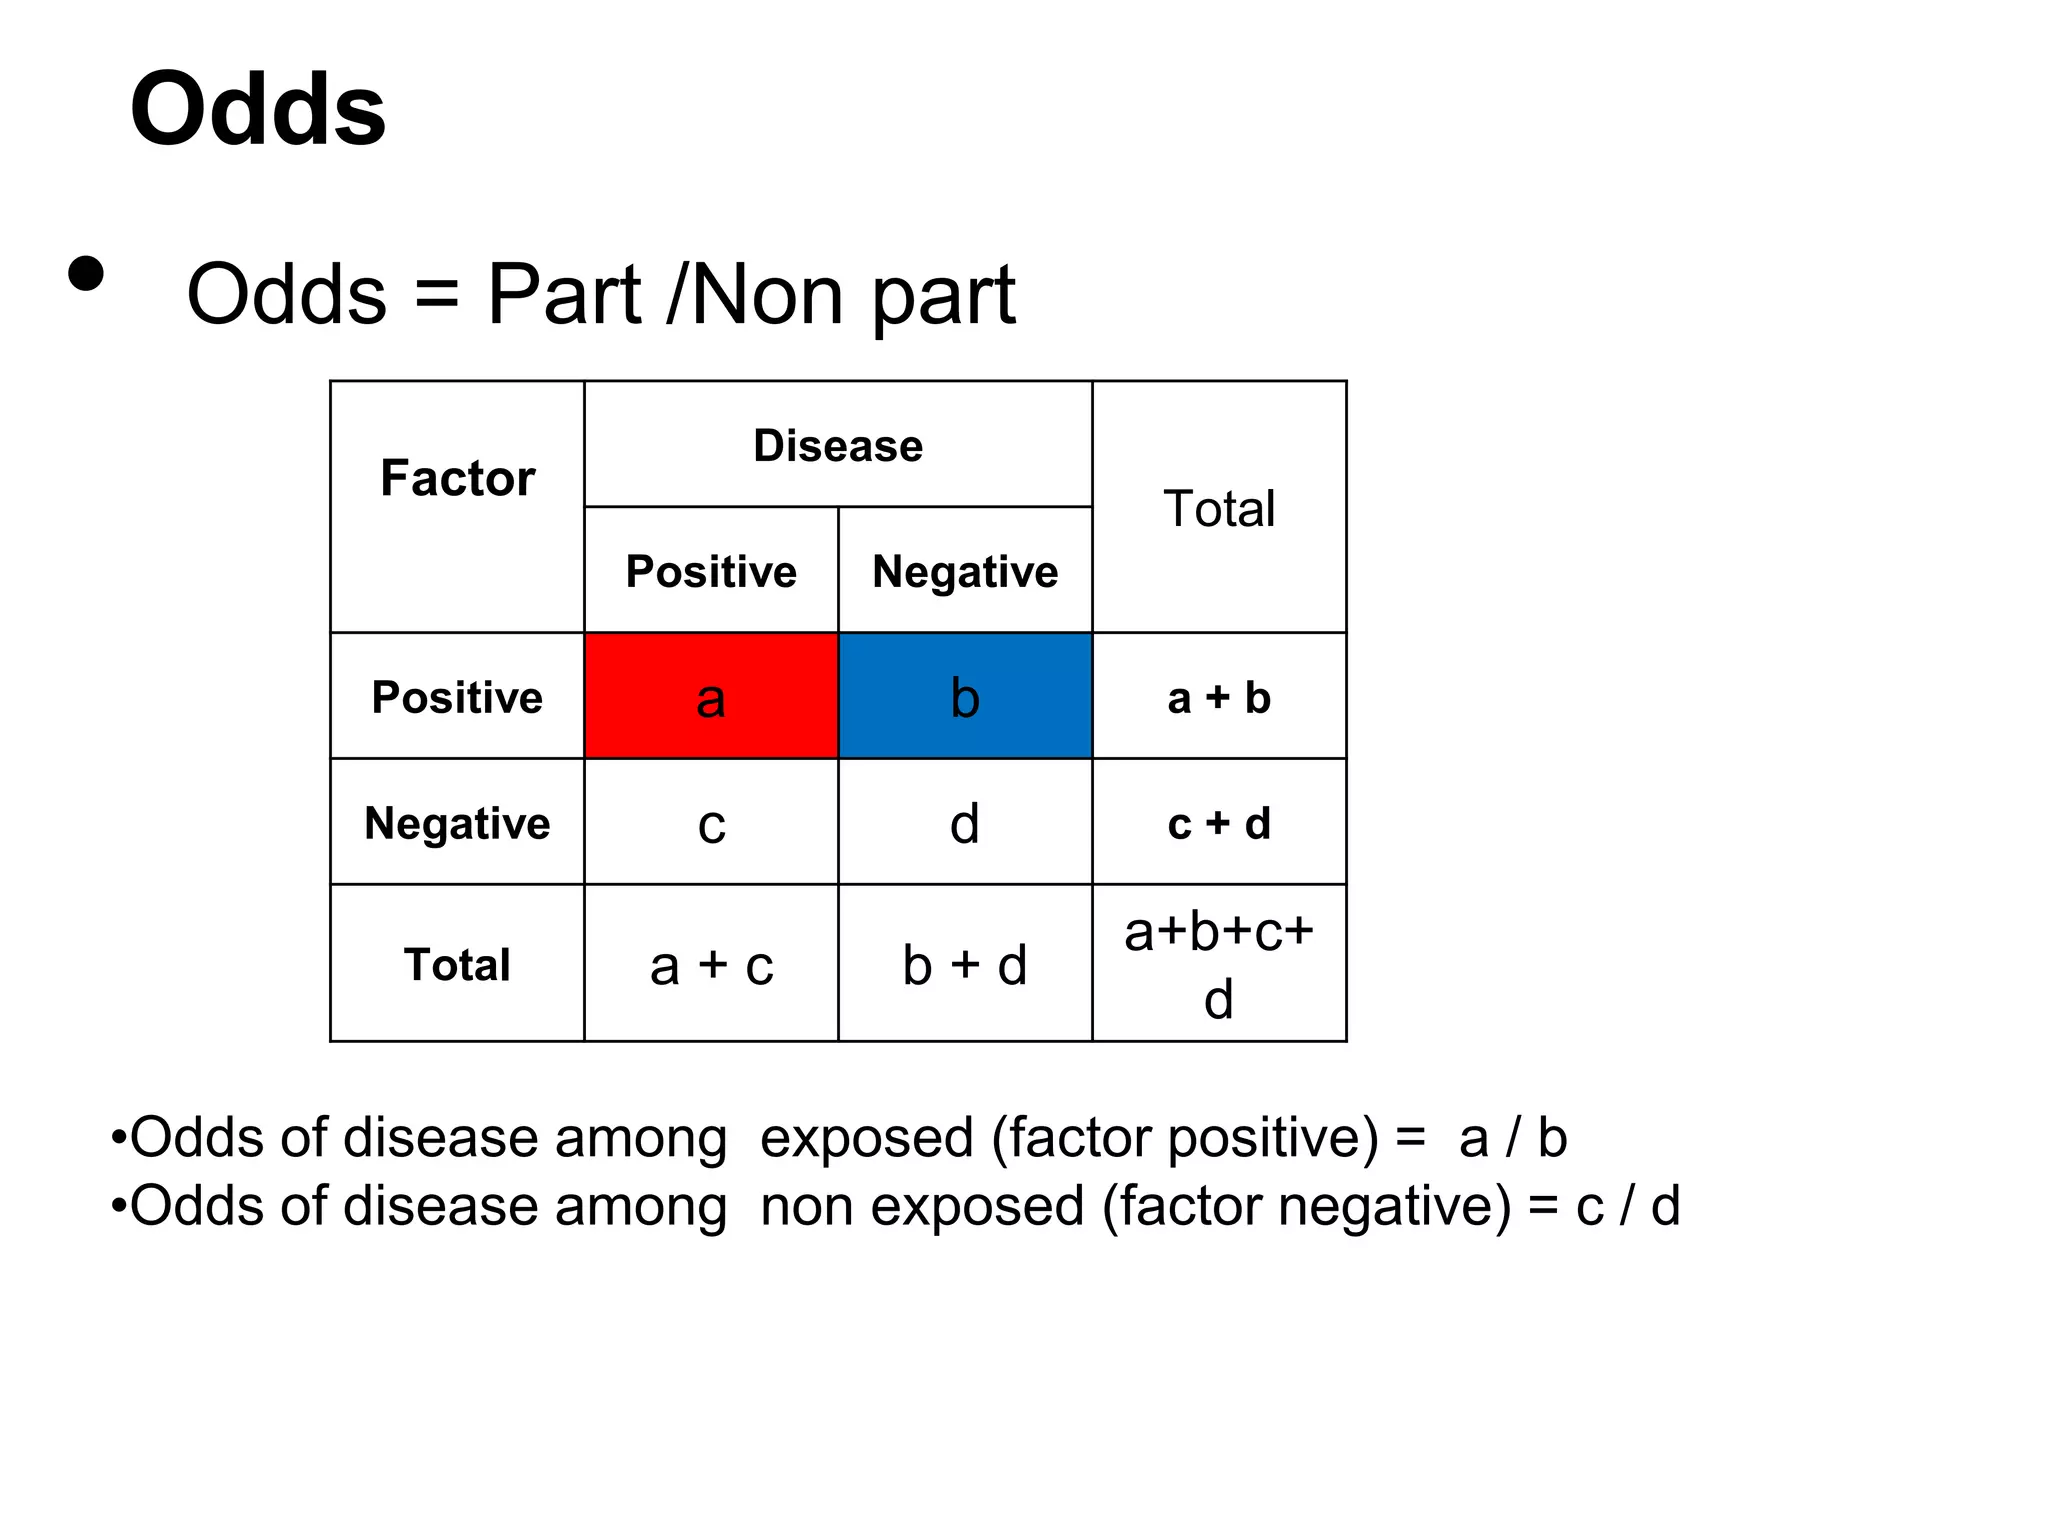
Disease
Factor
Total
Positive
Negative
Positive
a
b
a+b
Negative
c
d
c+d
Total
a+c
b+d
a+b+c+d
•Risk of disease among exposed (factor positive) = a / a+b
•Risk of disease among non exposed (factor negative) = c / c+d
Estimated risk/ Average risk](https://image.slidesharecdn.com/mdpaedpresentation6-131223222353-phpapp01/75/MD-Paediatricts-Part-2-Epidemiology-and-Statistics-16-2048.jpg)
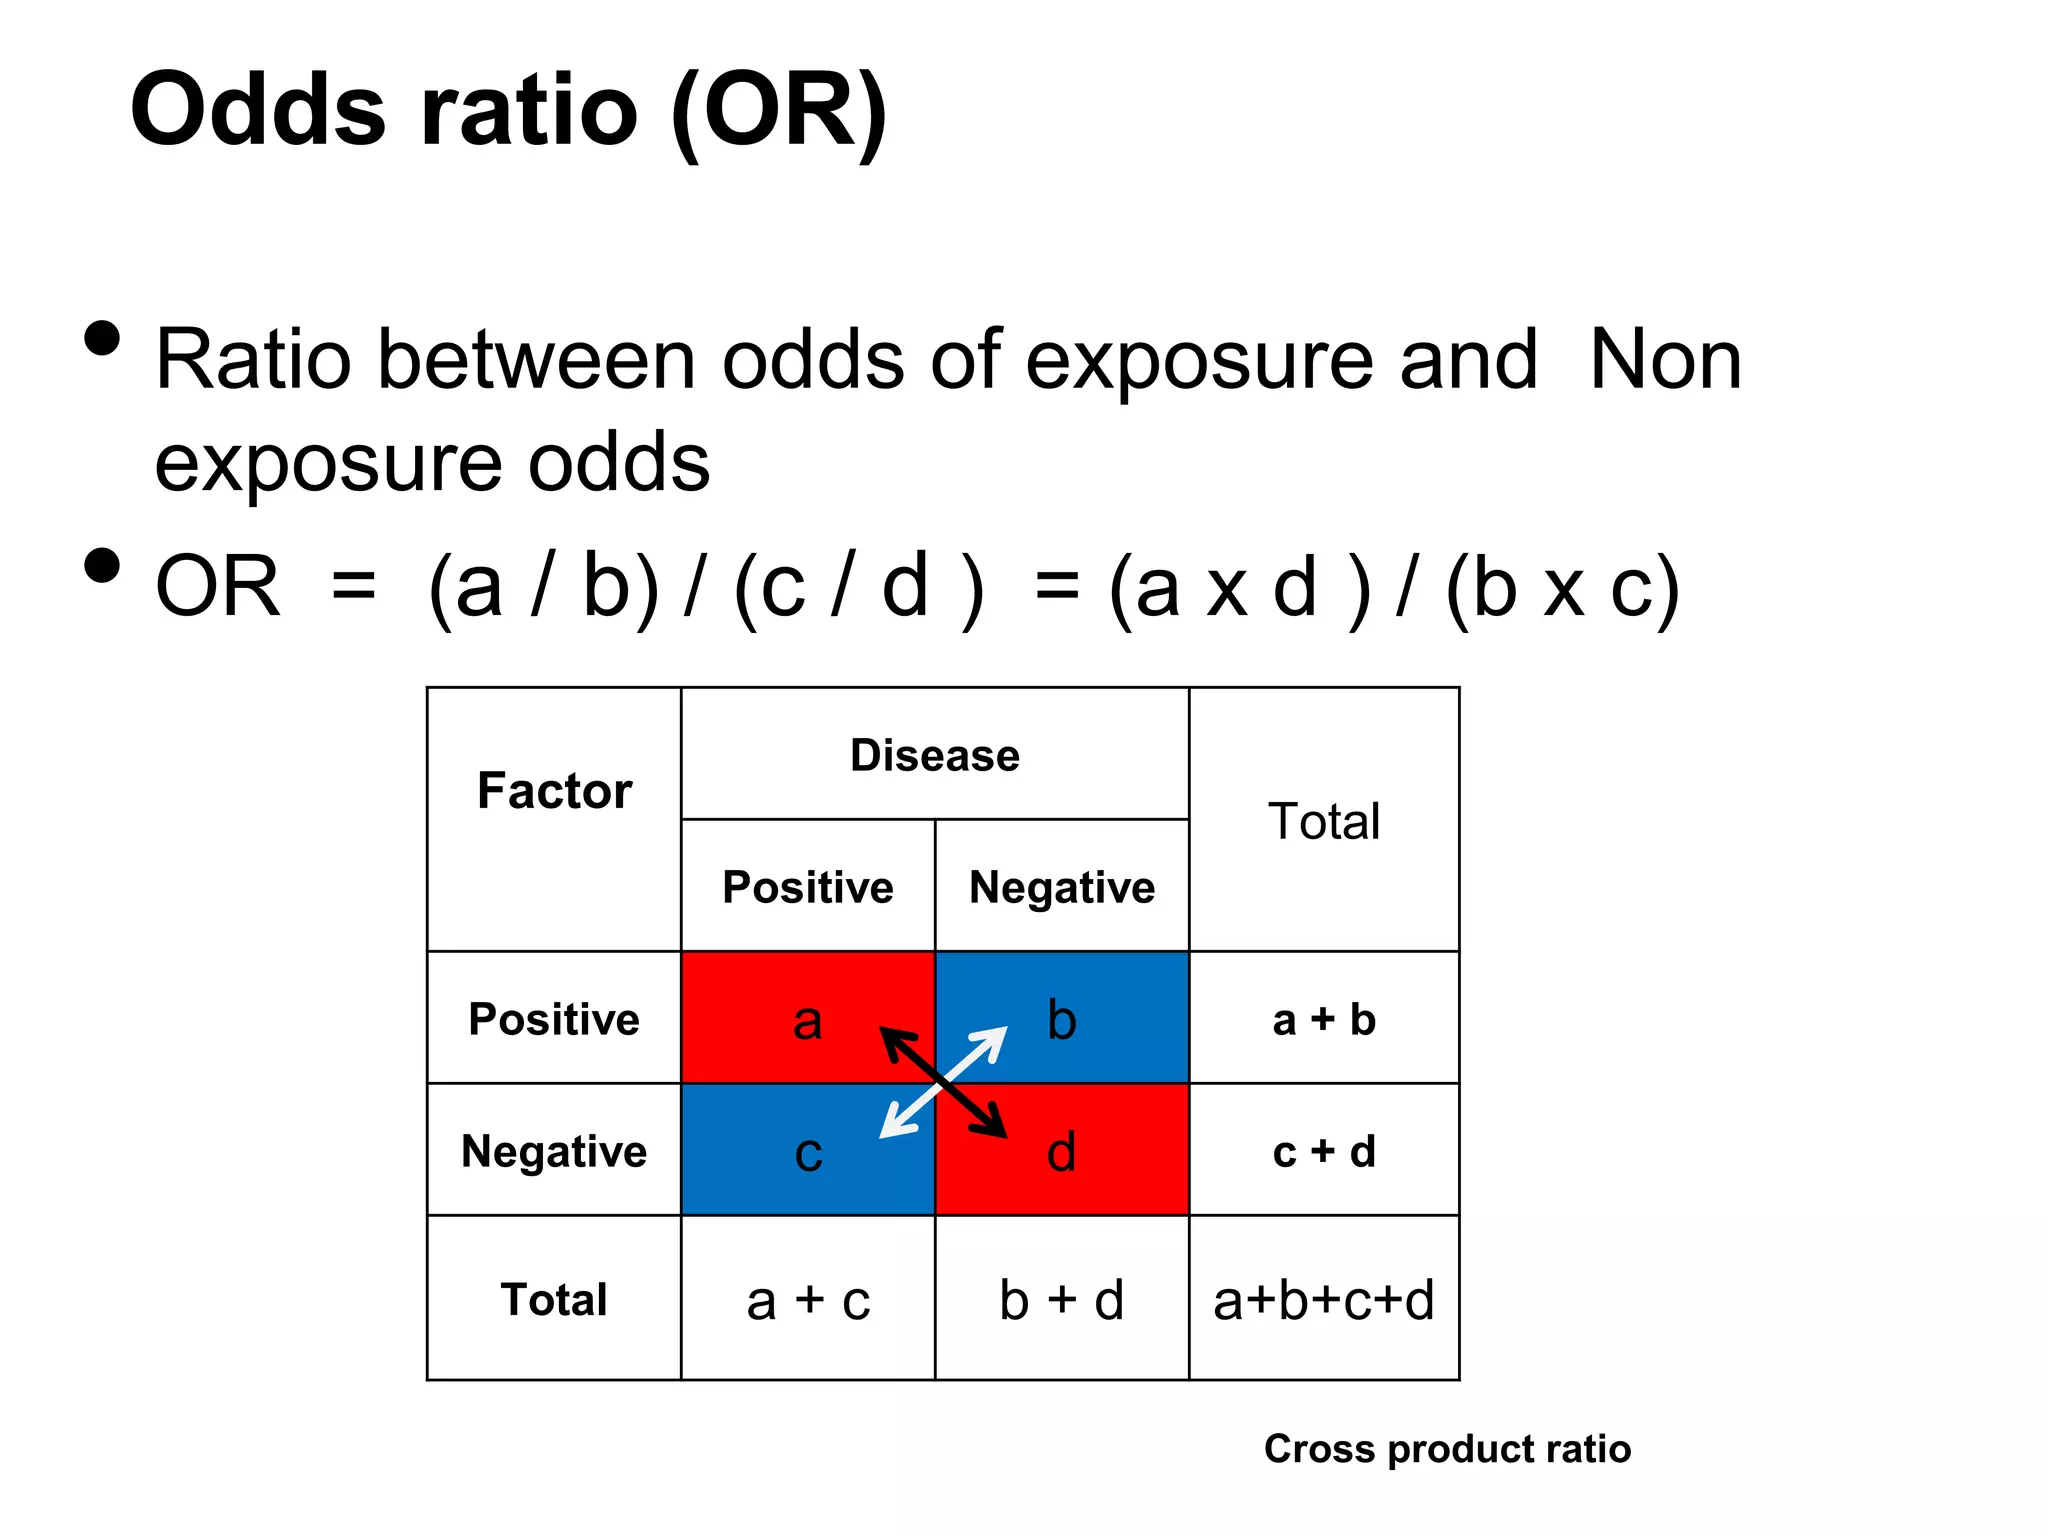
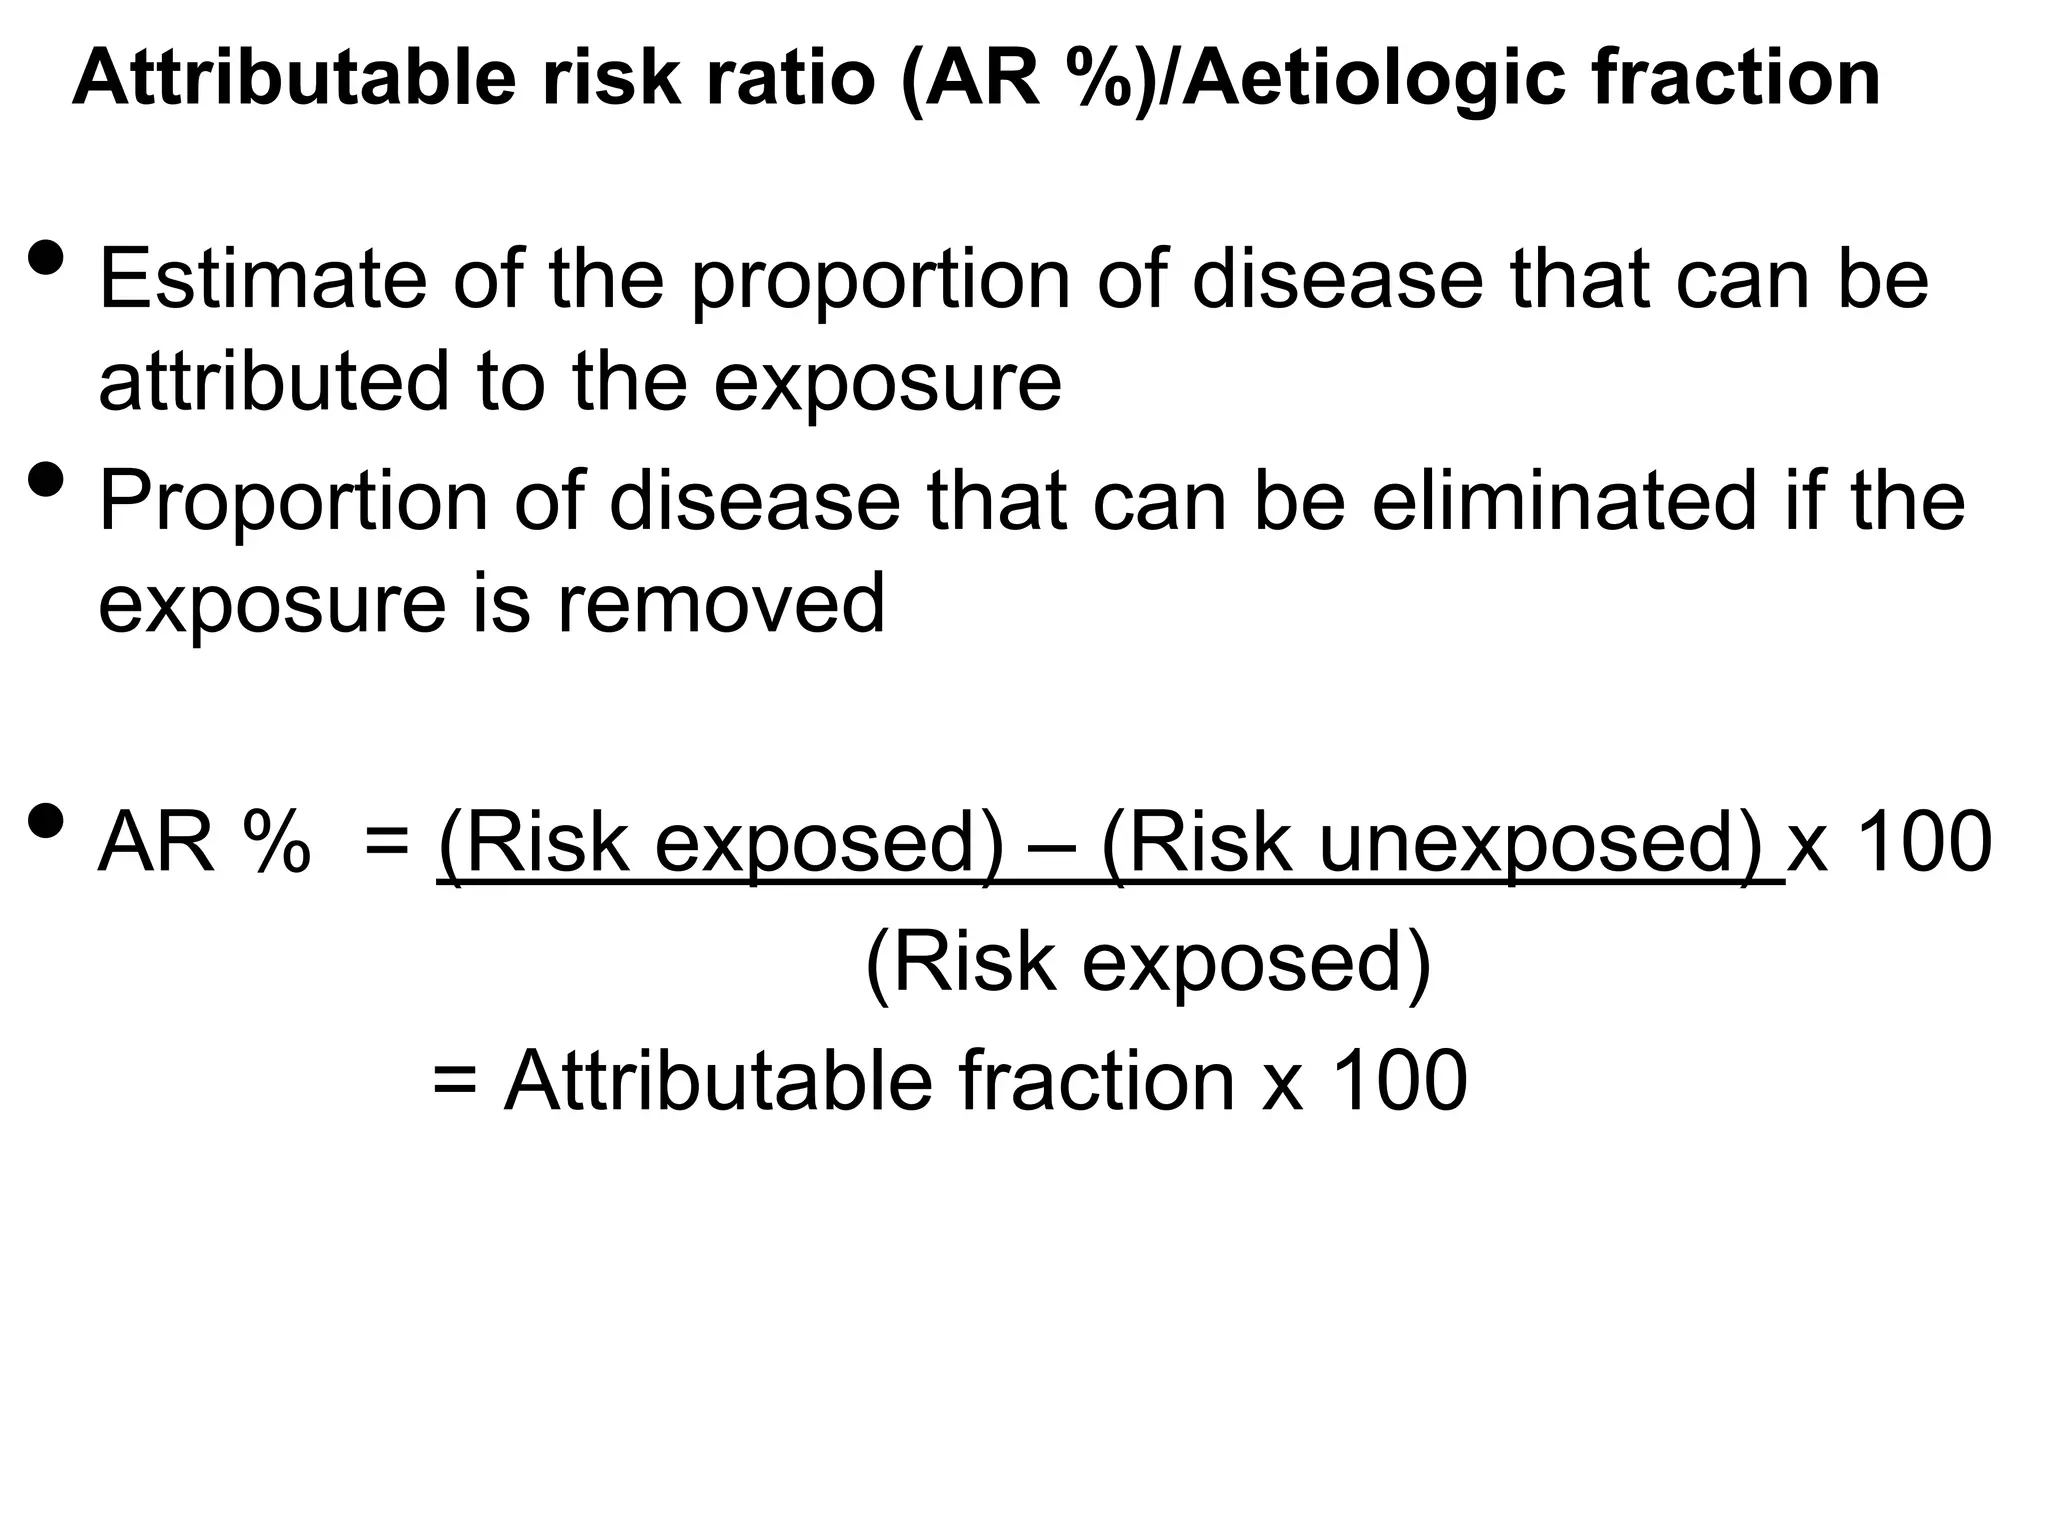
![Risk Ratio / Relative Risk - RR
• Ratio between risks of exposure and
•
Non
exposure risks for the disease
RR = [a /(a+b) ] / [c /(c+d) ]
Disease
Factor
Total
Positive
Negative
Positive
a
b
a+b
Negative
c
d
c+d
Total
a+c
b+d
a+b+c+d
Remember OR ??](https://image.slidesharecdn.com/mdpaedpresentation6-131223222353-phpapp01/75/MD-Paediatricts-Part-2-Epidemiology-and-Statistics-17-2048.jpg)

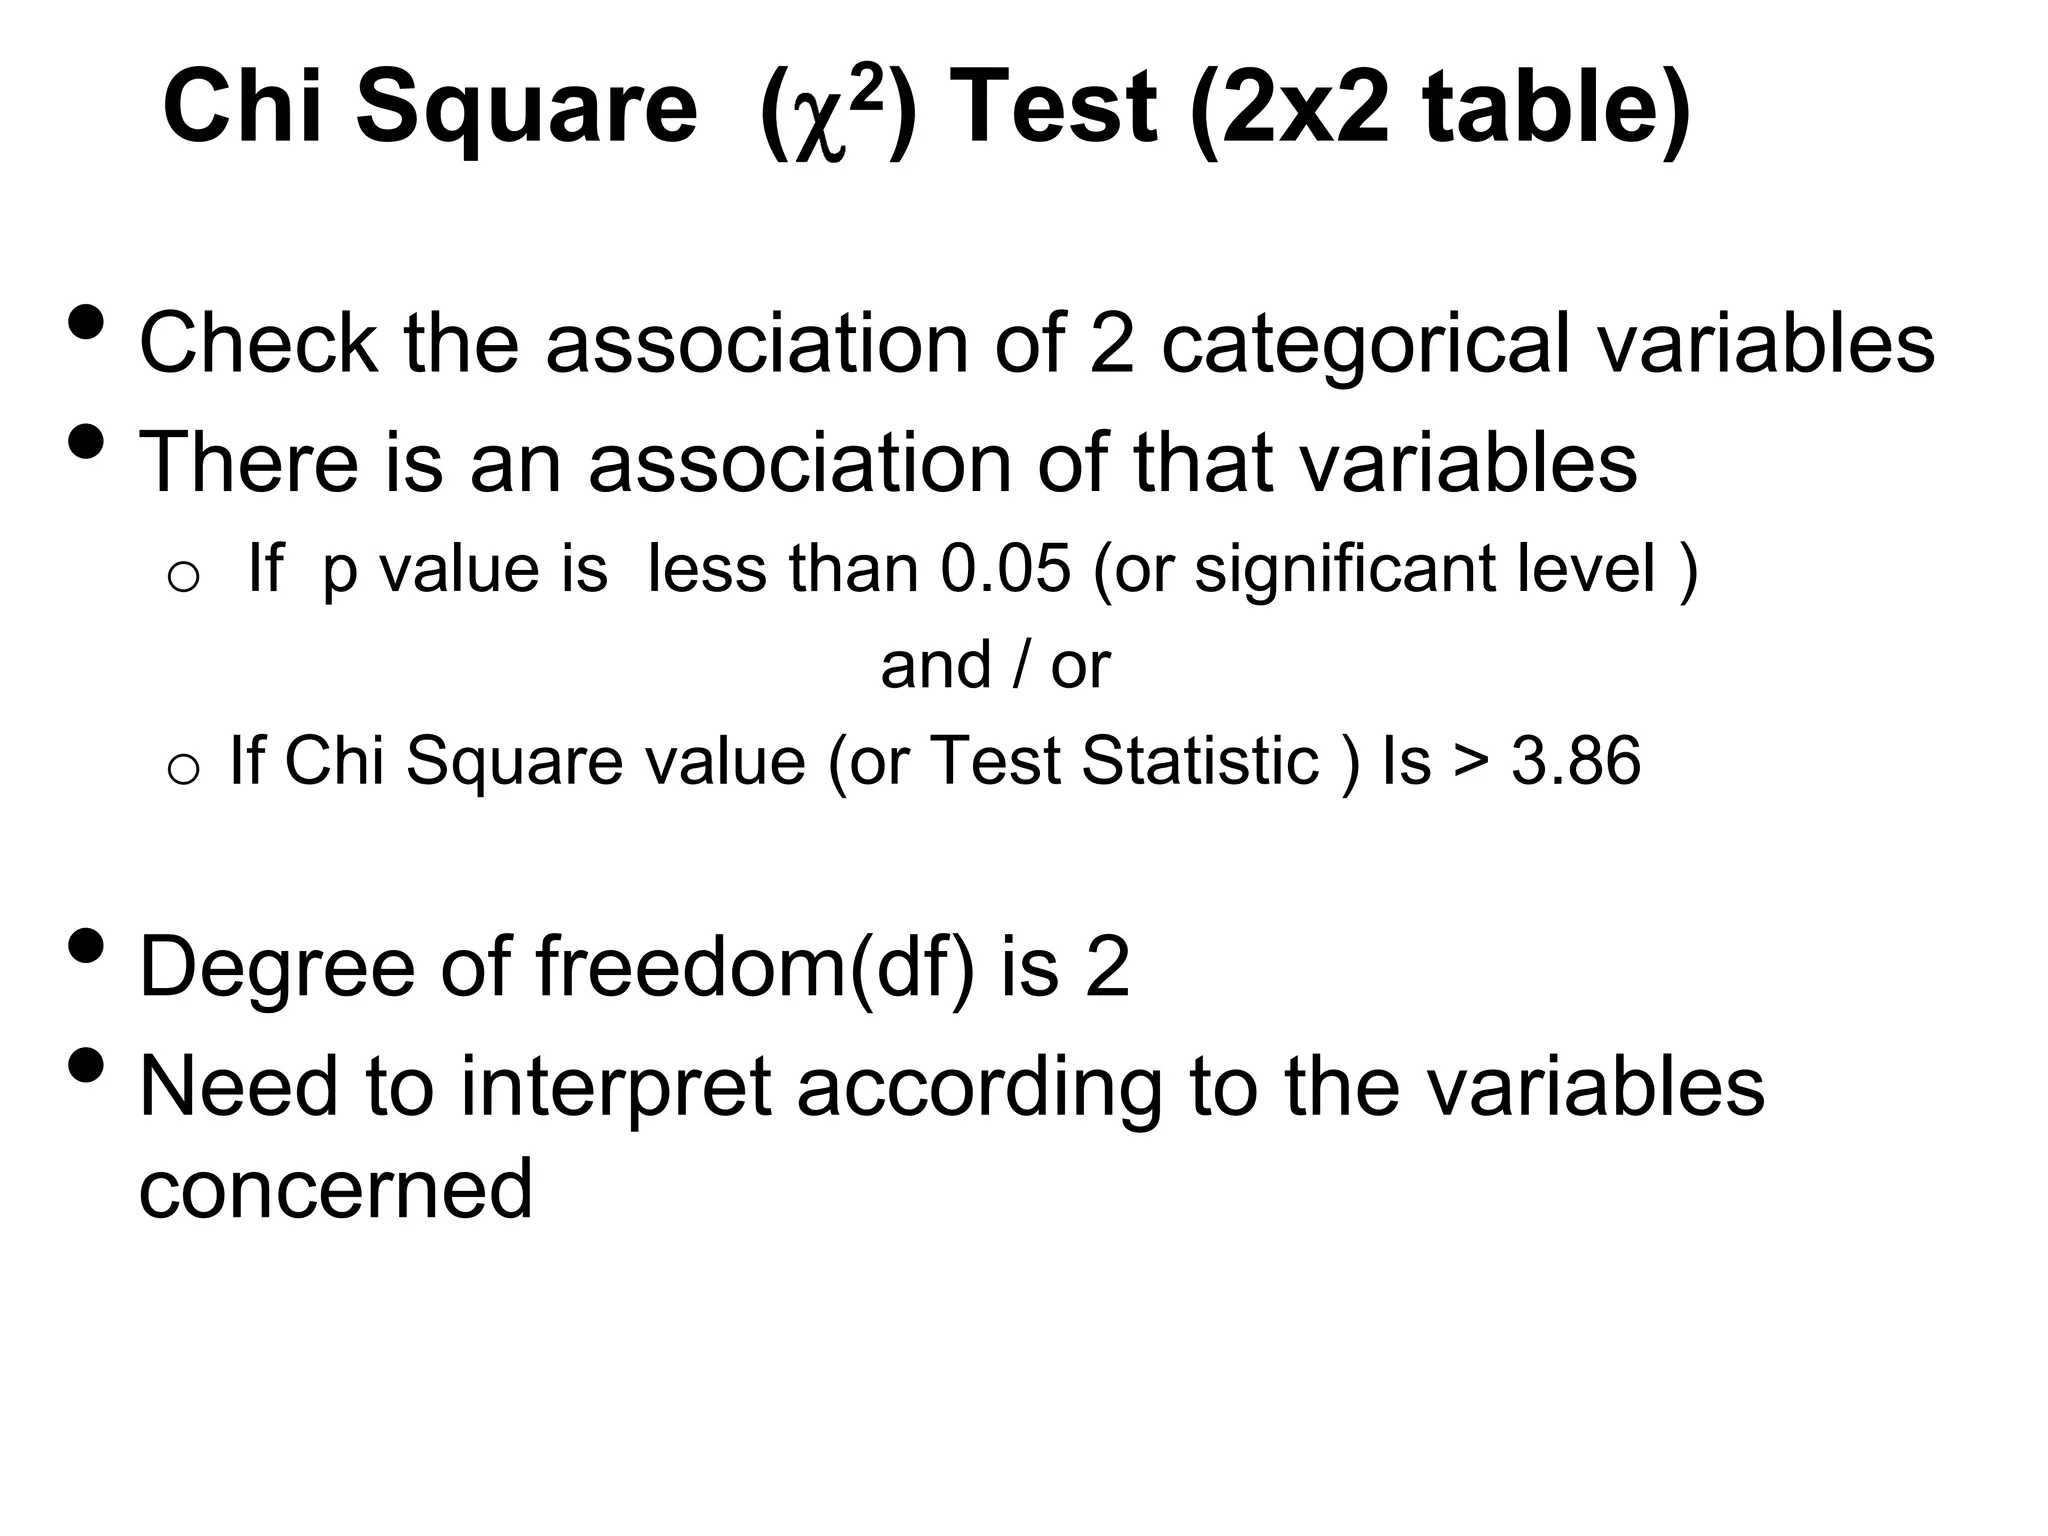


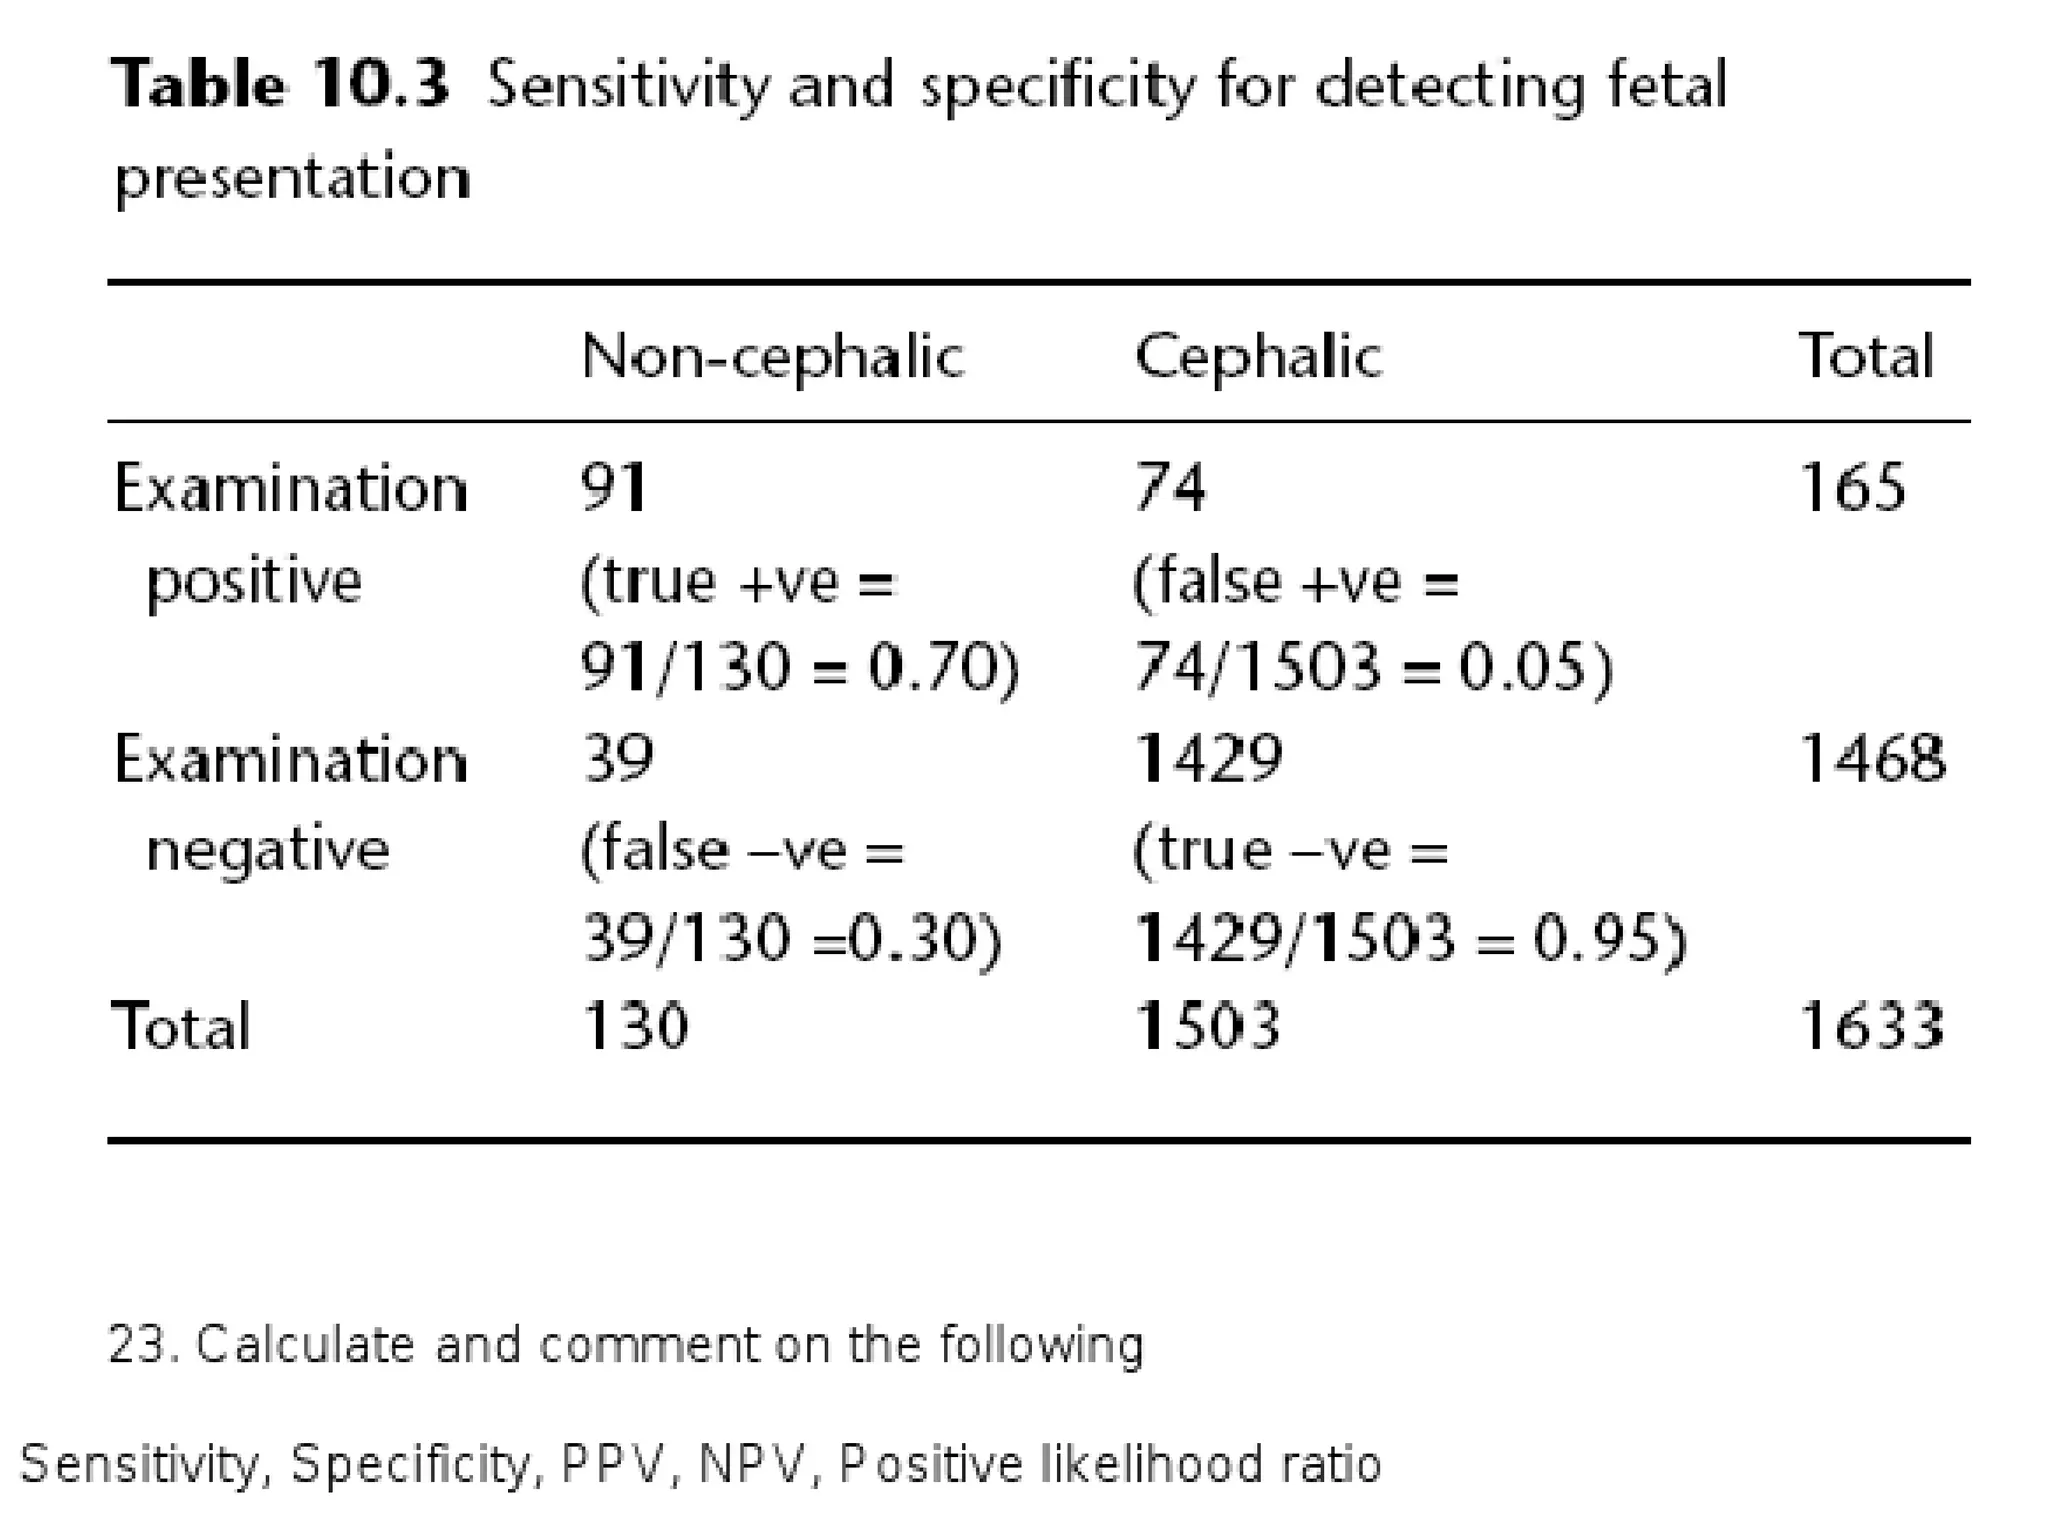
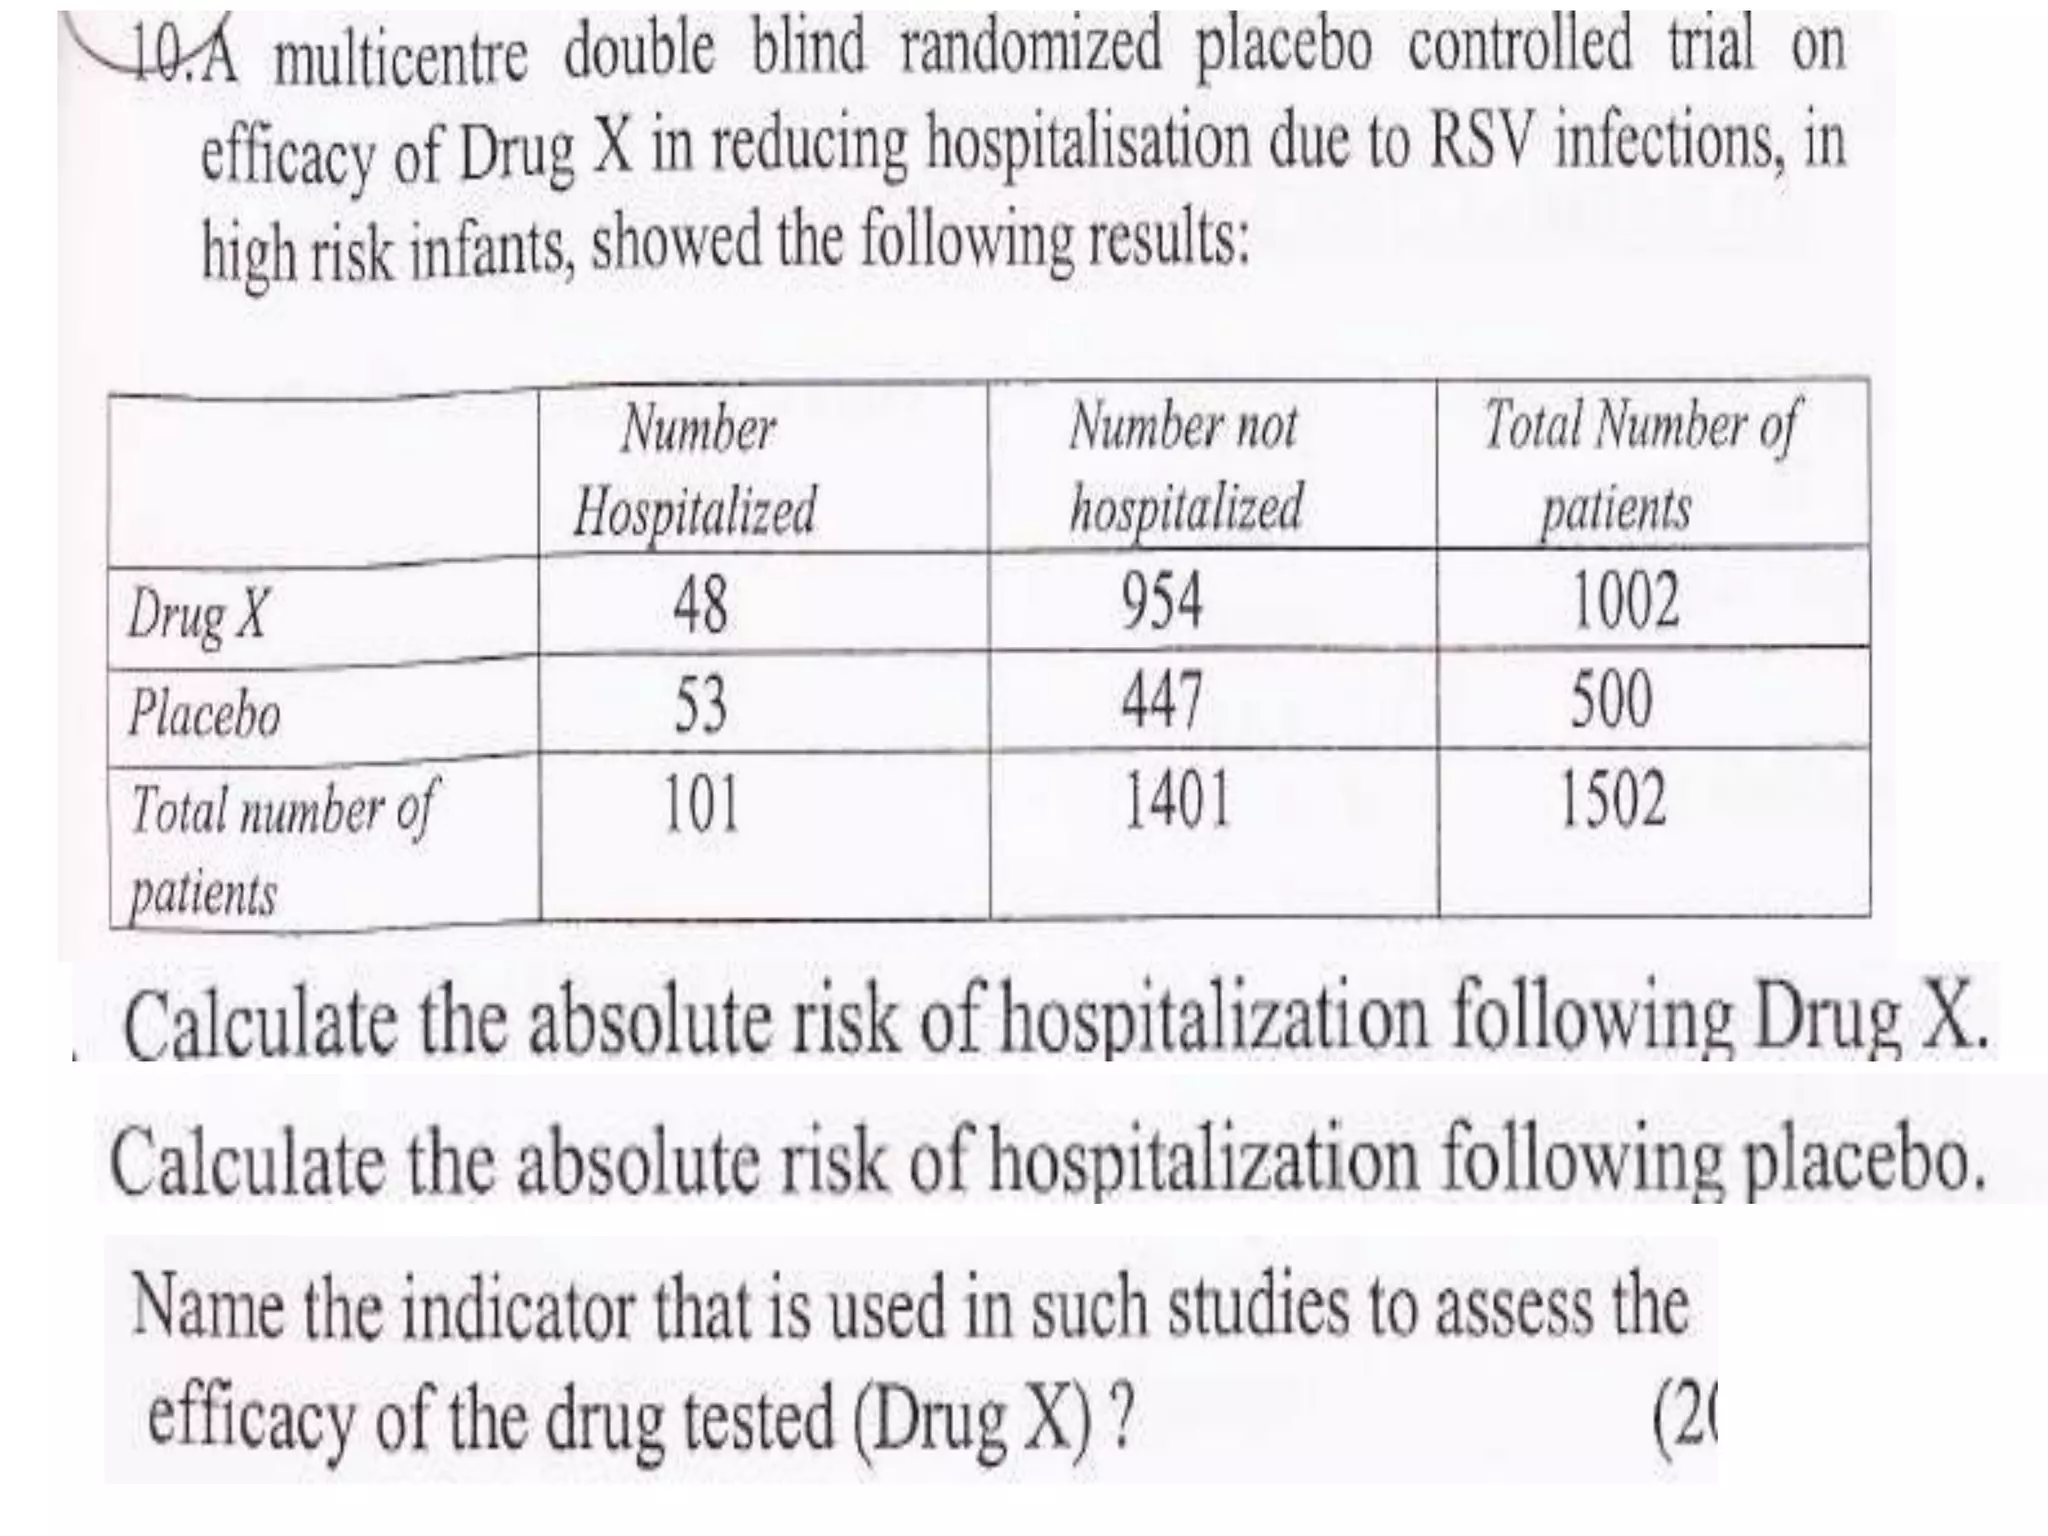
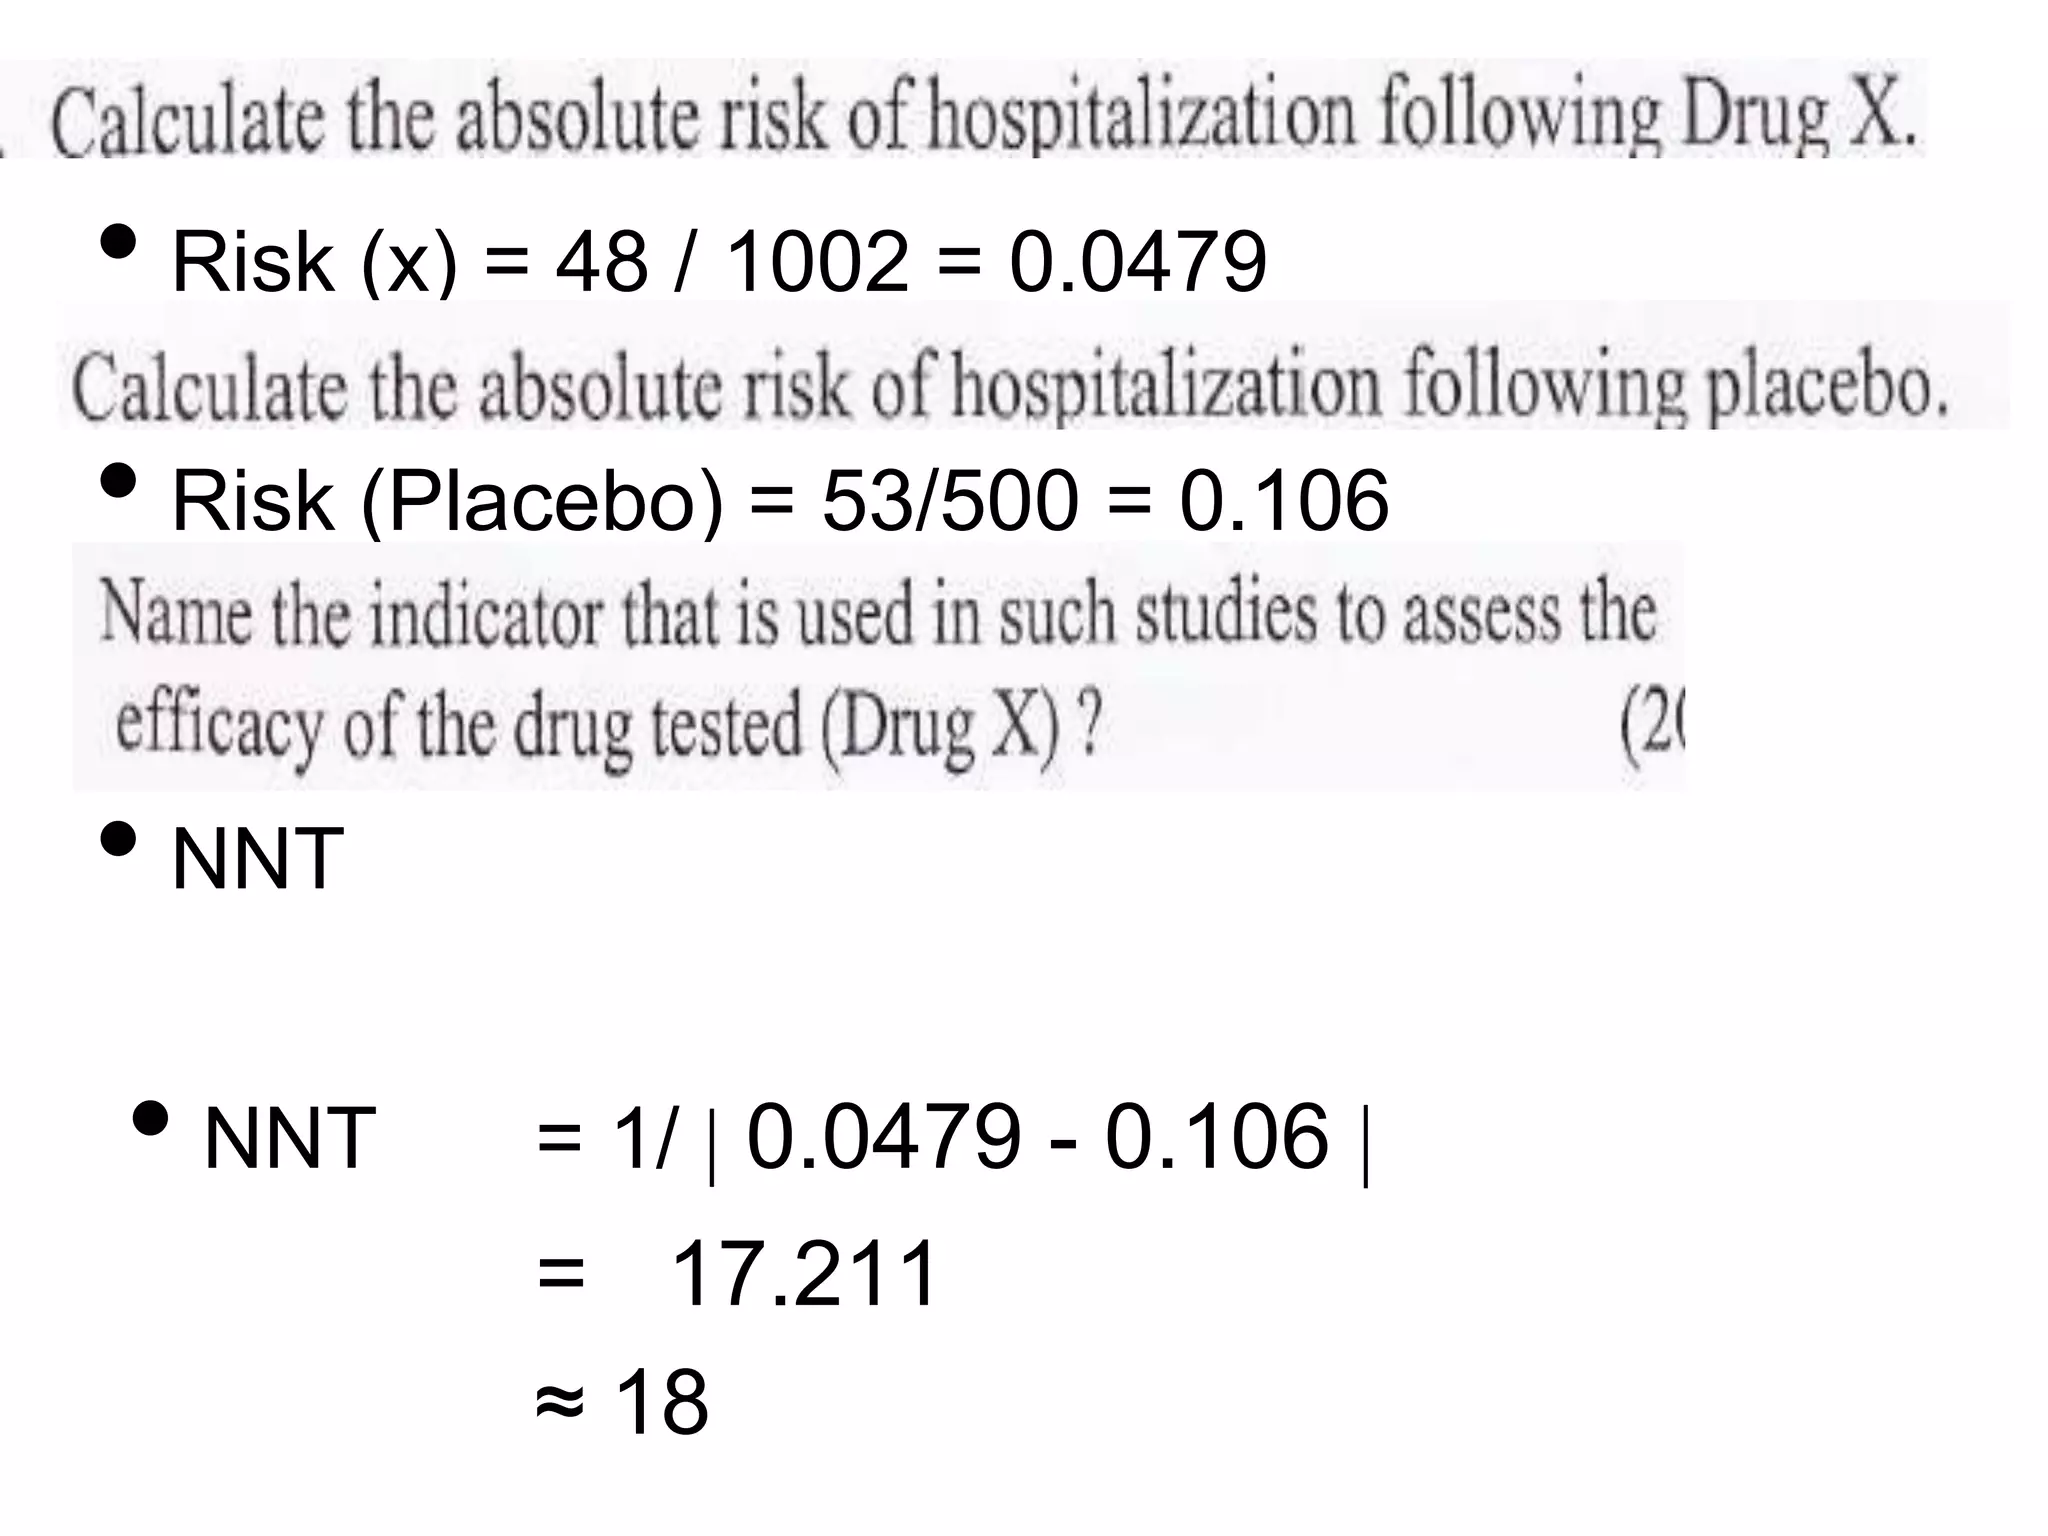


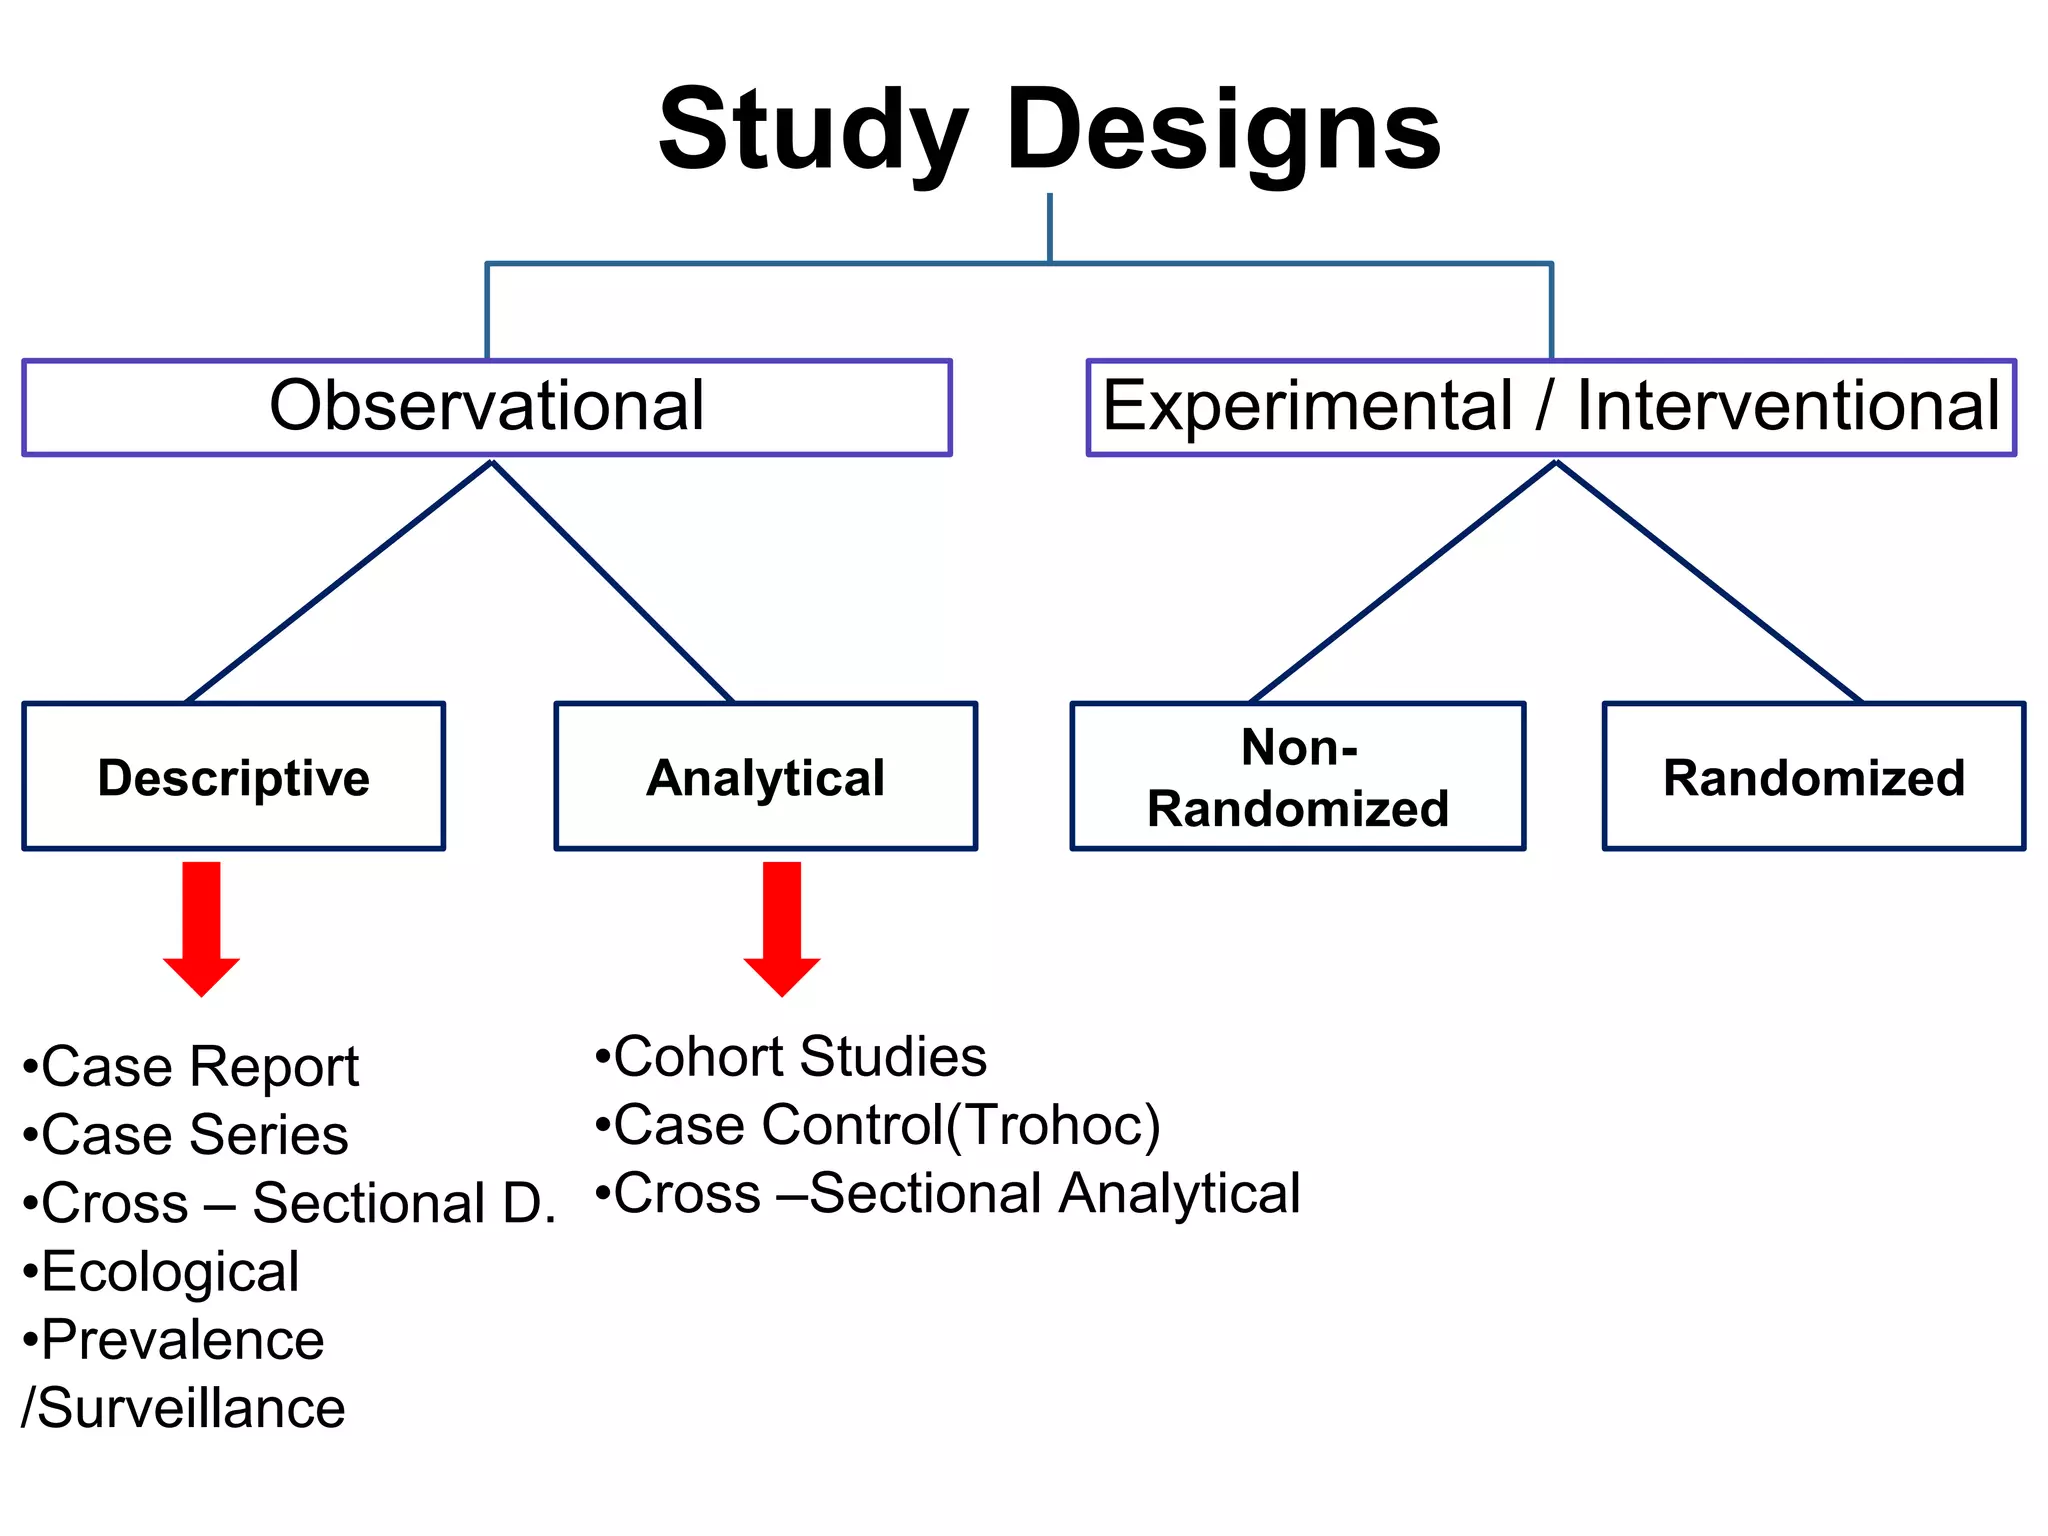
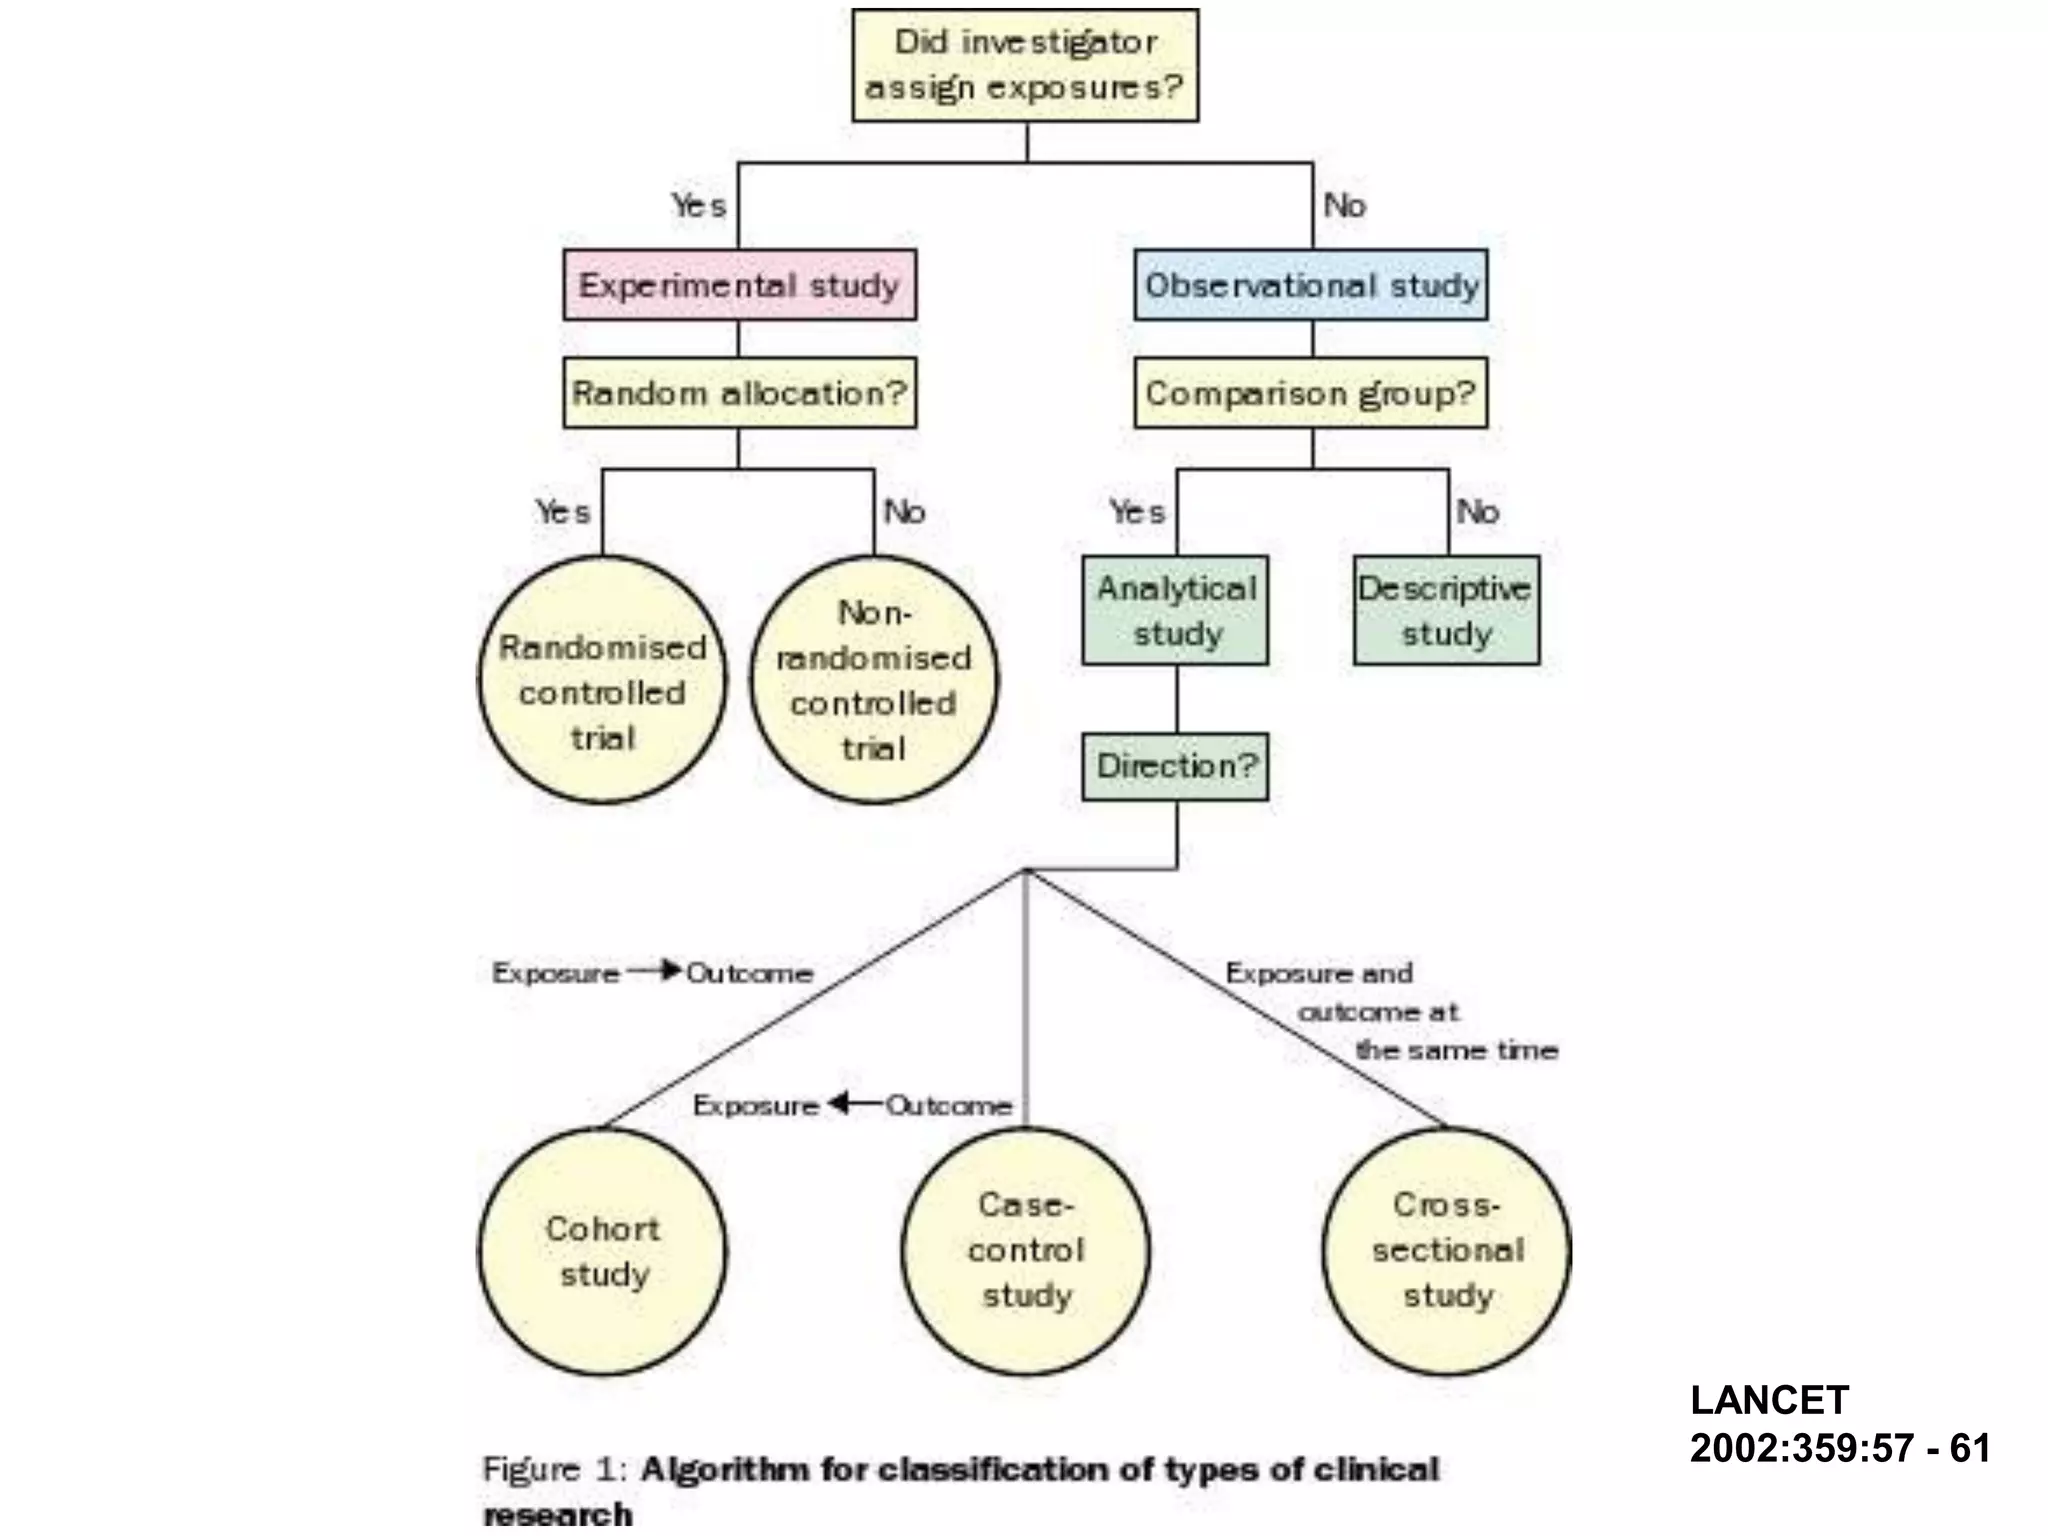
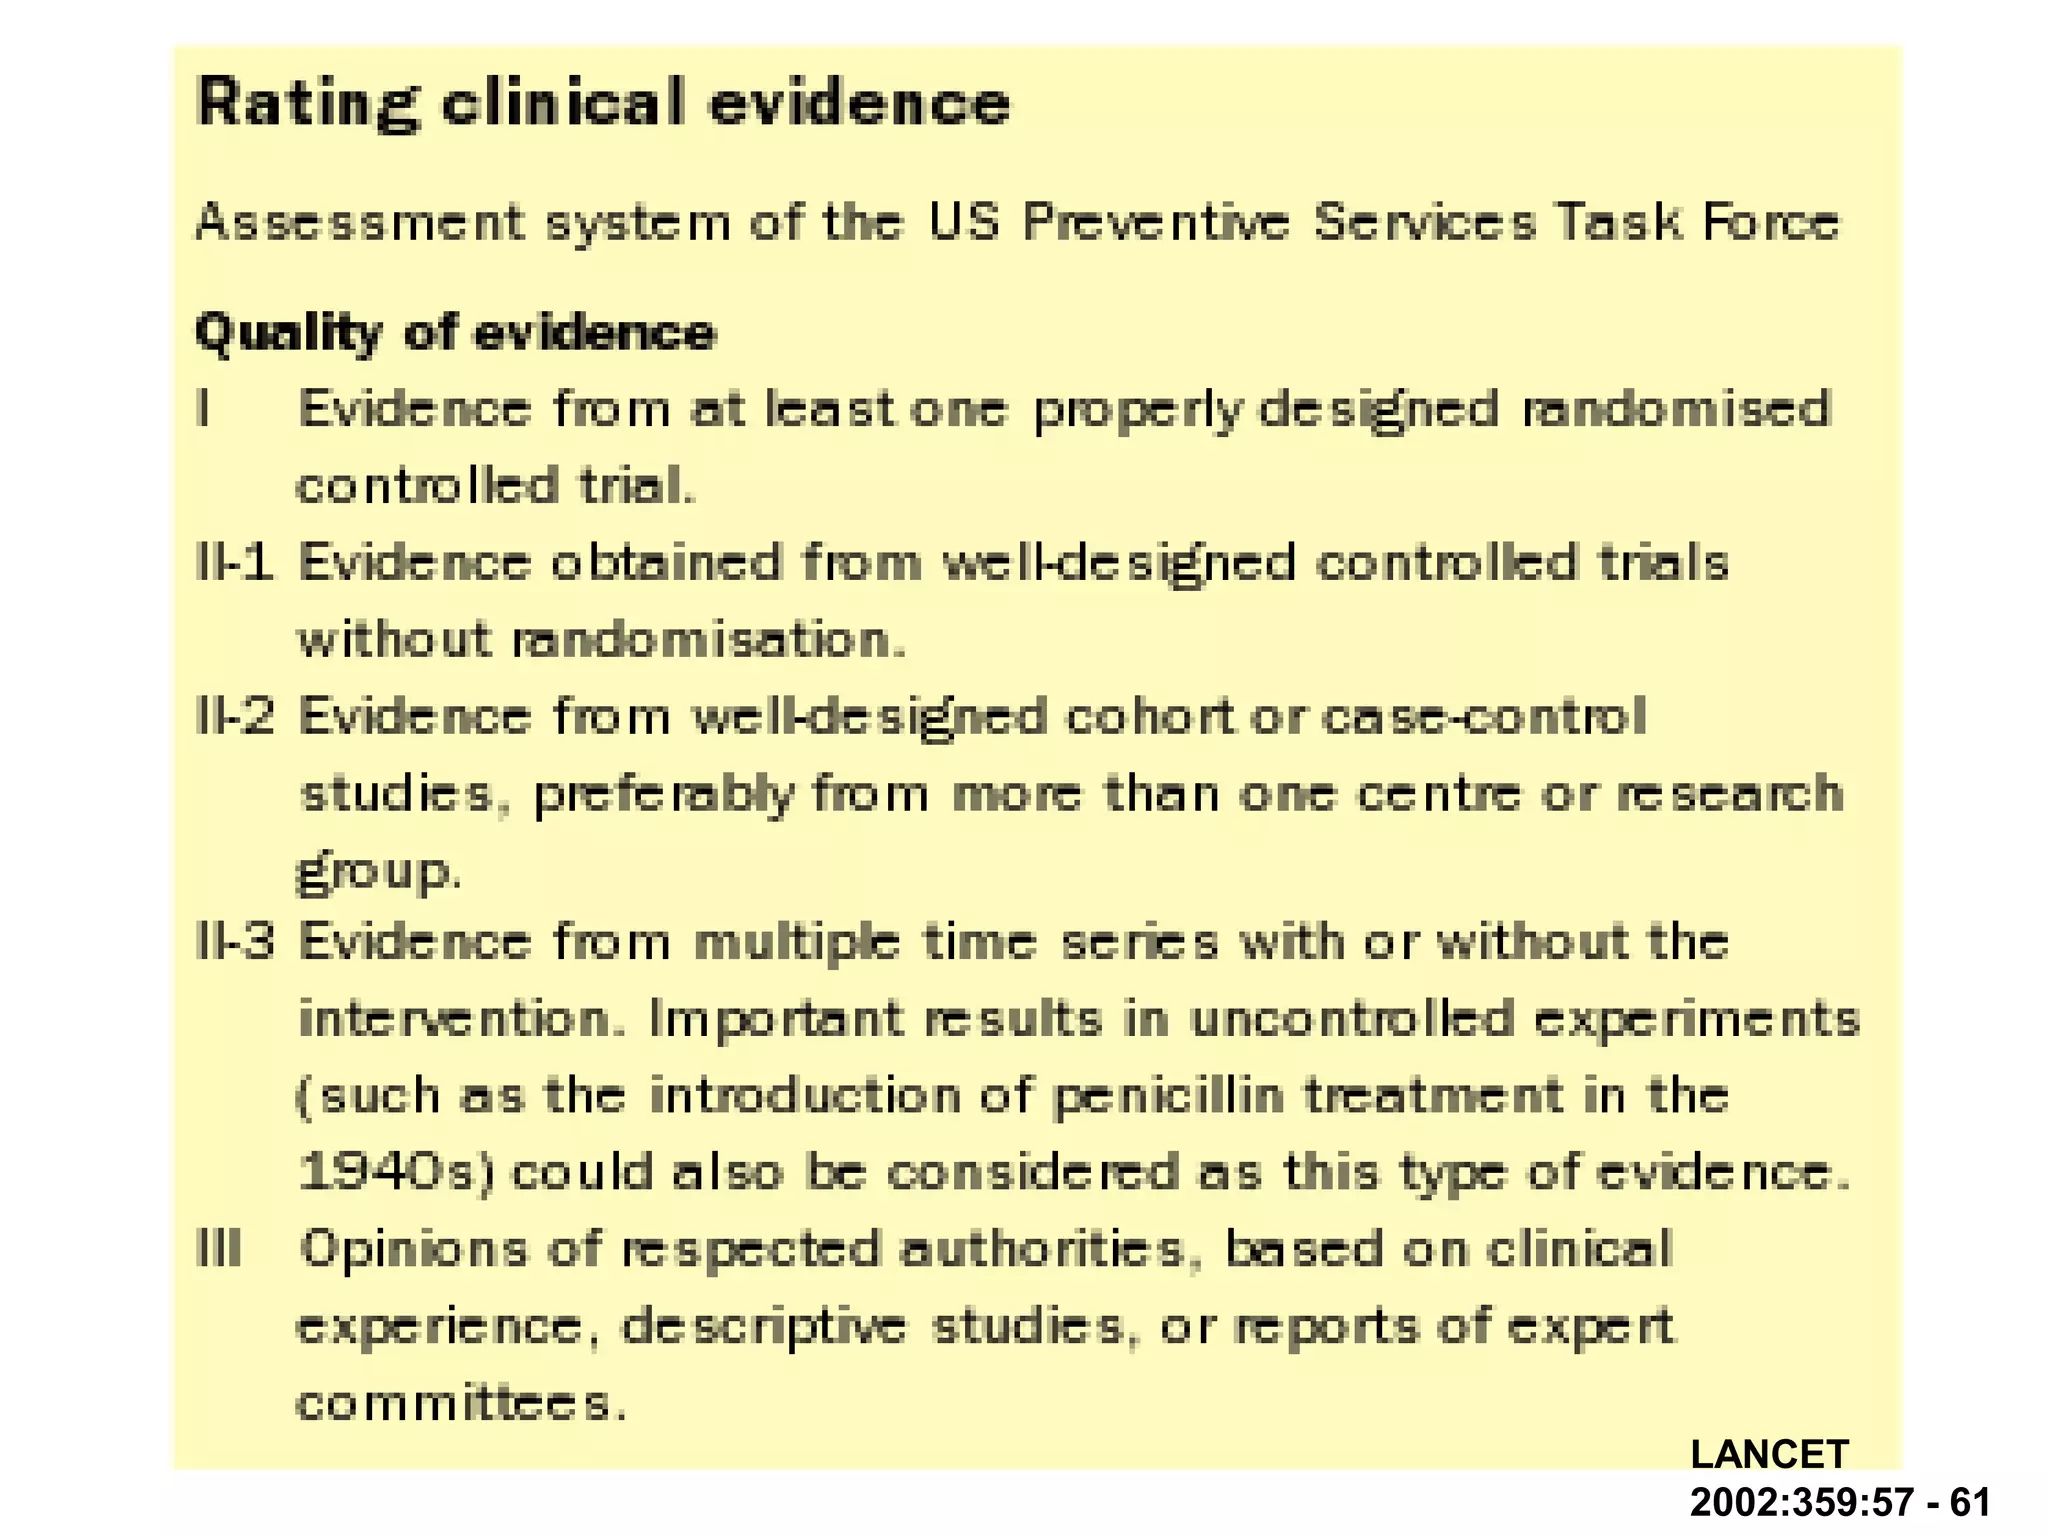
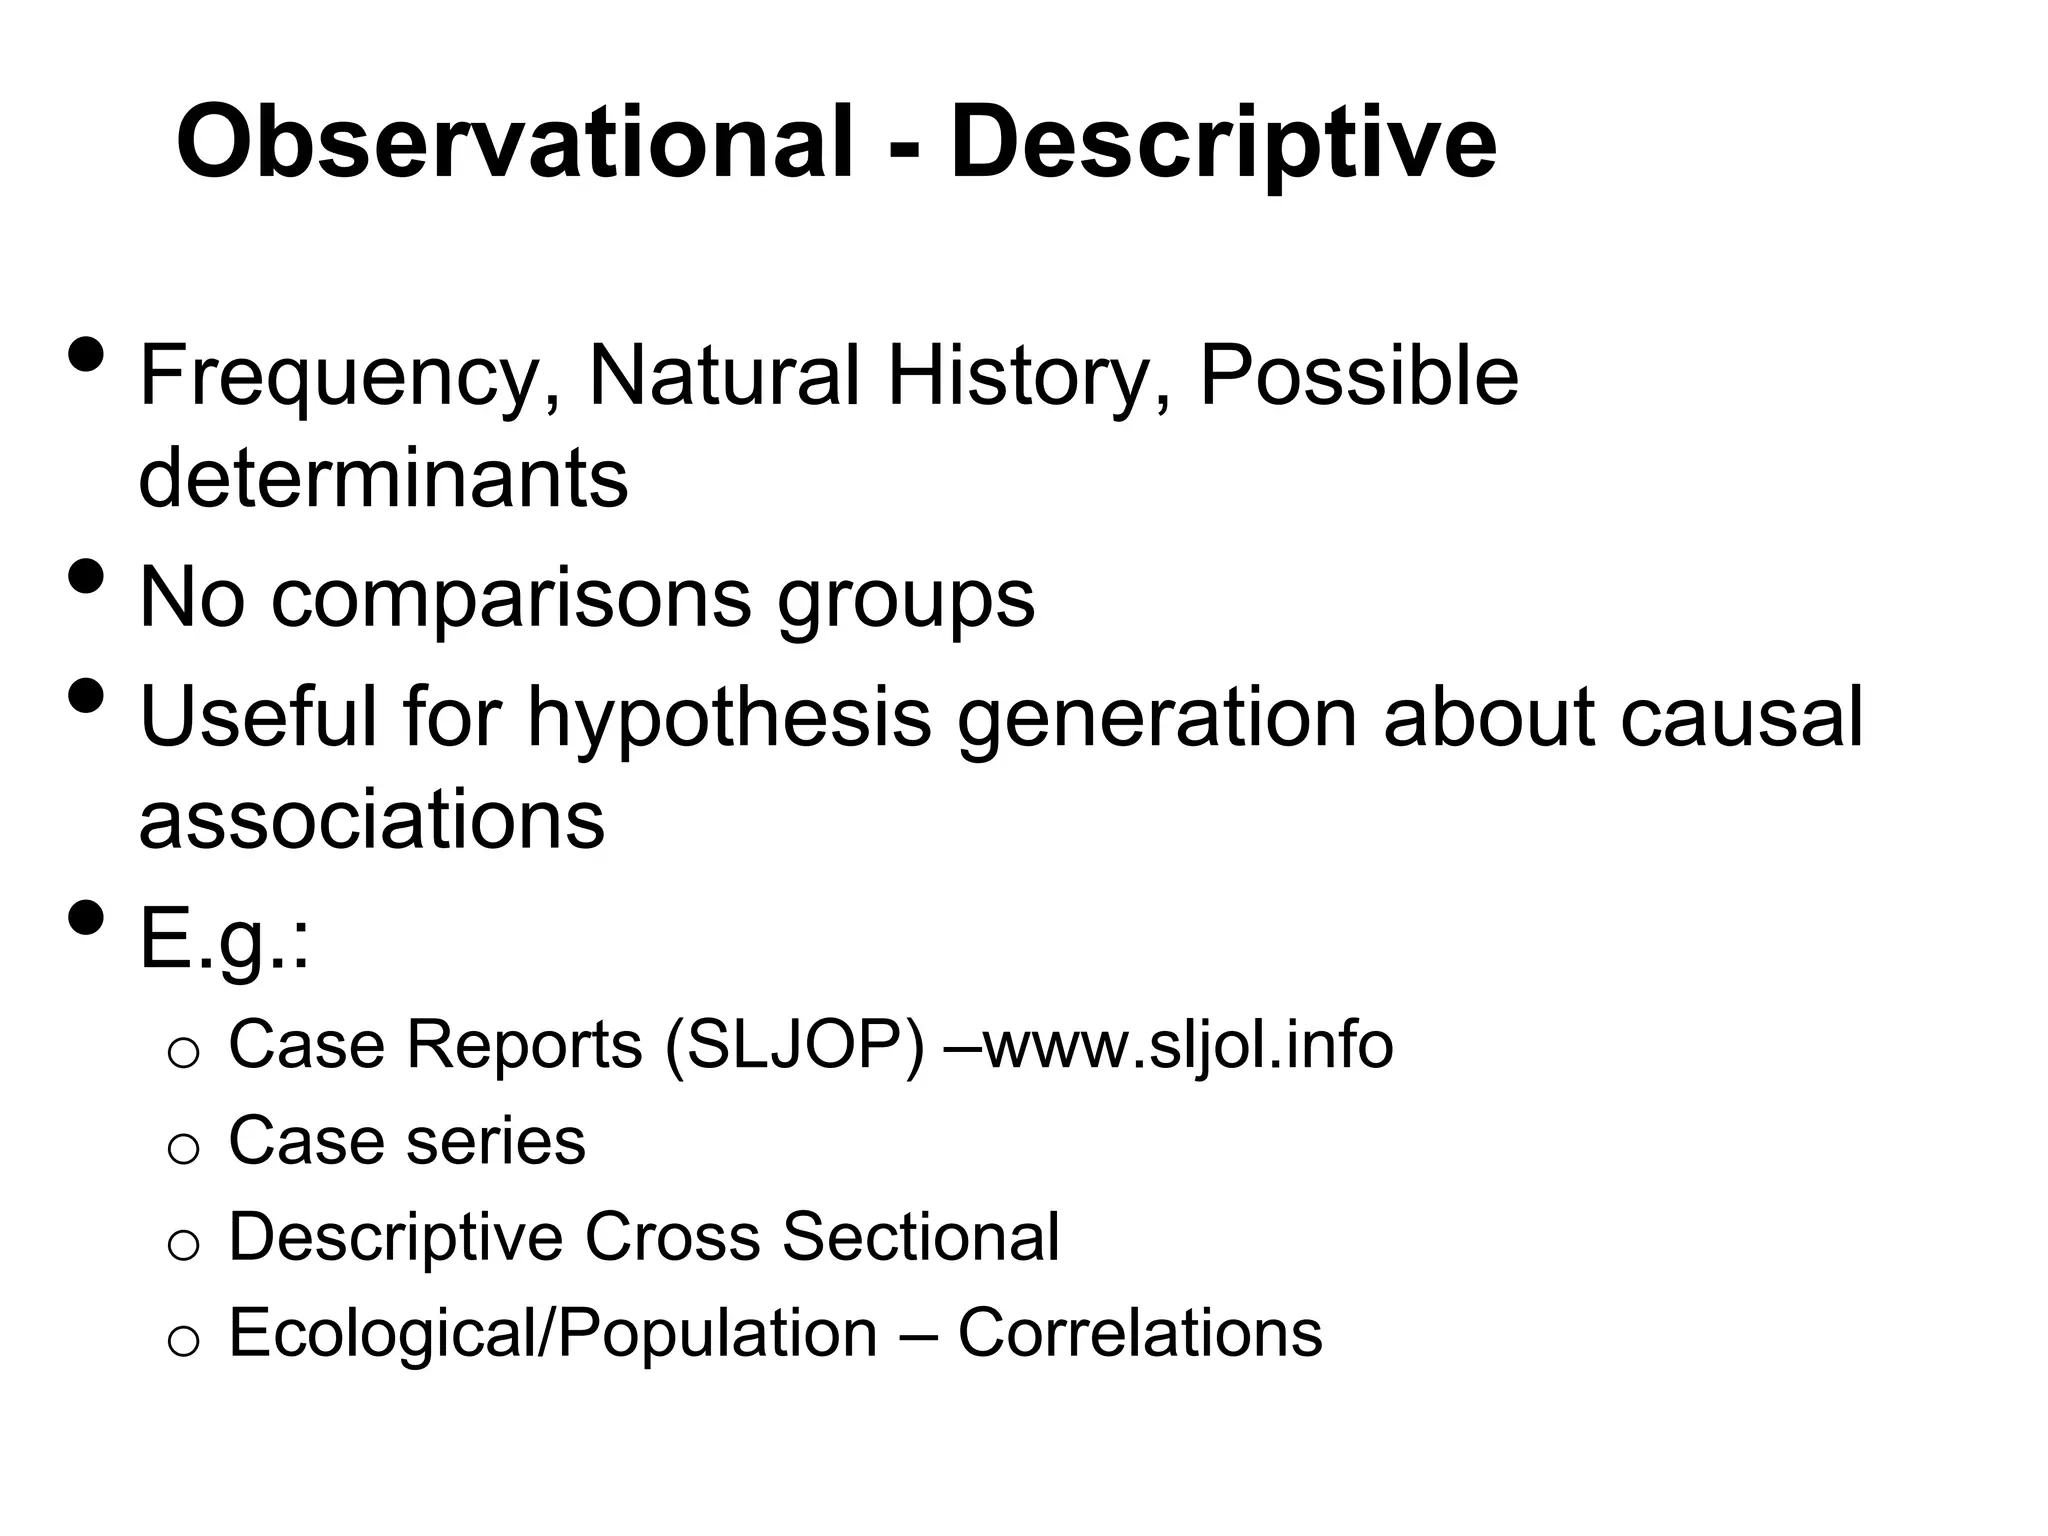
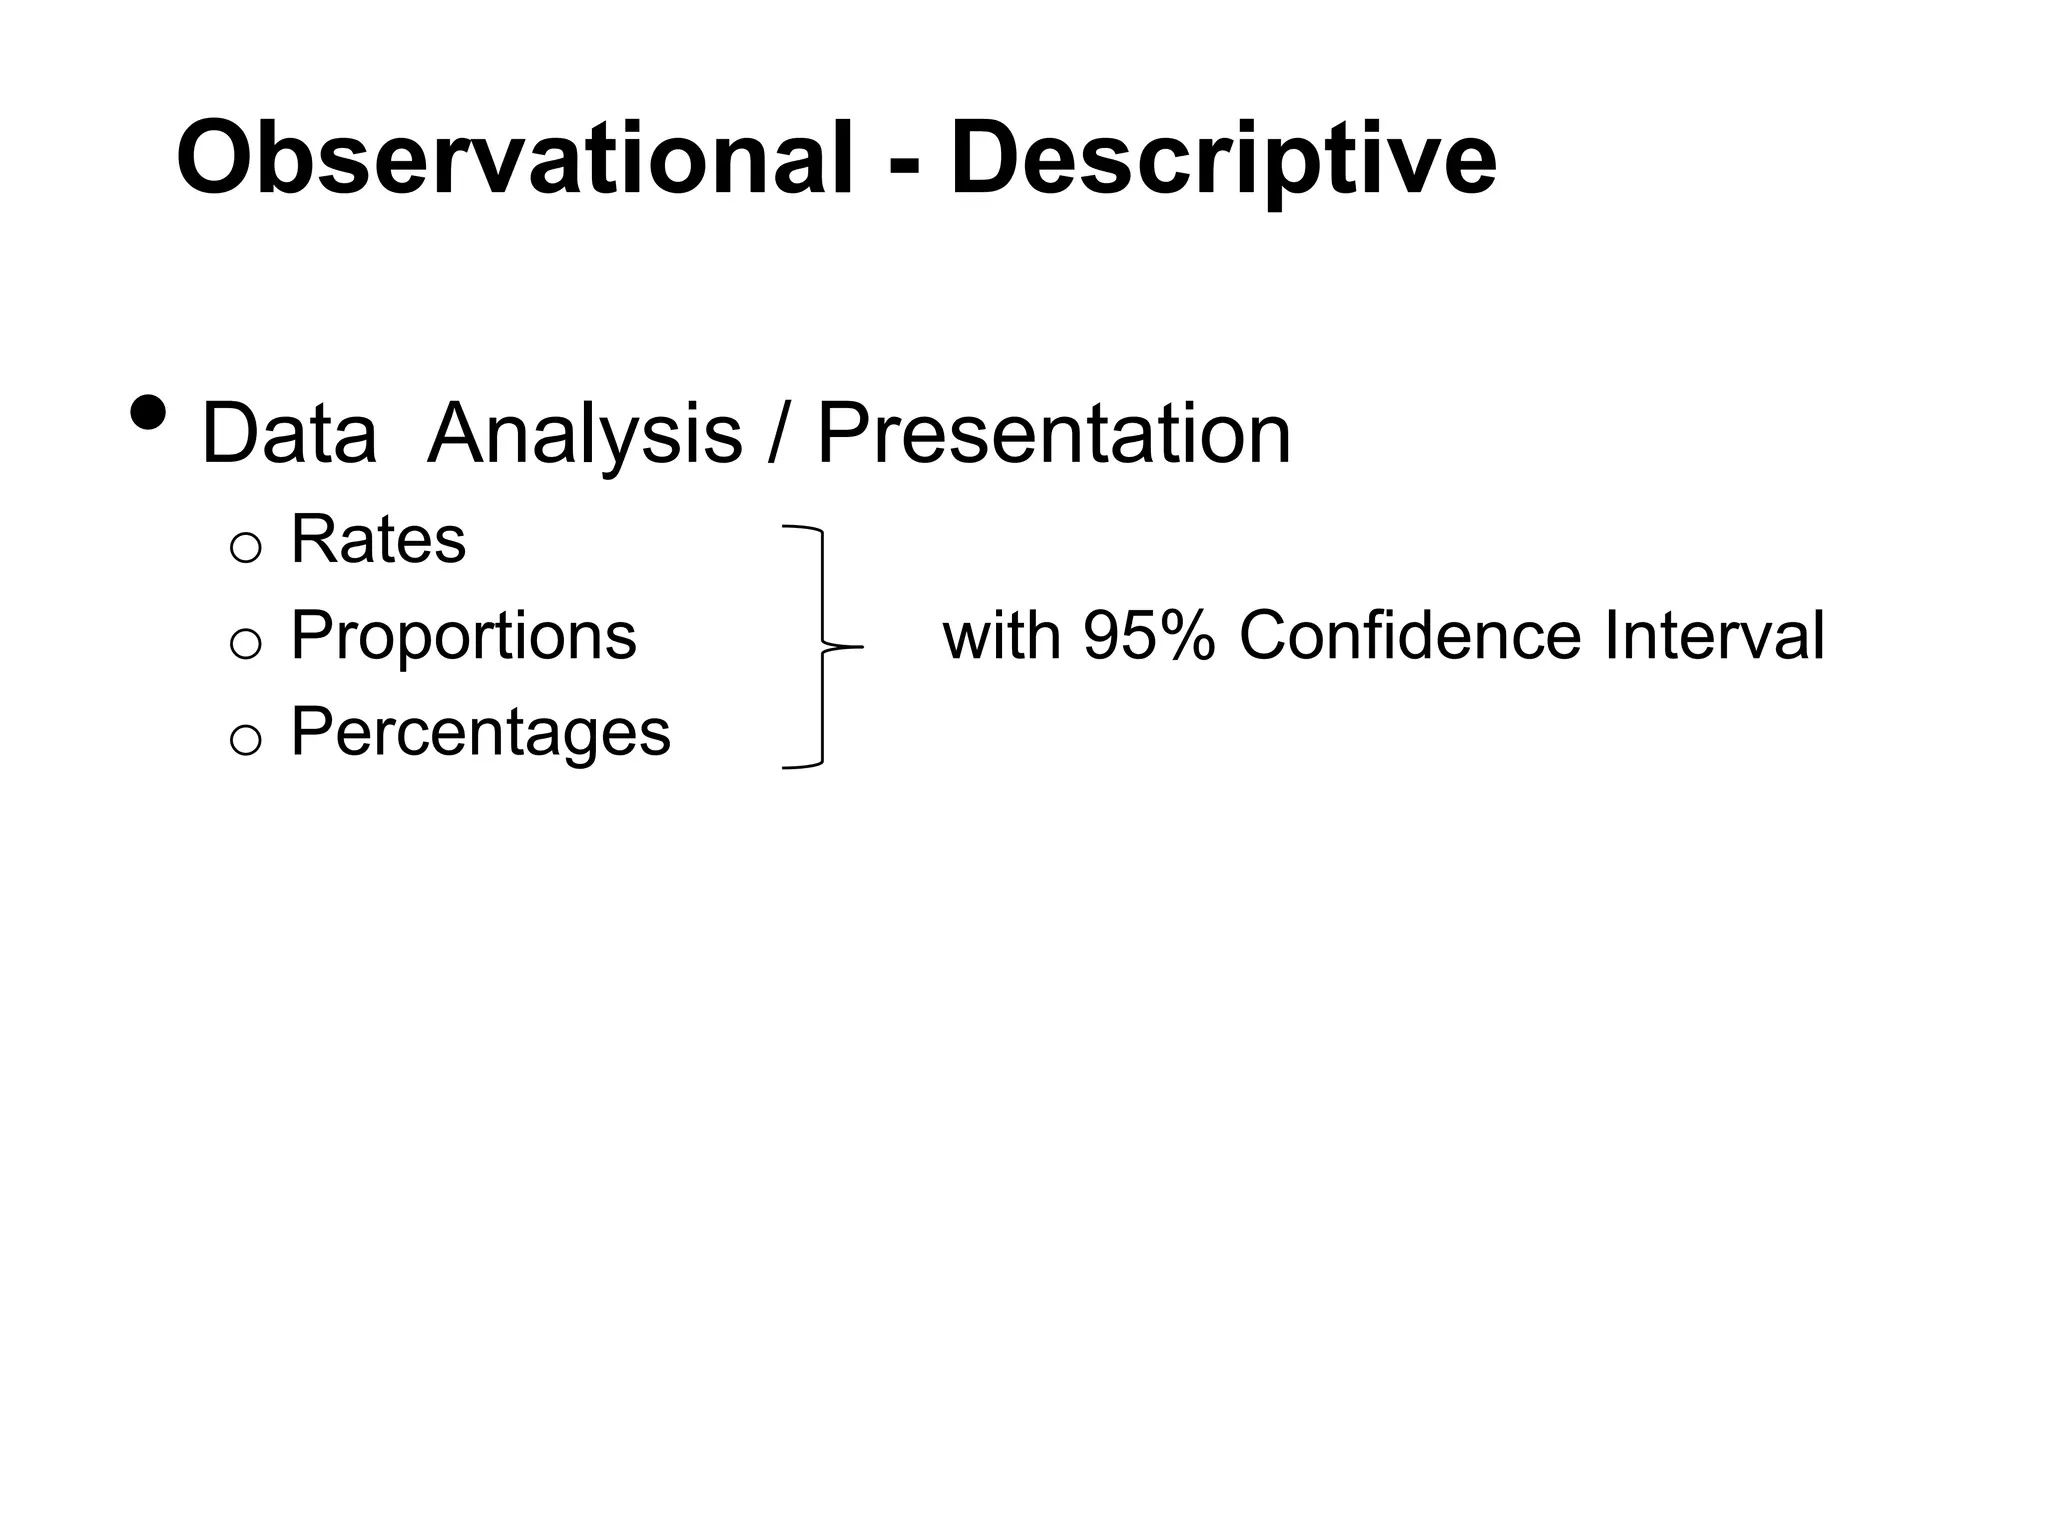
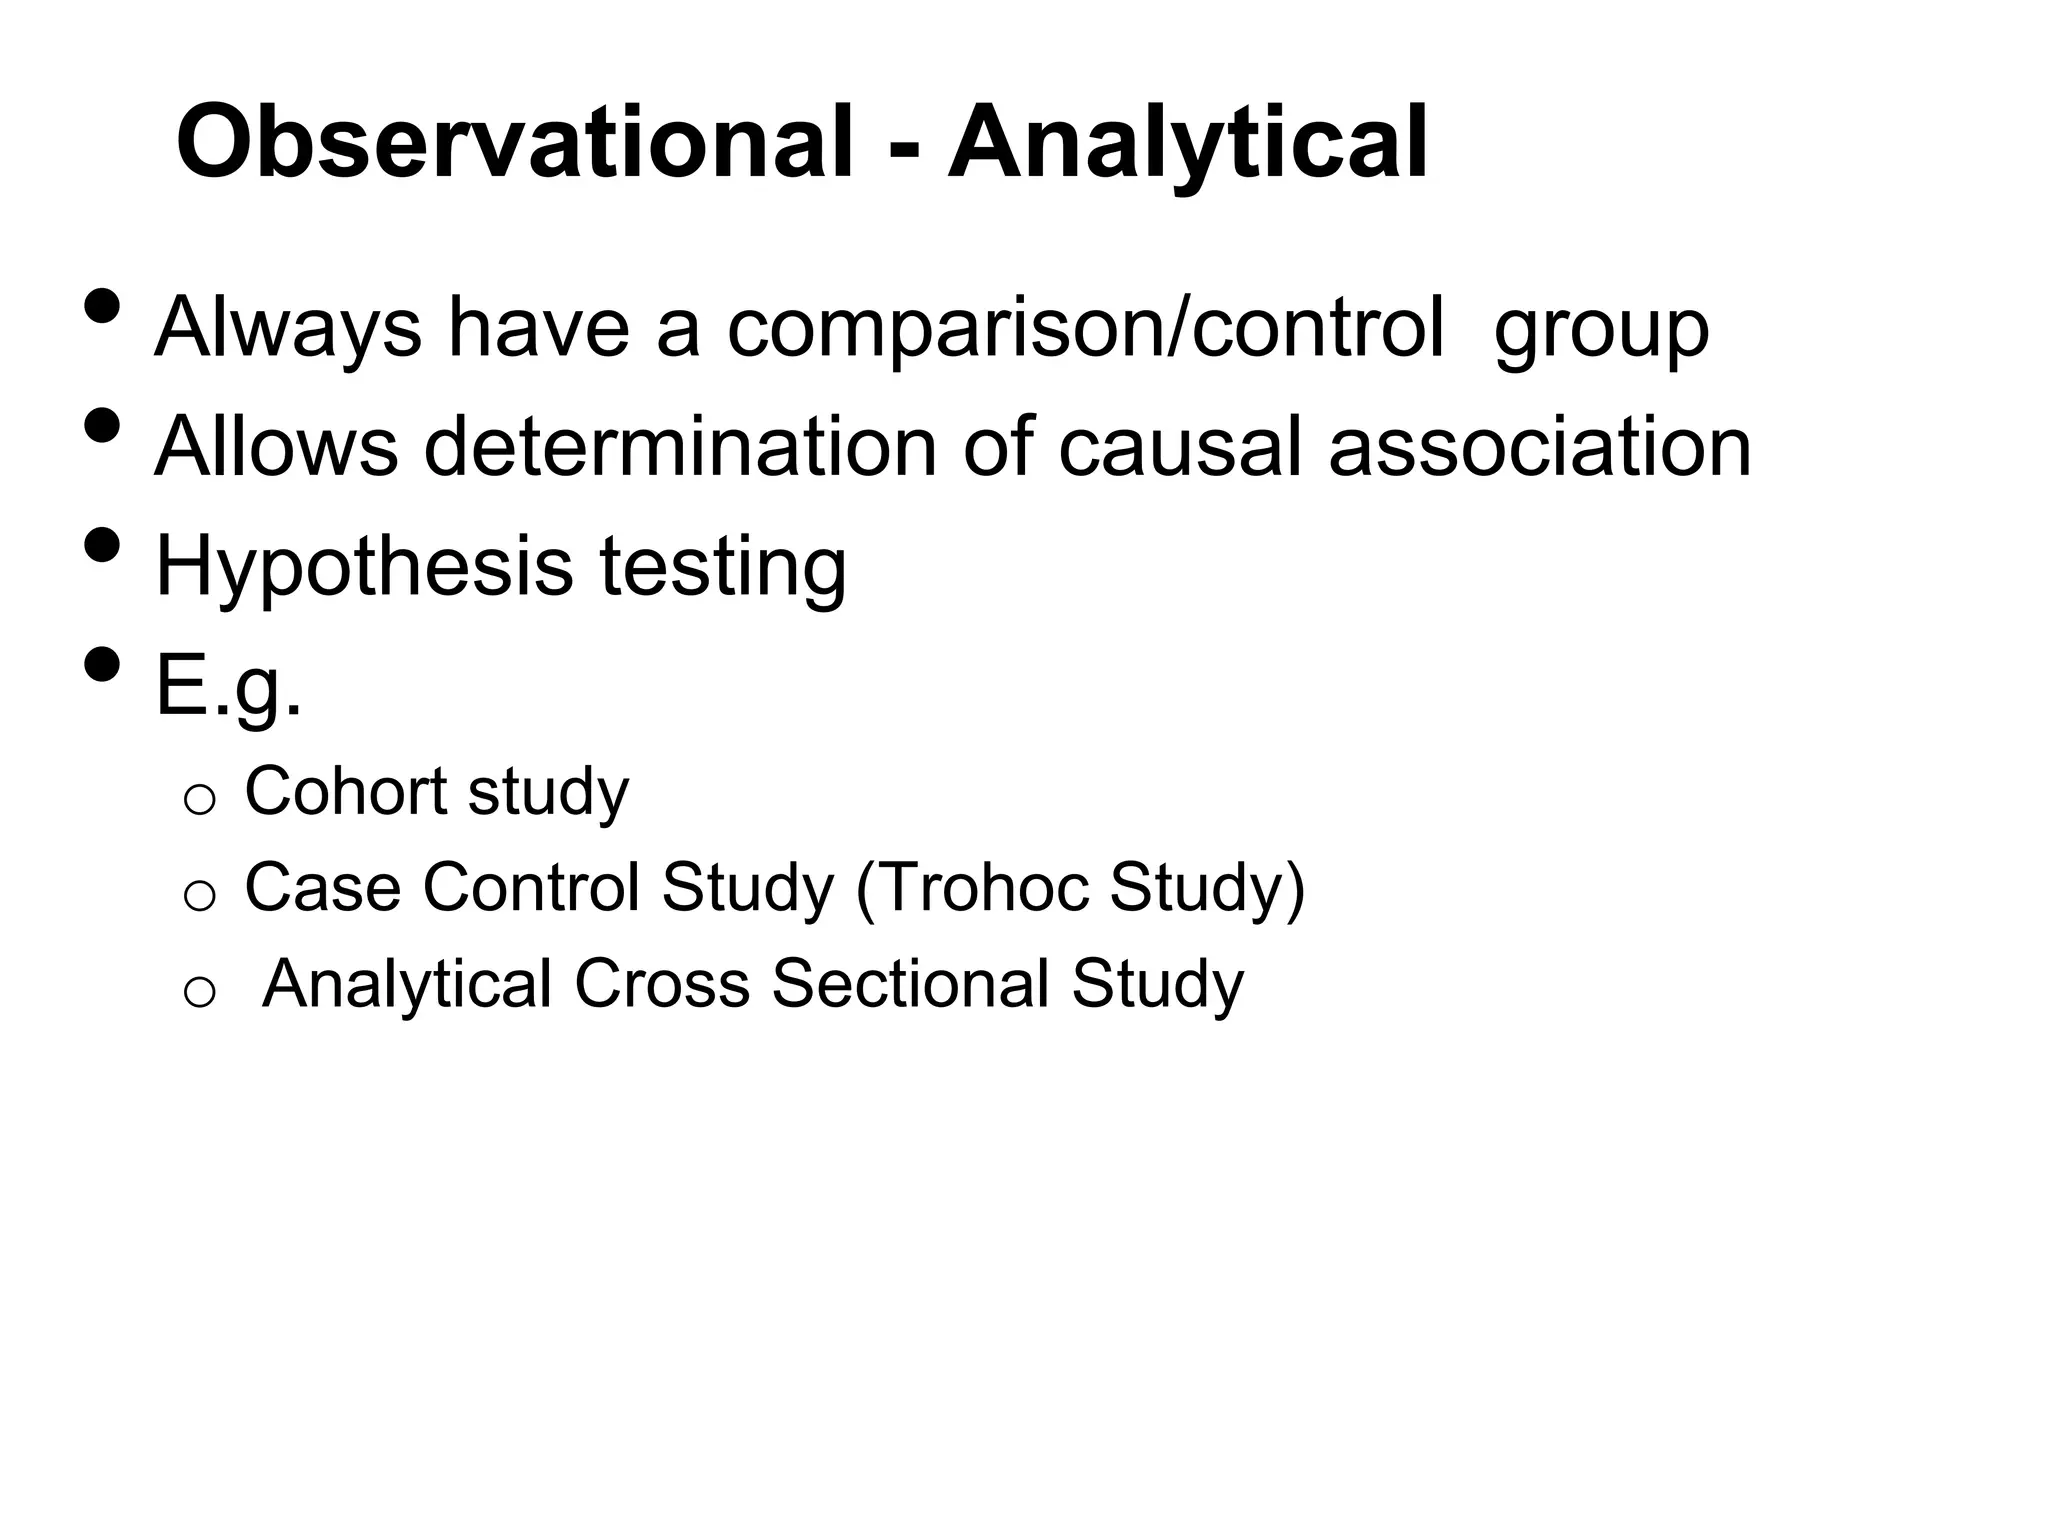
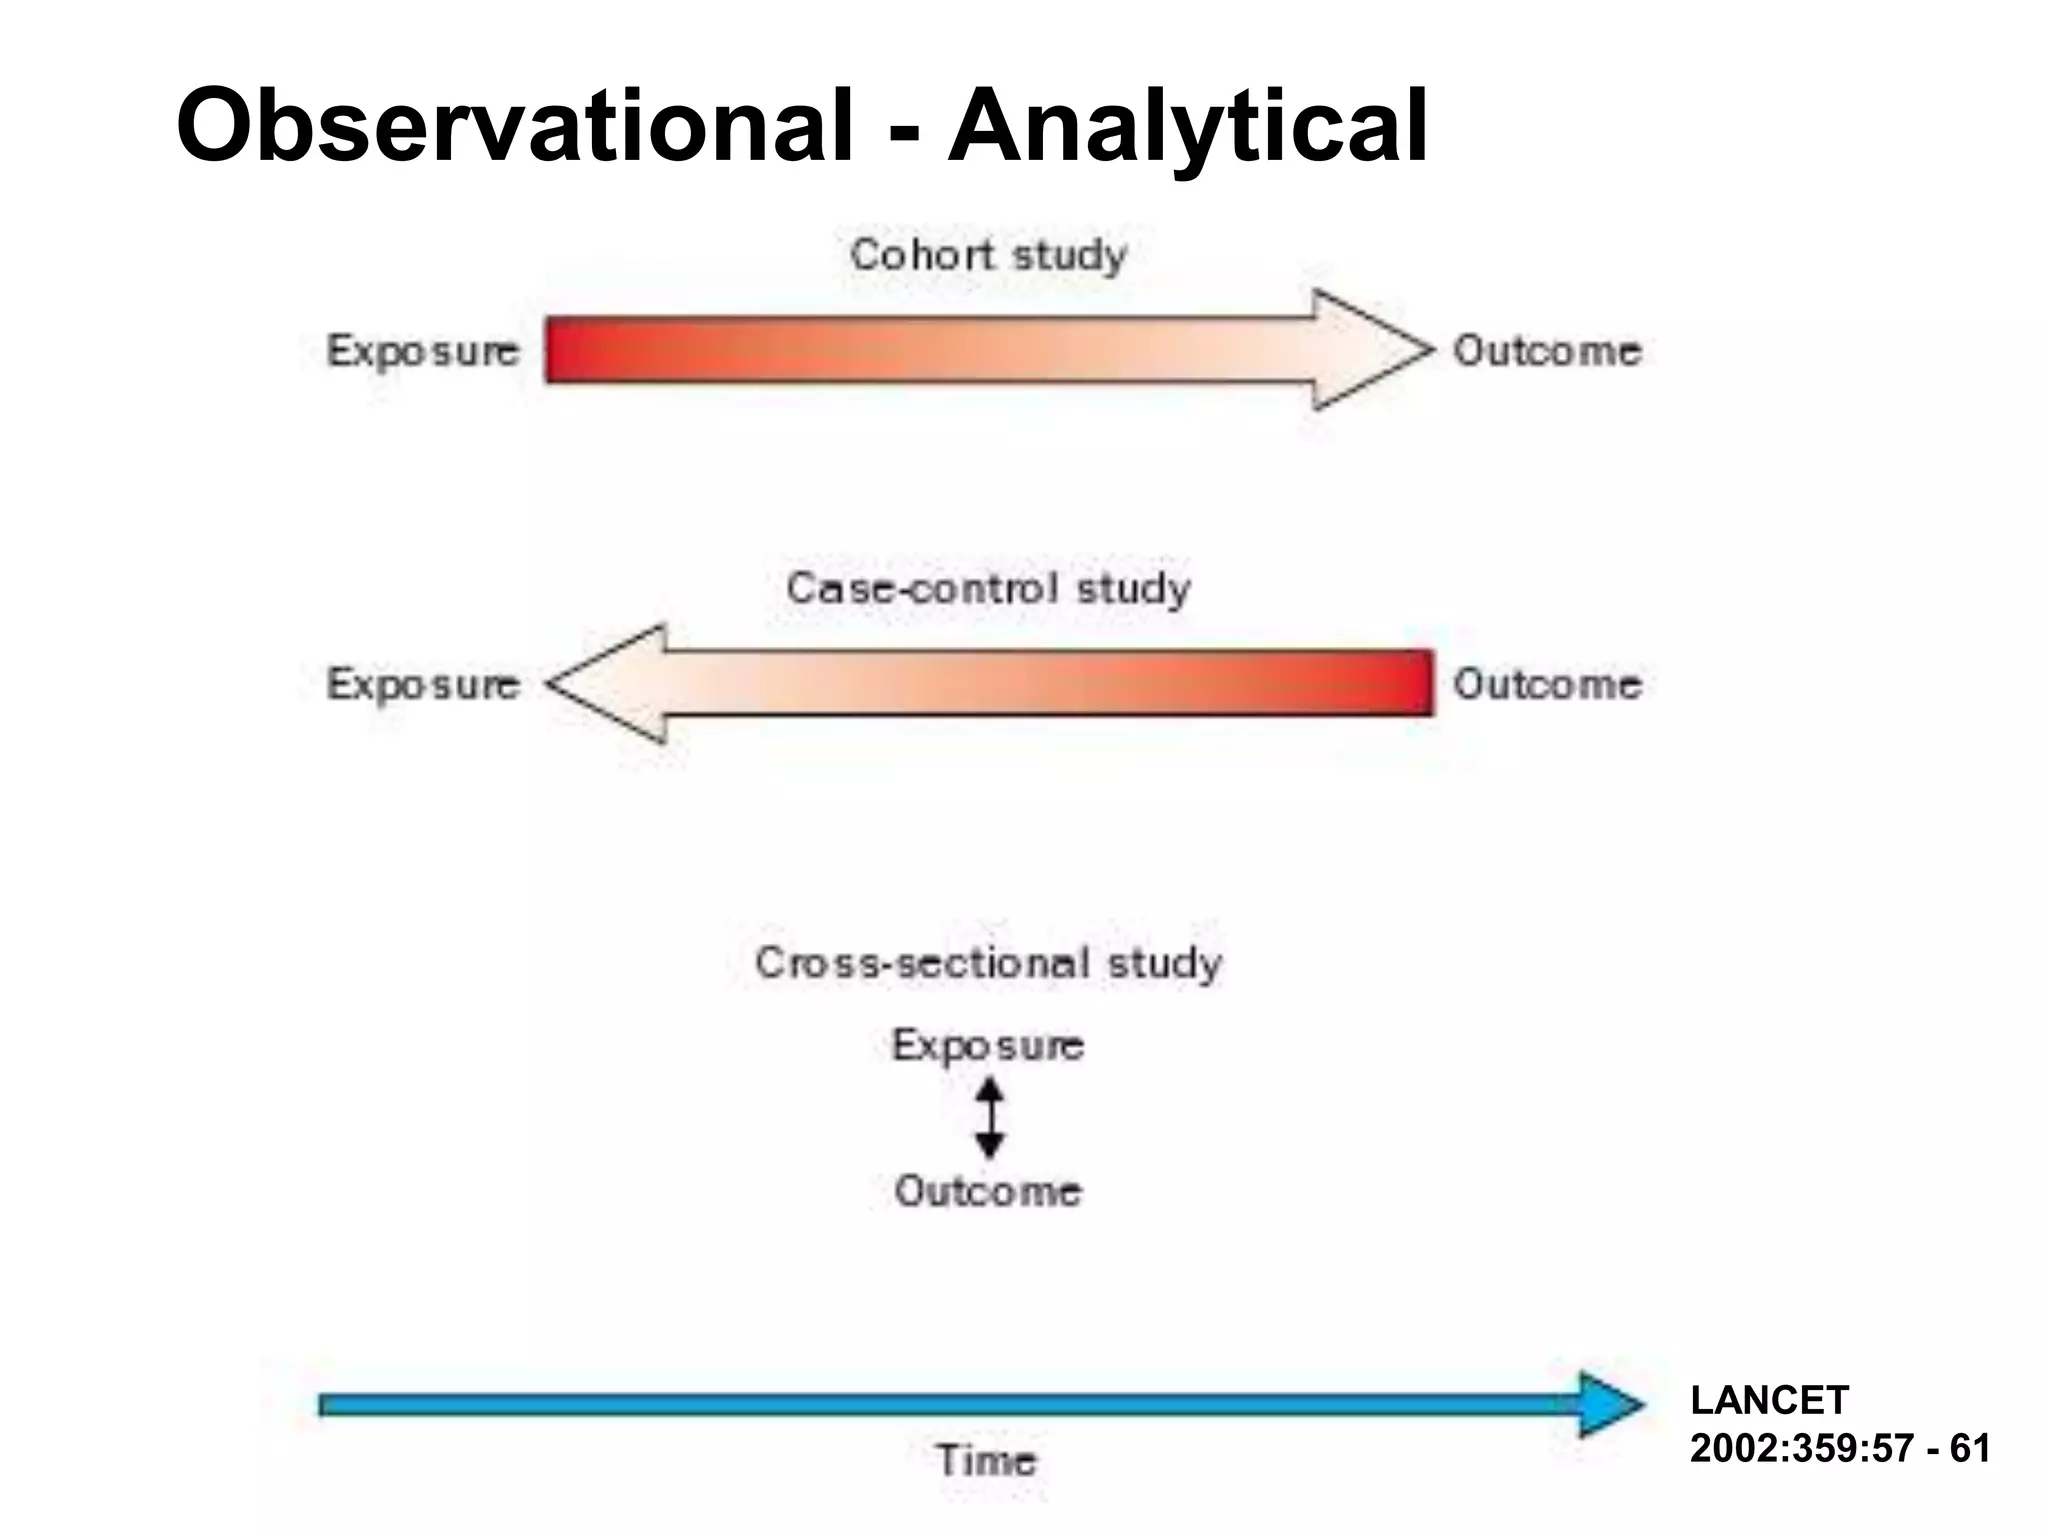
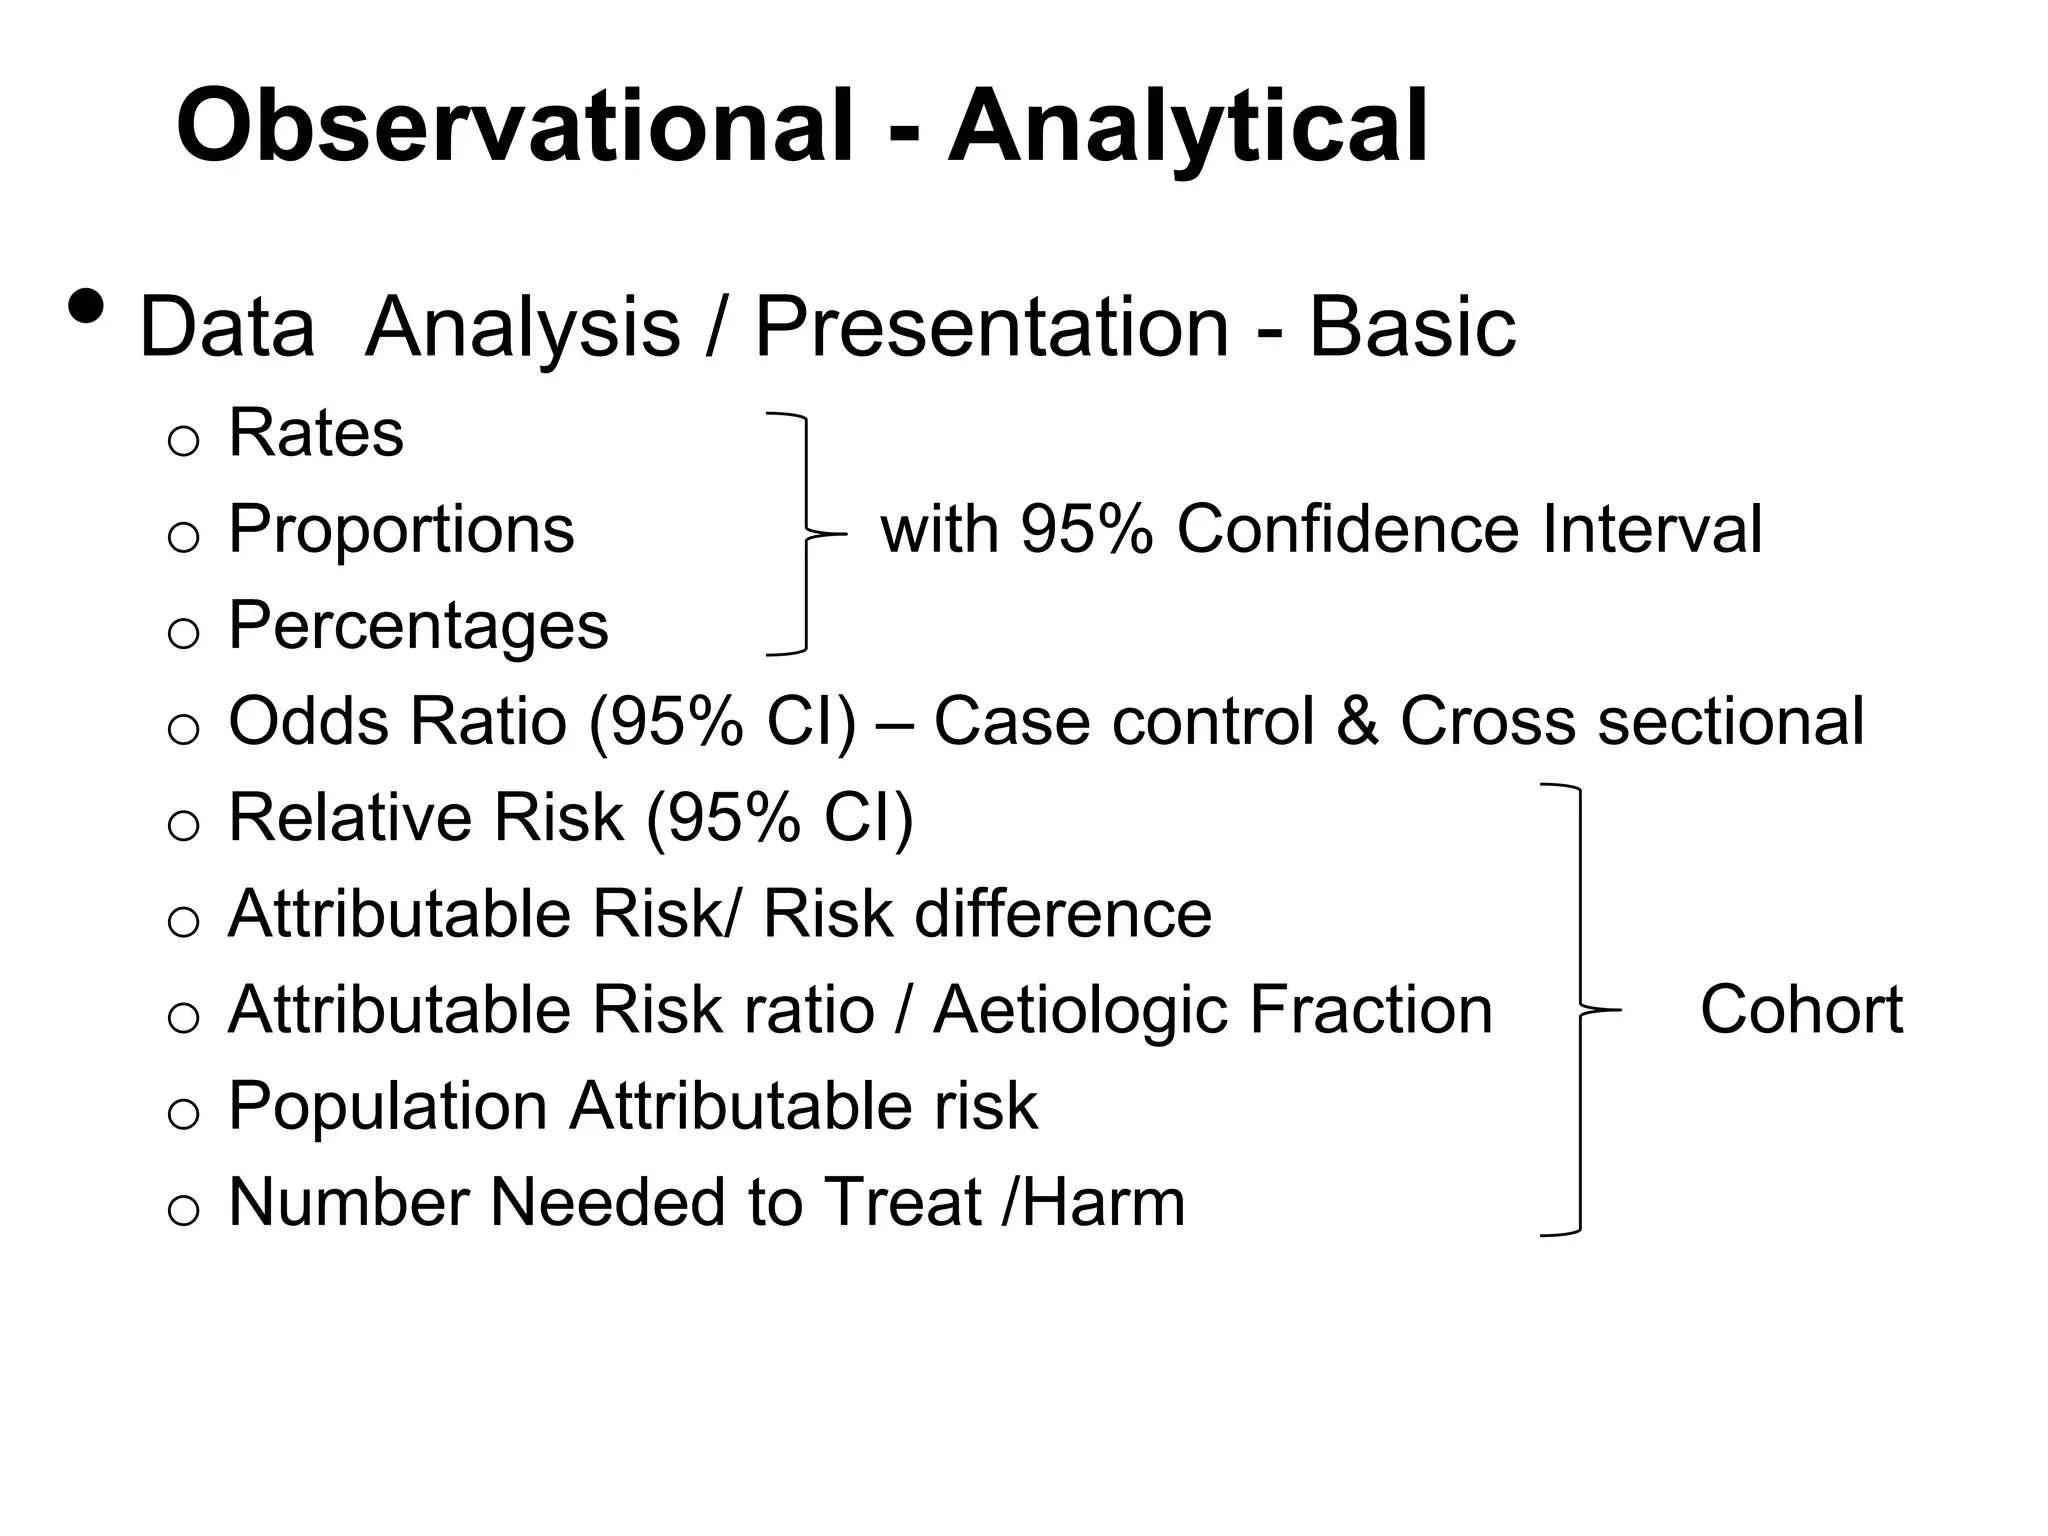
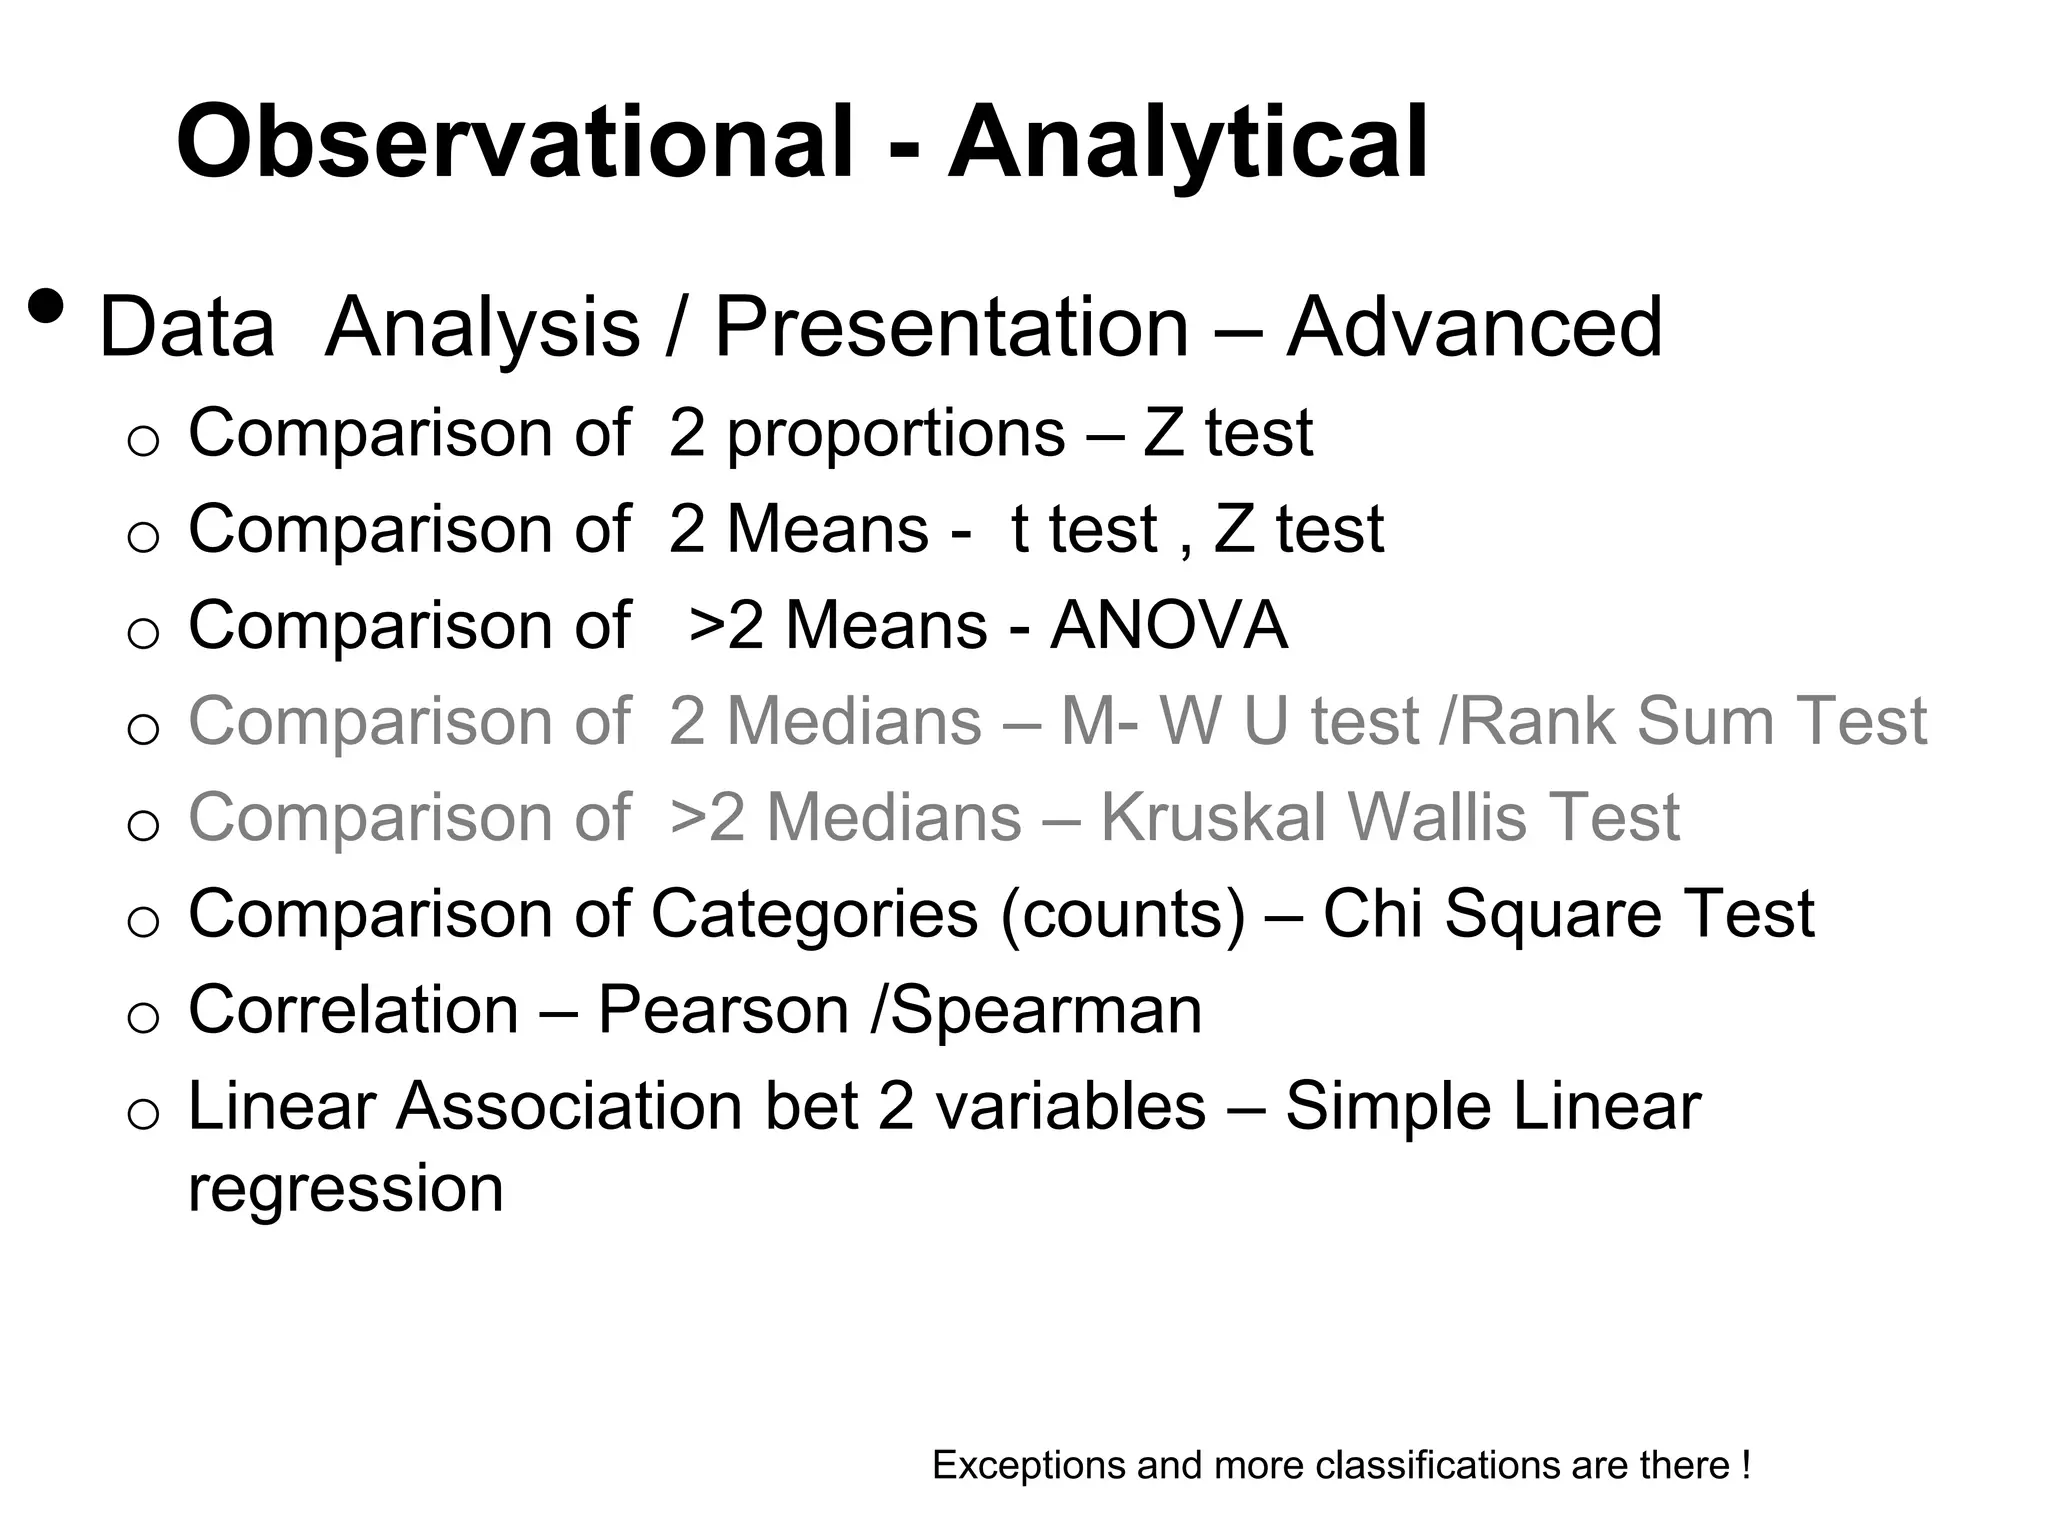
The document discusses various study designs used in epidemiology and statistics, including observational and experimental designs. It provides details on descriptive and analytical observational studies. Descriptive studies generate hypotheses, while analytical studies allow determination of causal associations by including a comparison or control group. Experimental designs are randomized studies that can establish causal relationships. The document also covers topics like odds ratios, relative risks, attributable risks, chi-square tests, sensitivity and specificity in diagnostic testing.