Downloaded 648 times
![What is Cohort ?
Ancient Roman military
unit, A band of warriors.
Persons banded together.
Group of persons with a
common statistical
characteristic. [Latin]
E.g. age, birth date,](https://image.slidesharecdn.com/cohortppt-140210103410-phpapp01/75/Cohort-ppt-4-2048.jpg)


- Cohort studies examine the association between an exposure and an outcome by following groups over time and comparing their experience. - This document discusses what a cohort study is, how it differs from other study designs in determining temporal relationships, and provides examples of cohort designs and their analysis. - Key aspects reviewed include prospectively following groups based on exposure status and comparing disease incidence rates and relative risks between exposed and unexposed groups over time.
Introduction to cohort study by Hari Prasad Kafle, highlighting the importance of this study design.
Cohort studies establish associations between causes and diseases, focusing on risk factors prior to the outcome.
Cohorts are defined as groups sharing common characteristics, like age or exposure, across time.
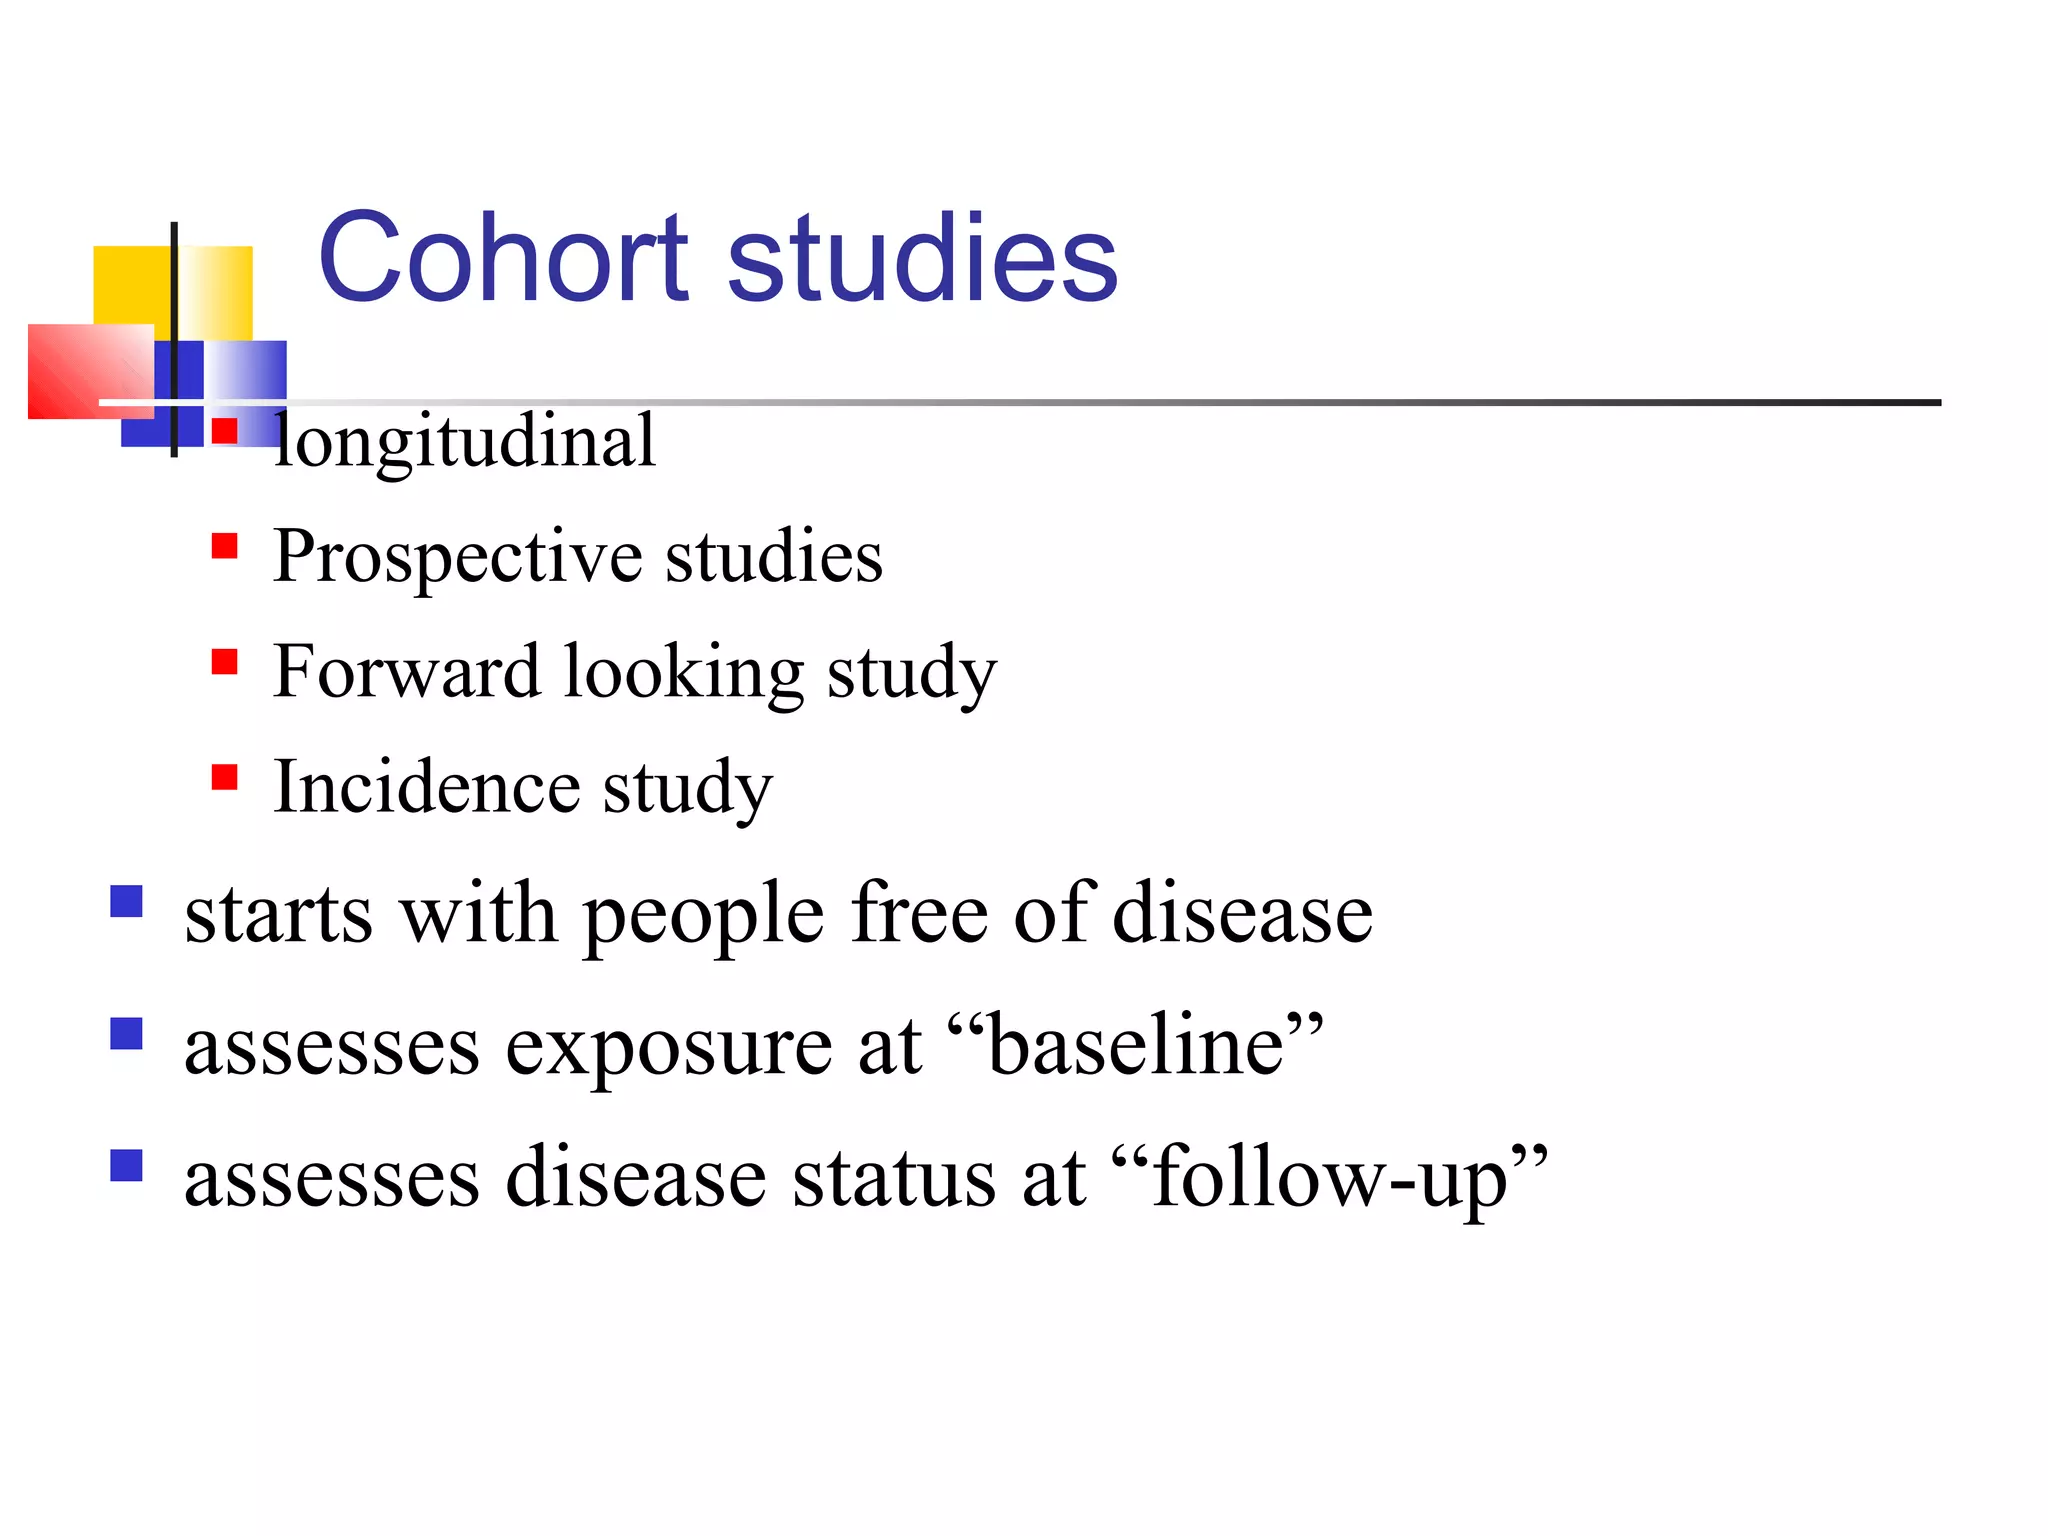
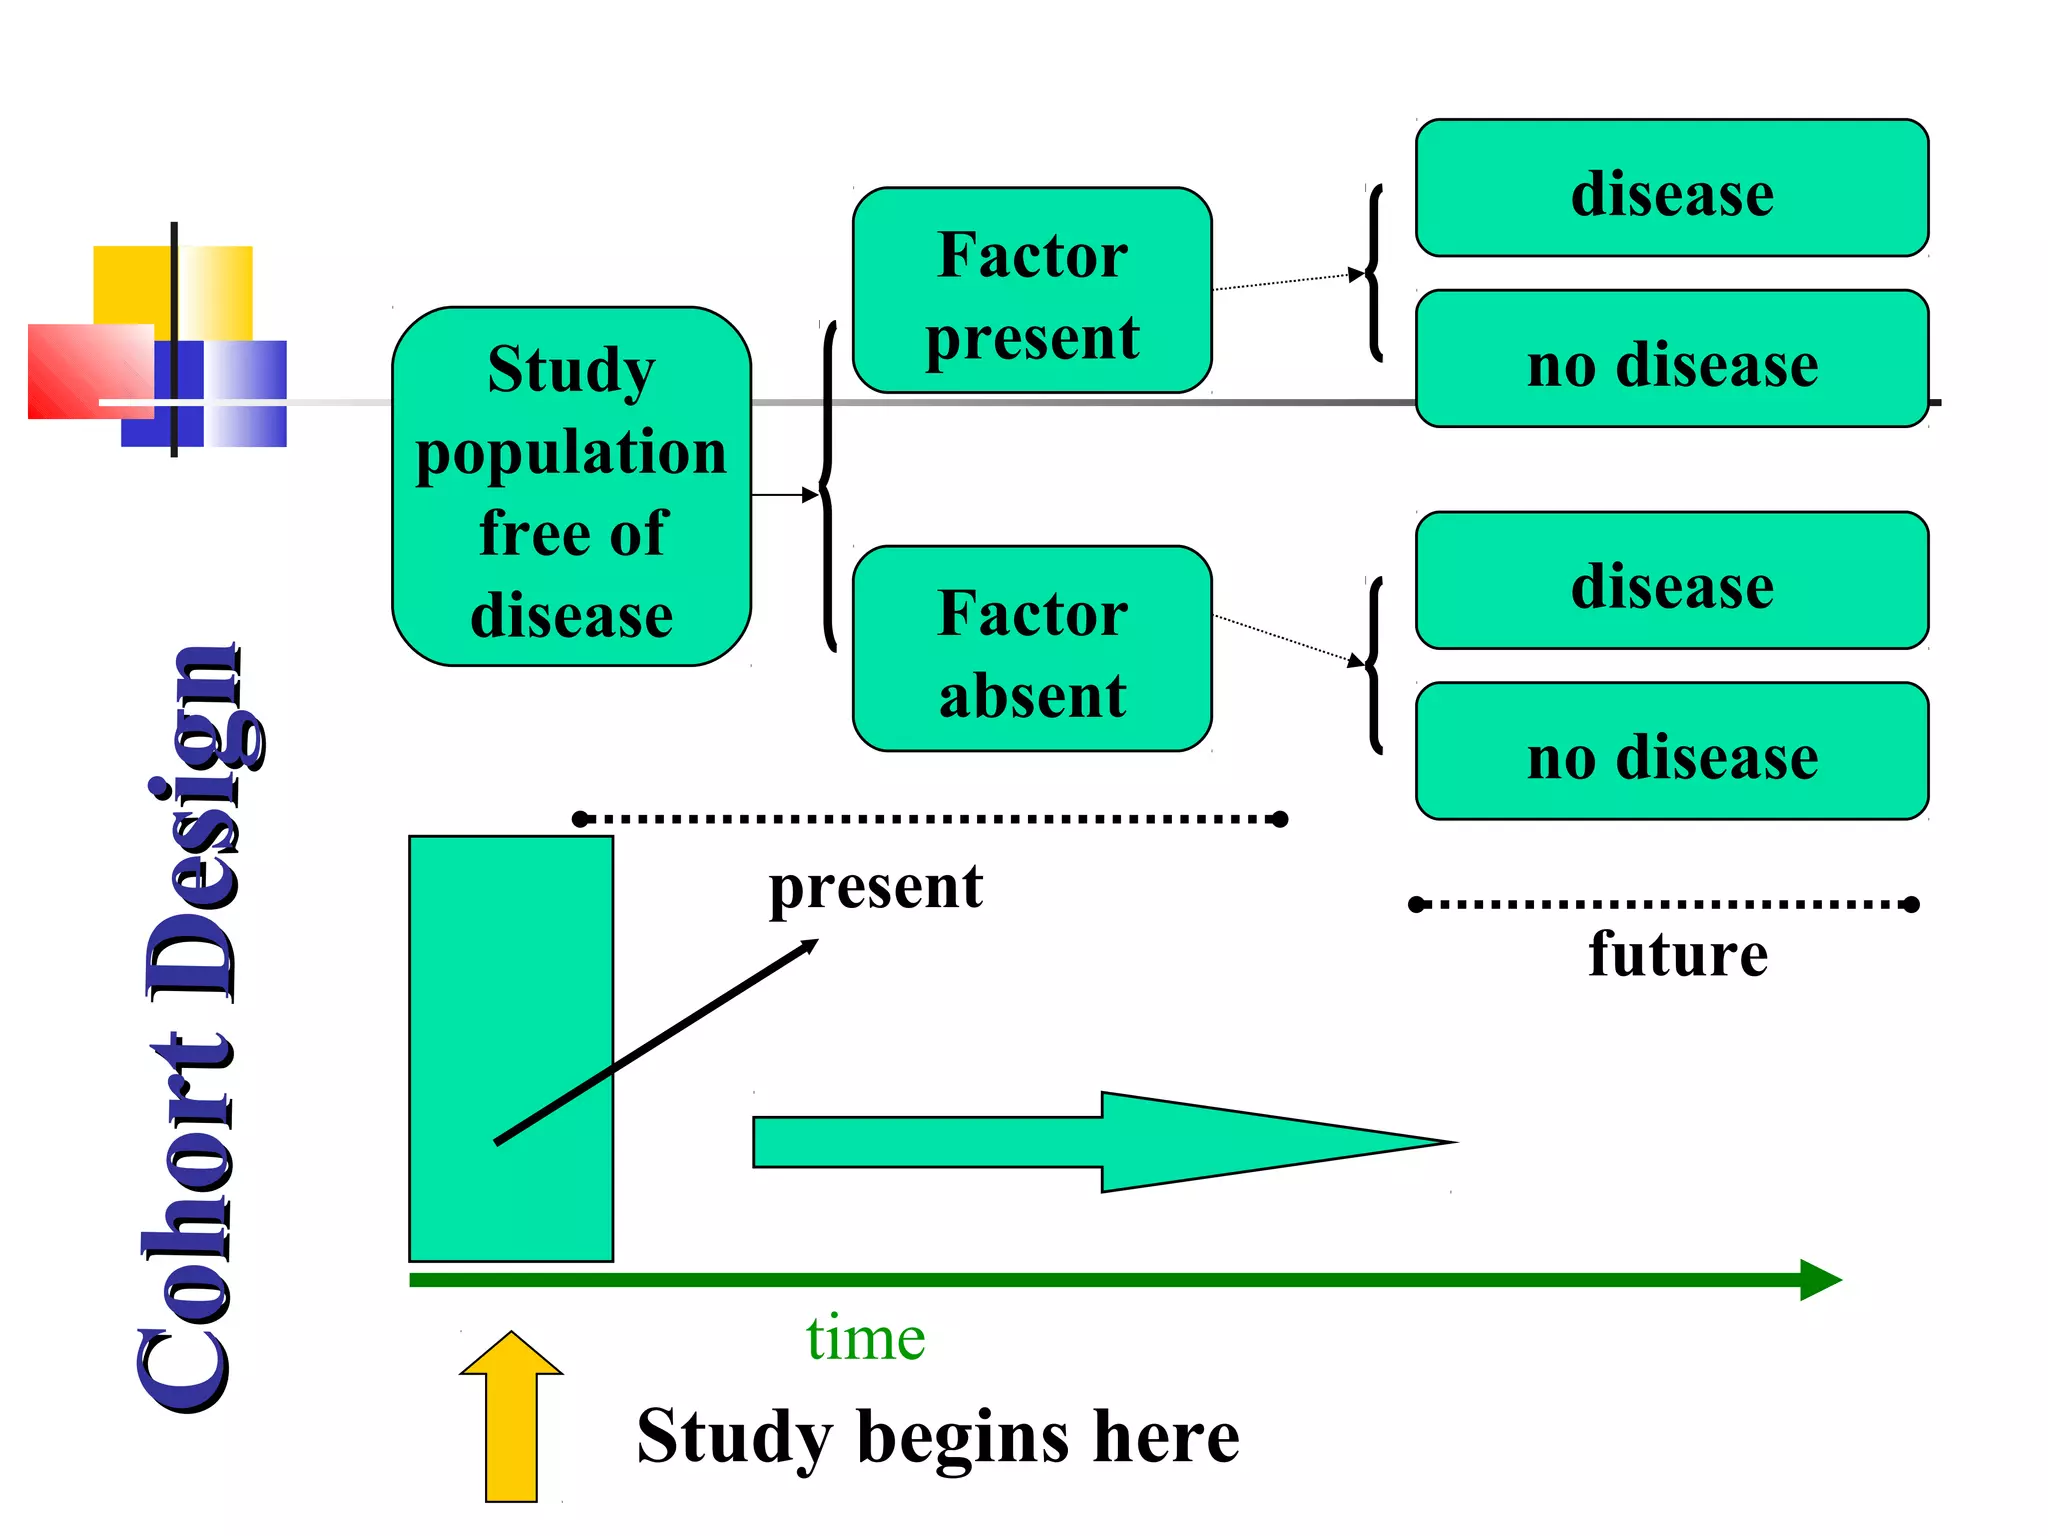
Cohort studies are longitudinal, prospective, assessing exposures and disease incidence over time.
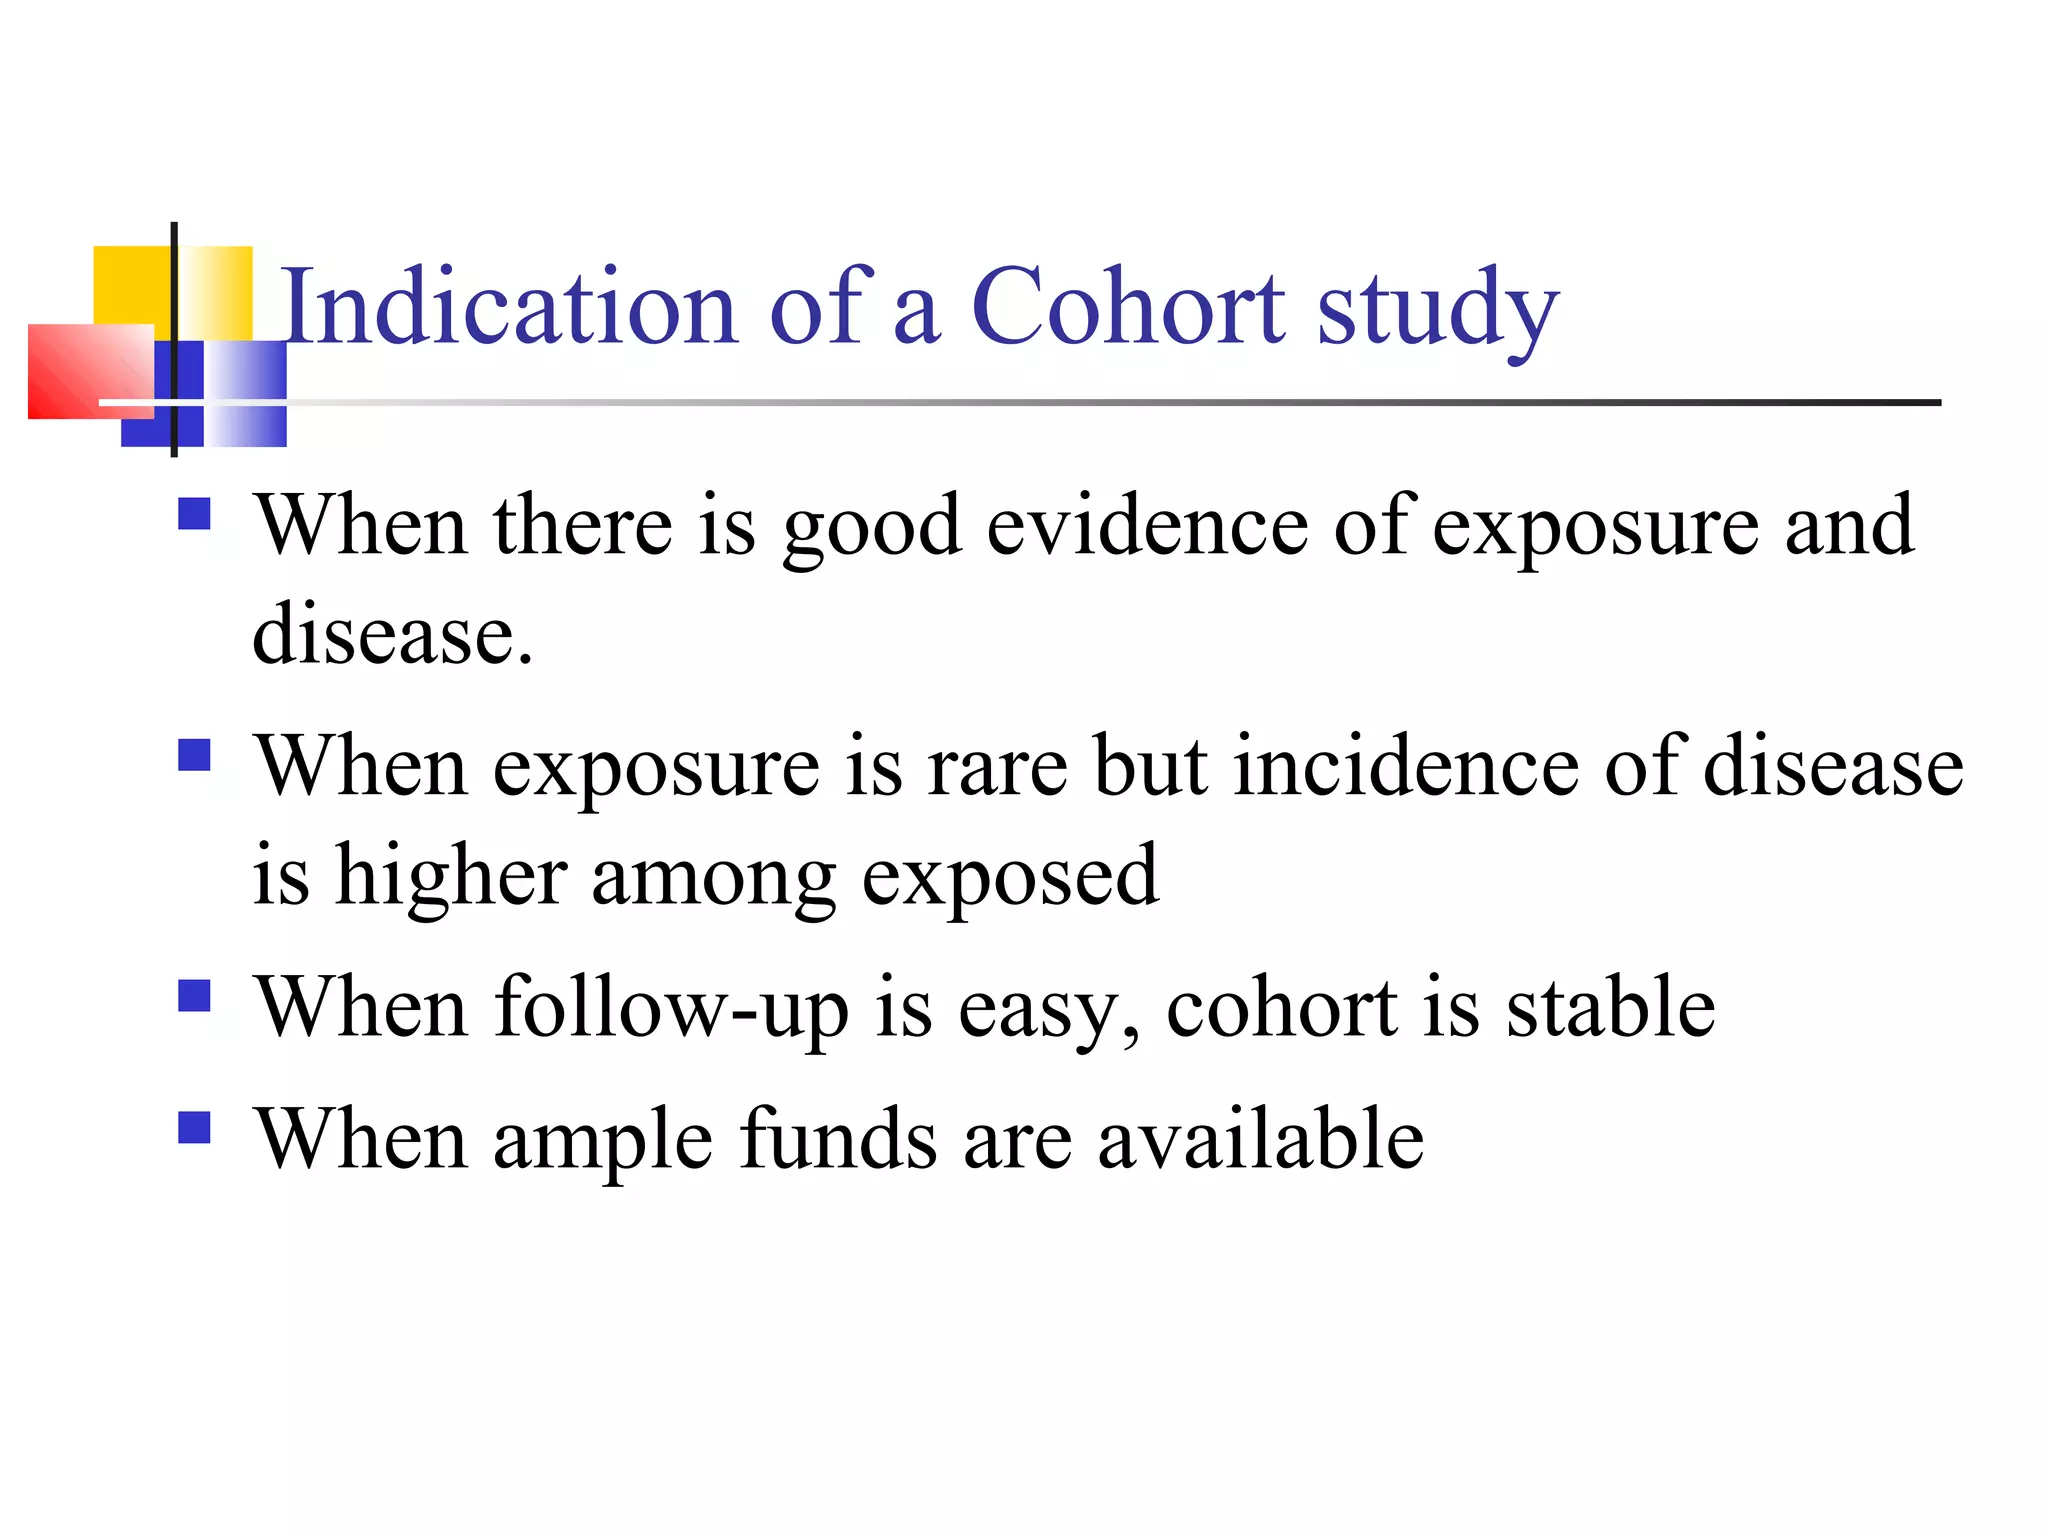
Cohorts are indicated when evidence of exposure and disease exists, with stability and funding available.
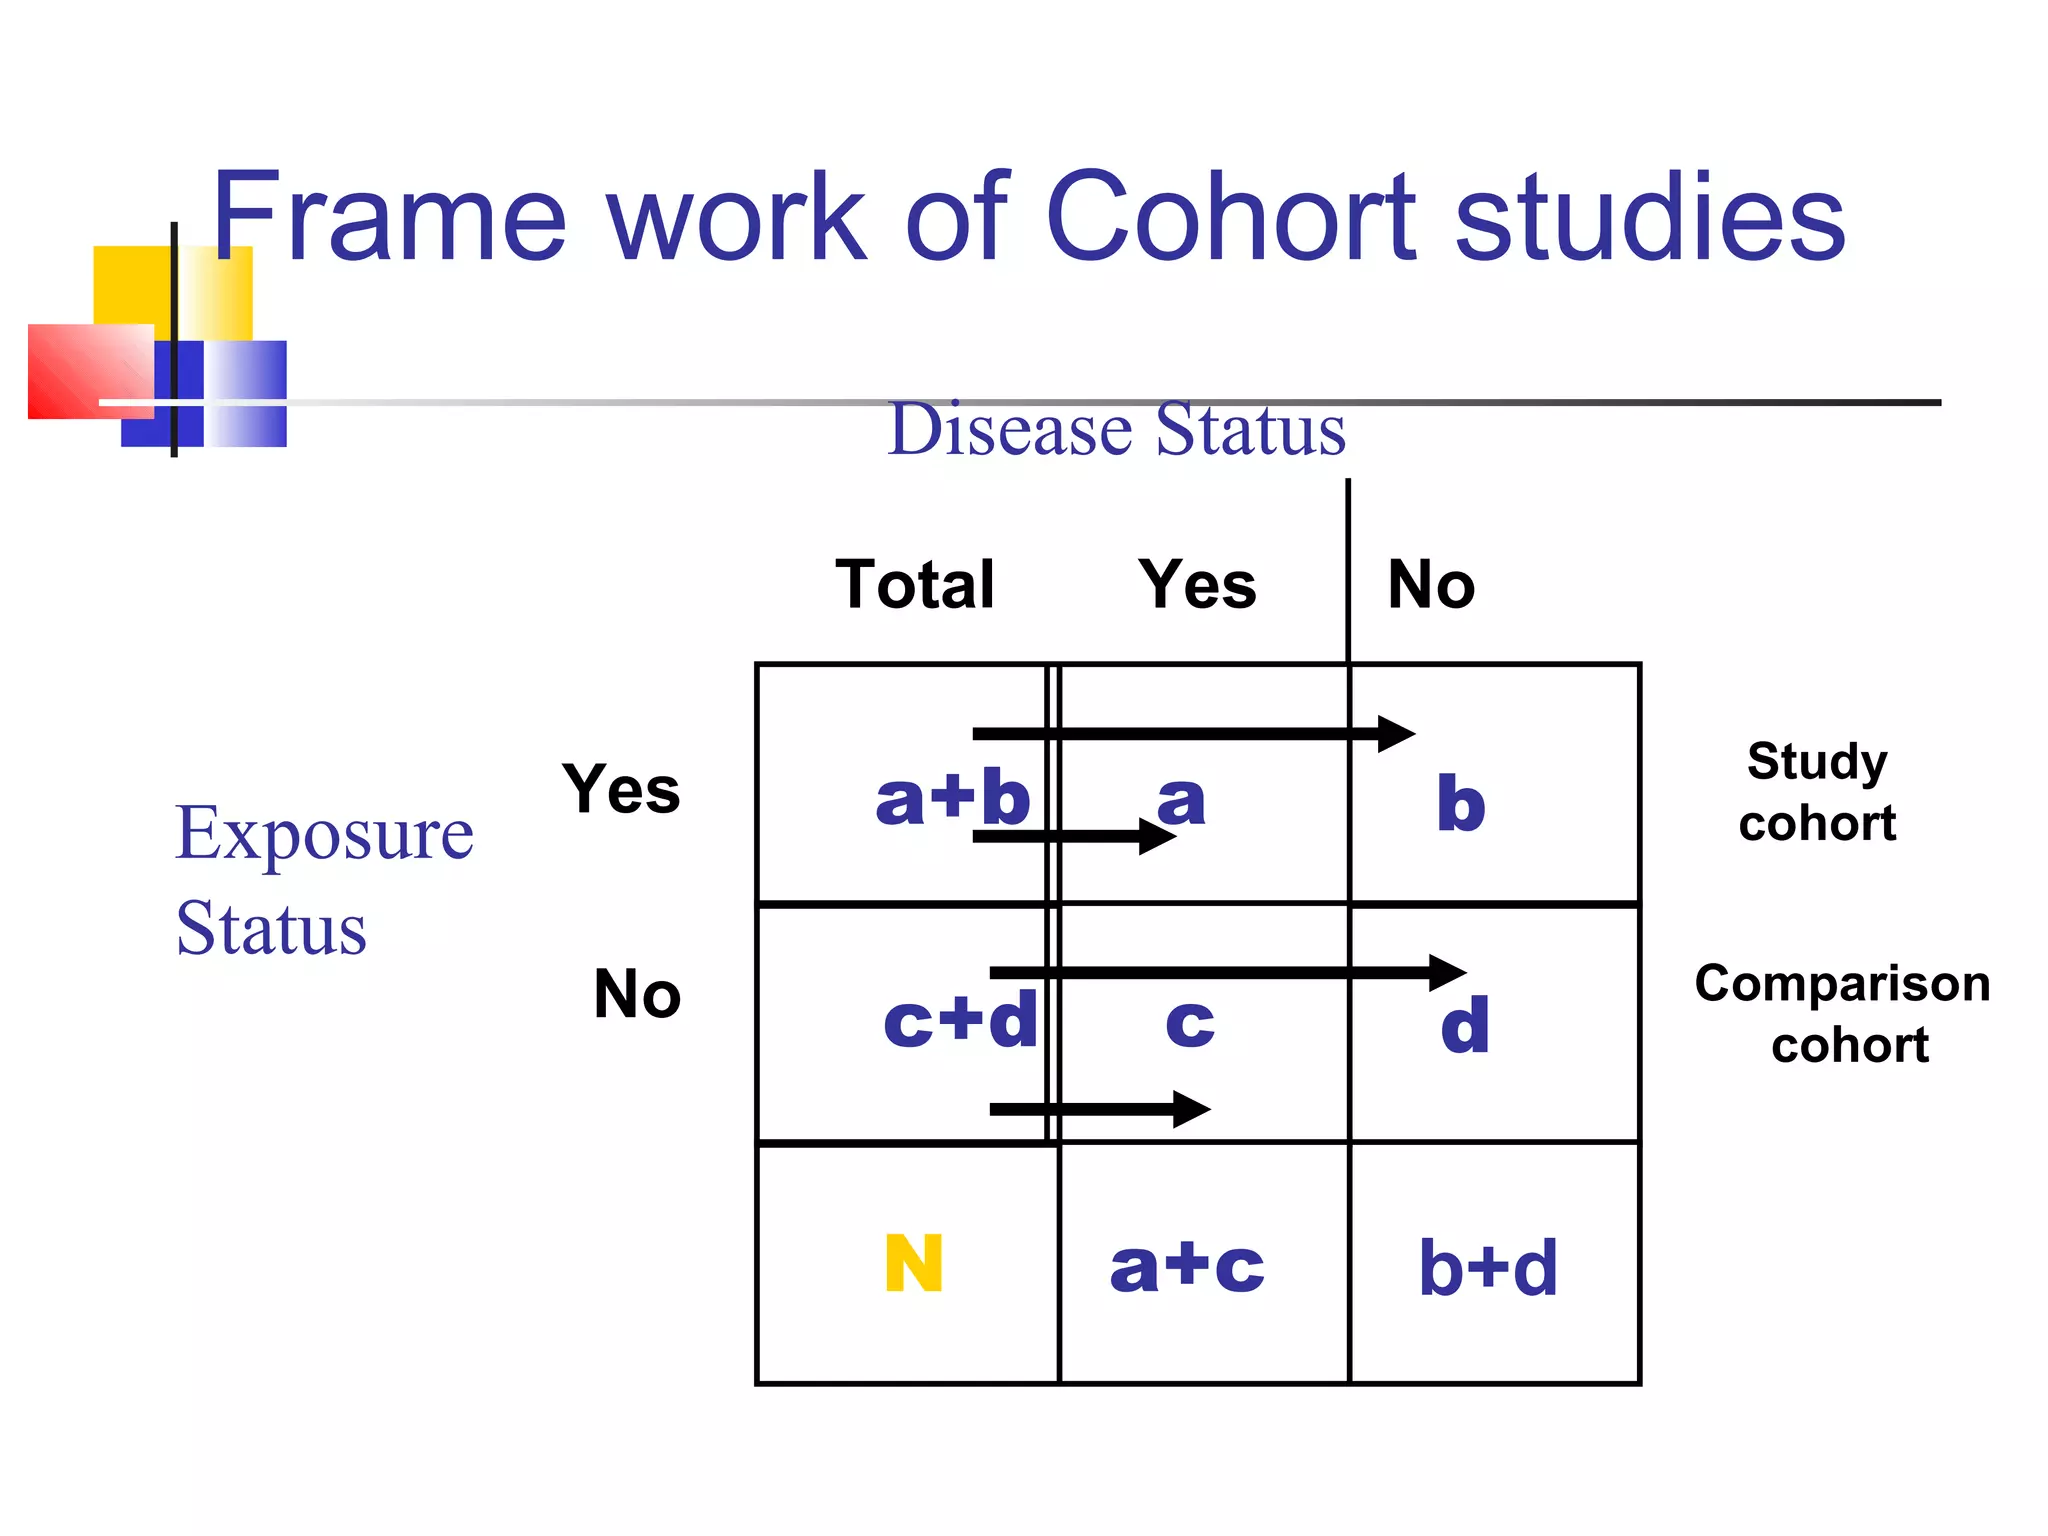
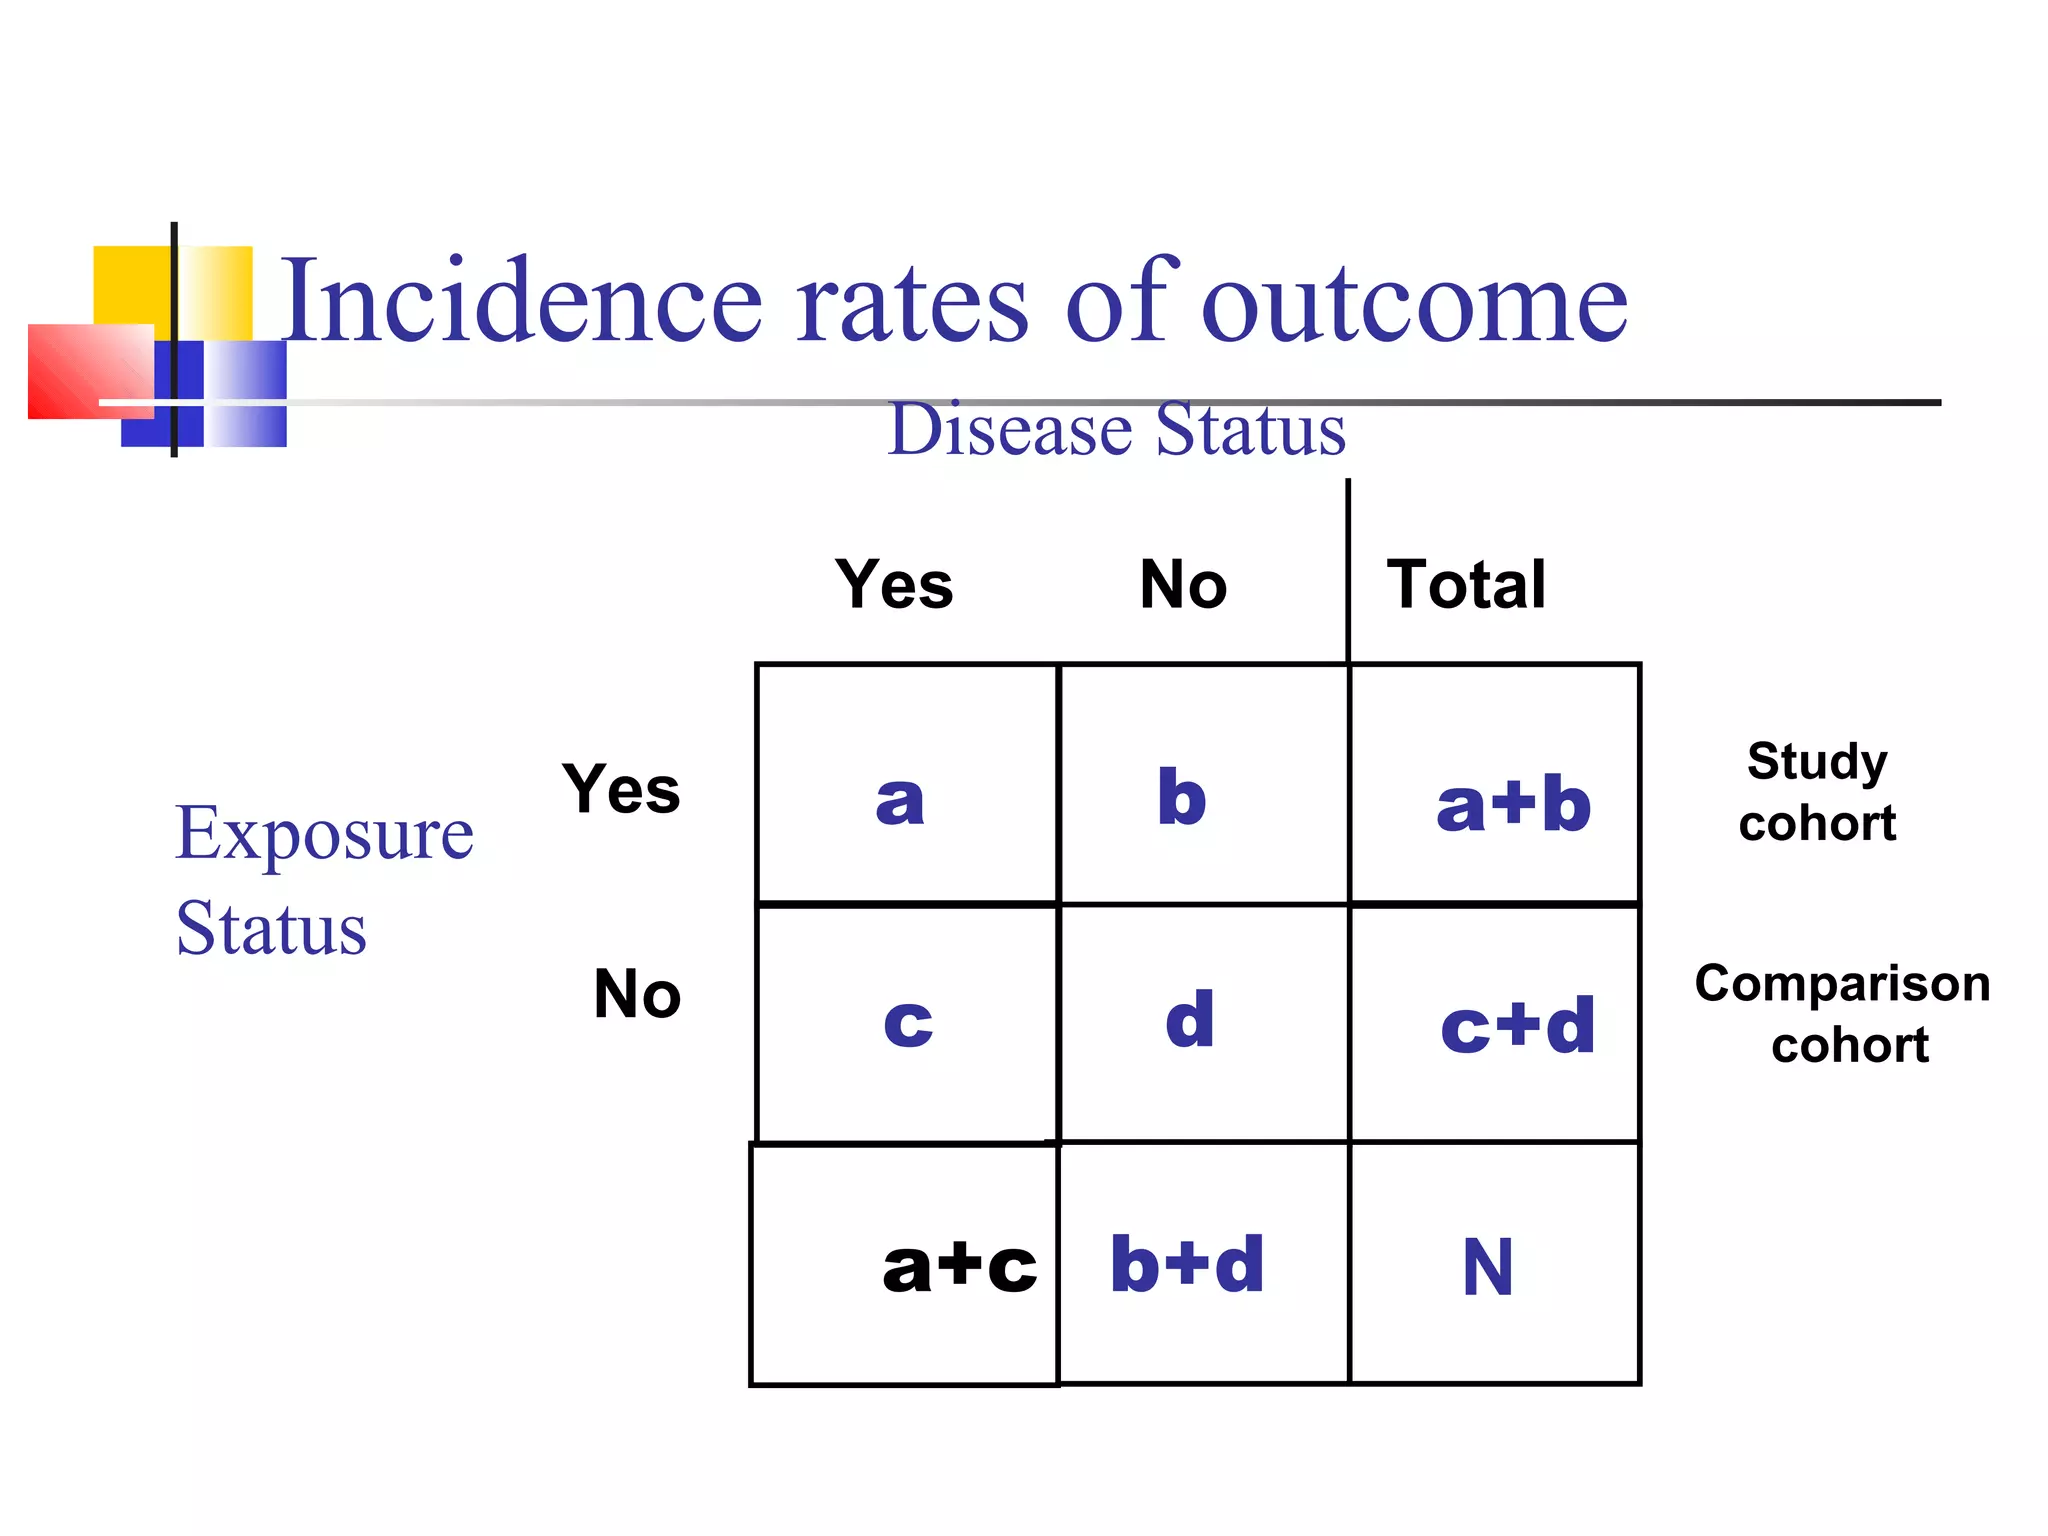
Framework includes disease assessment pre and post exposure, separating study and comparison cohorts.
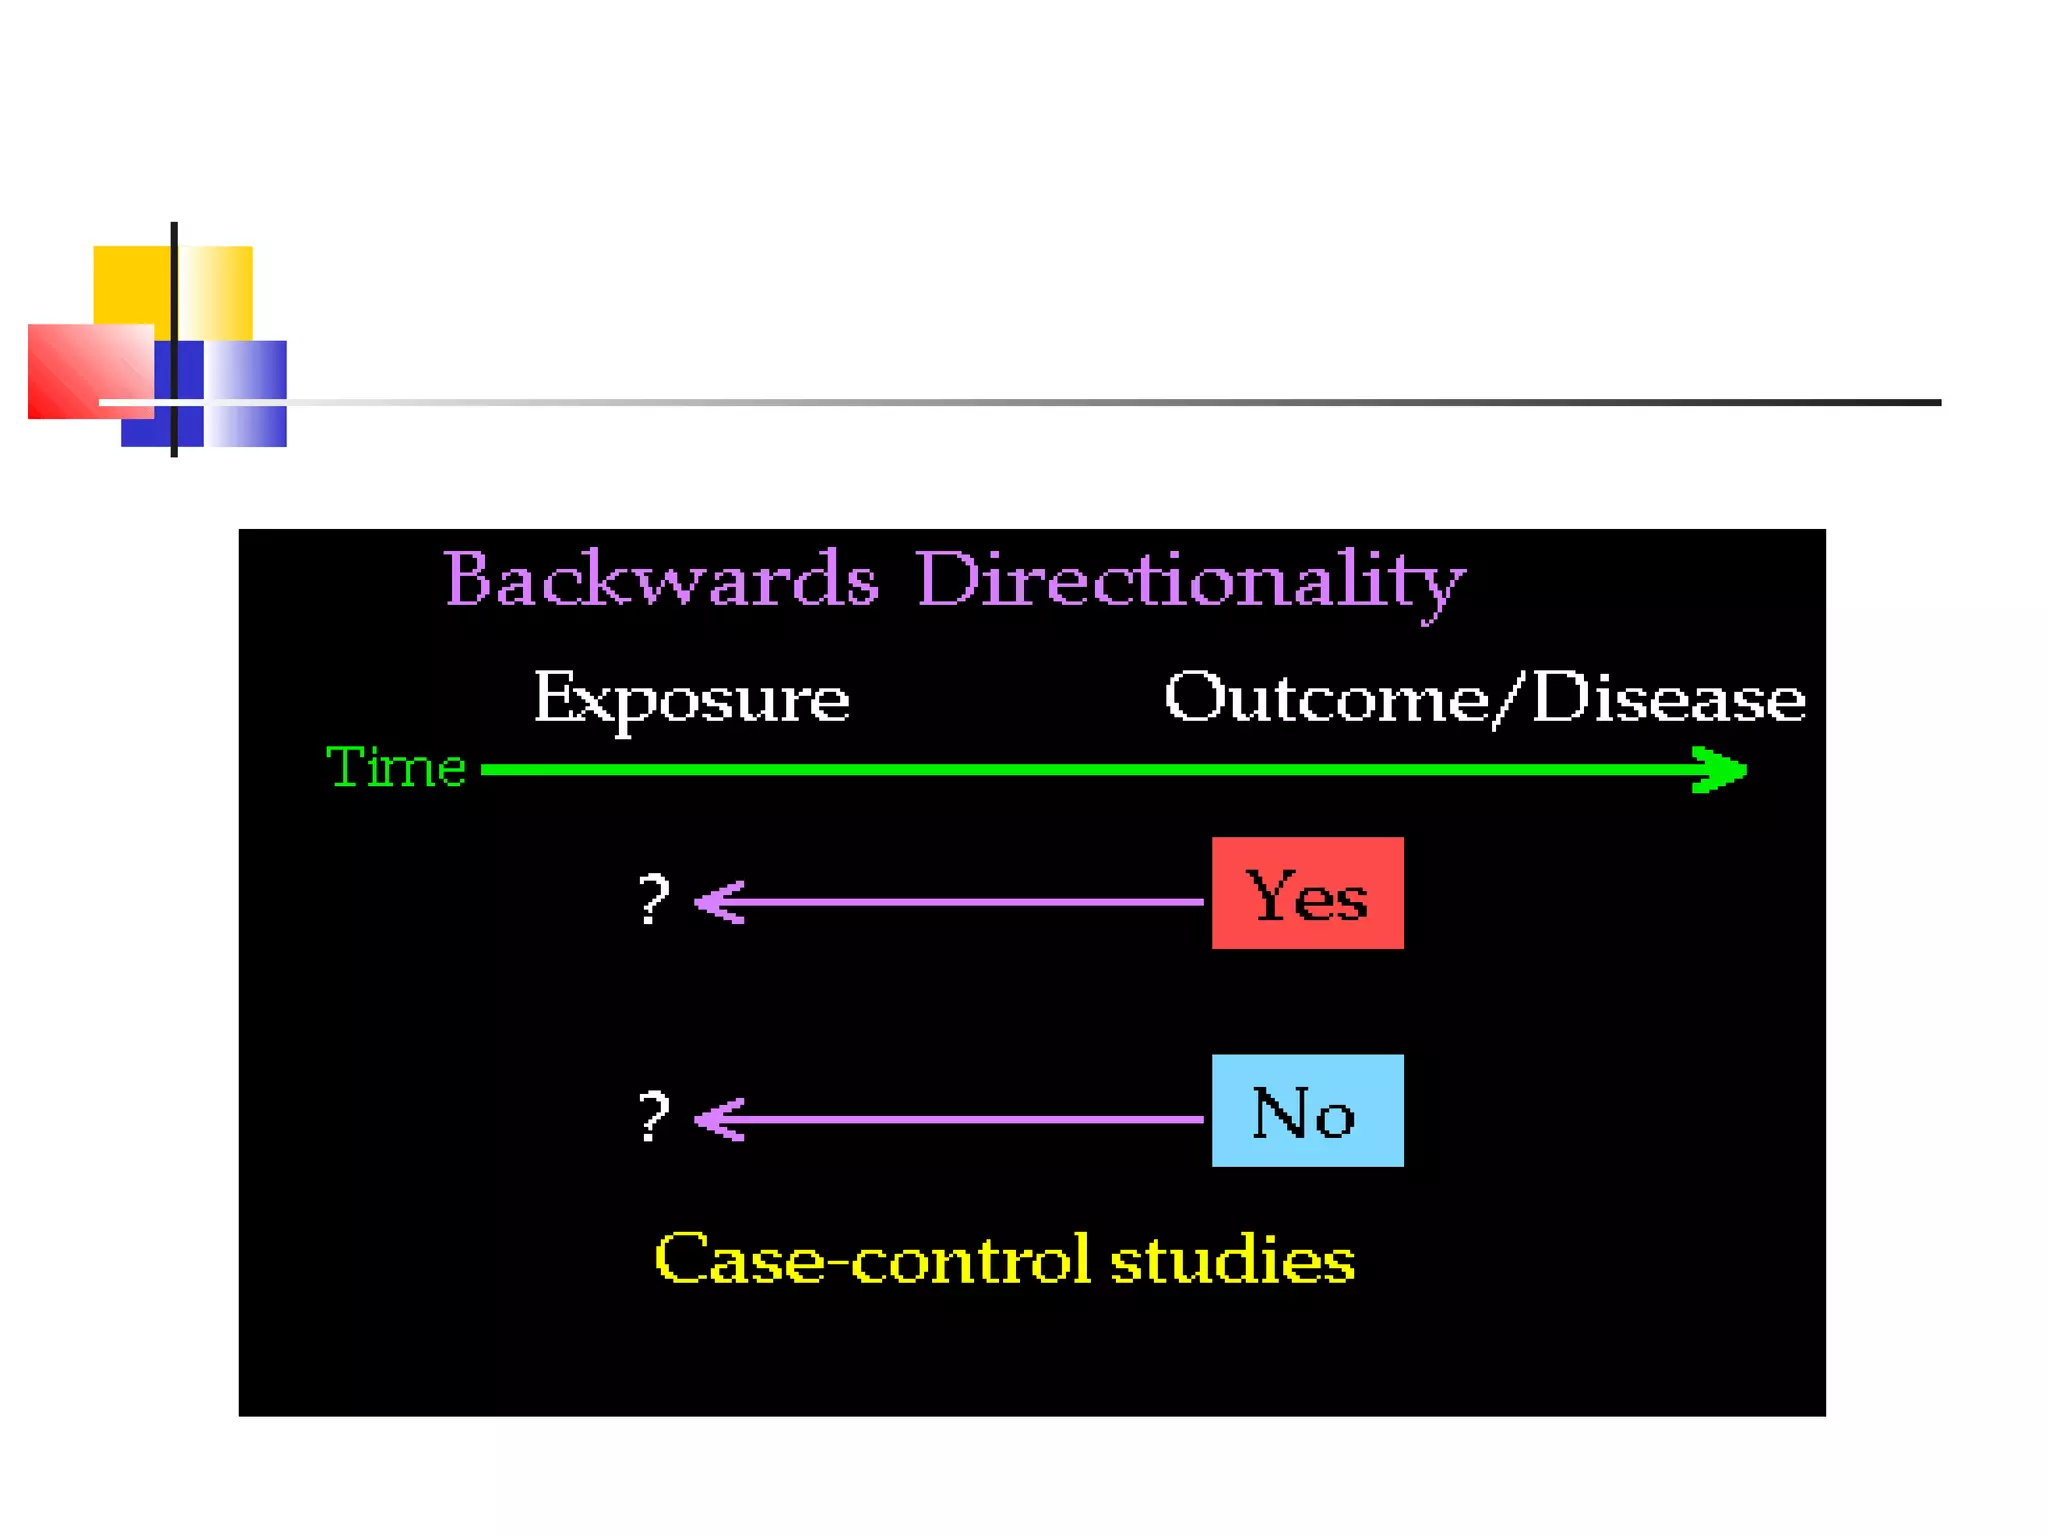
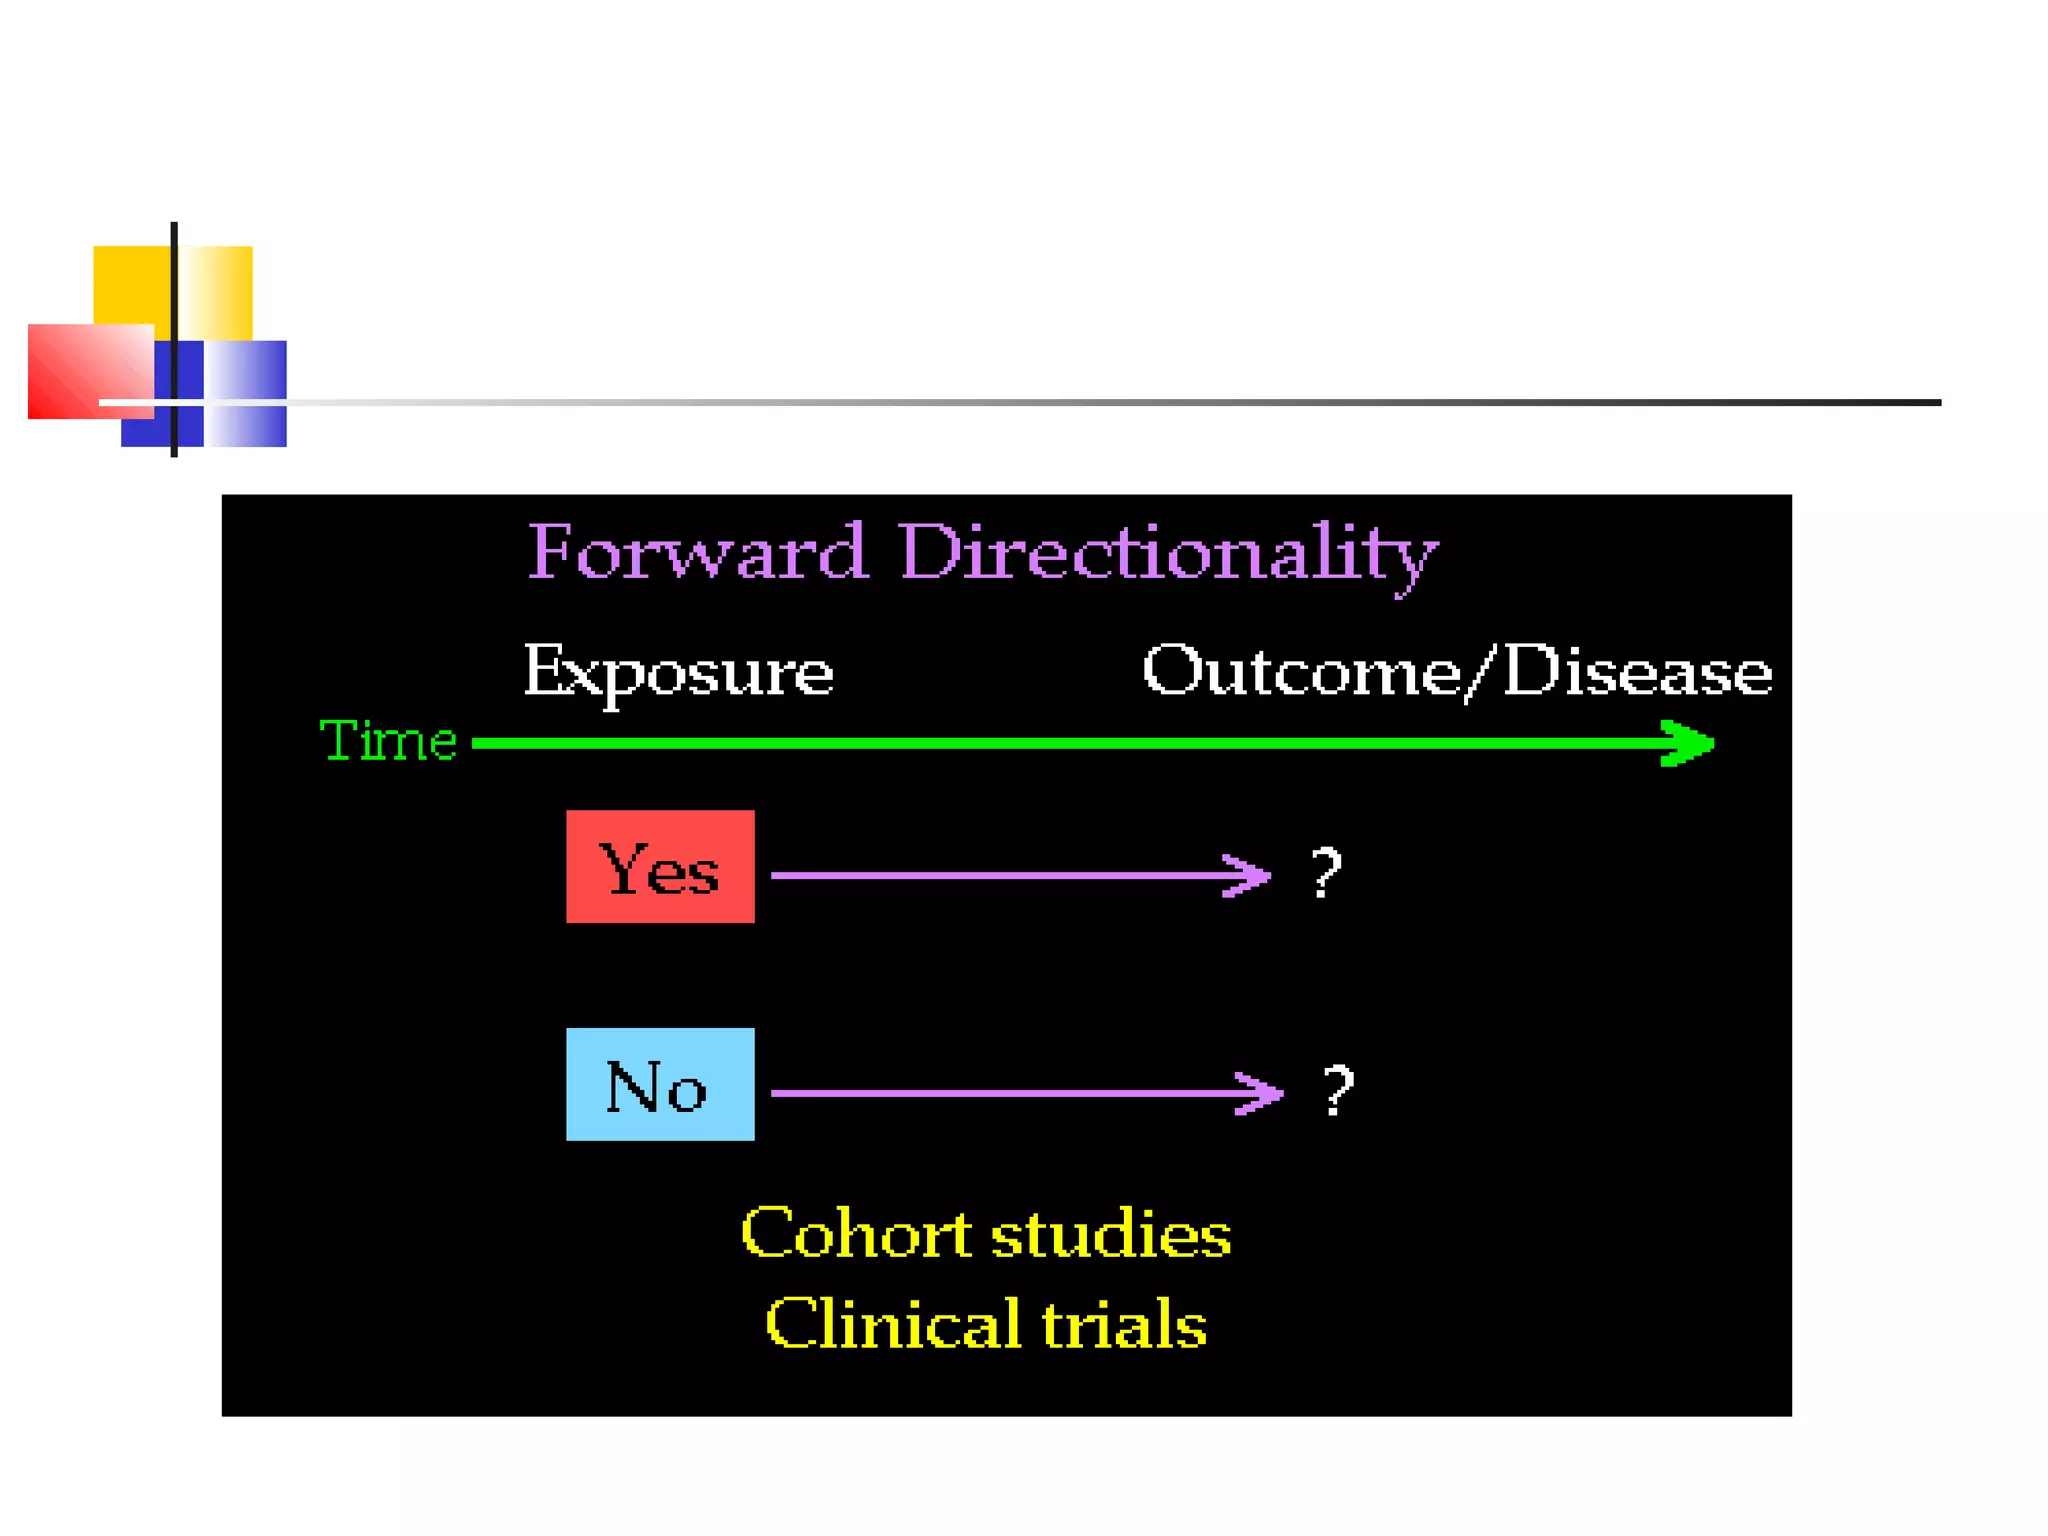
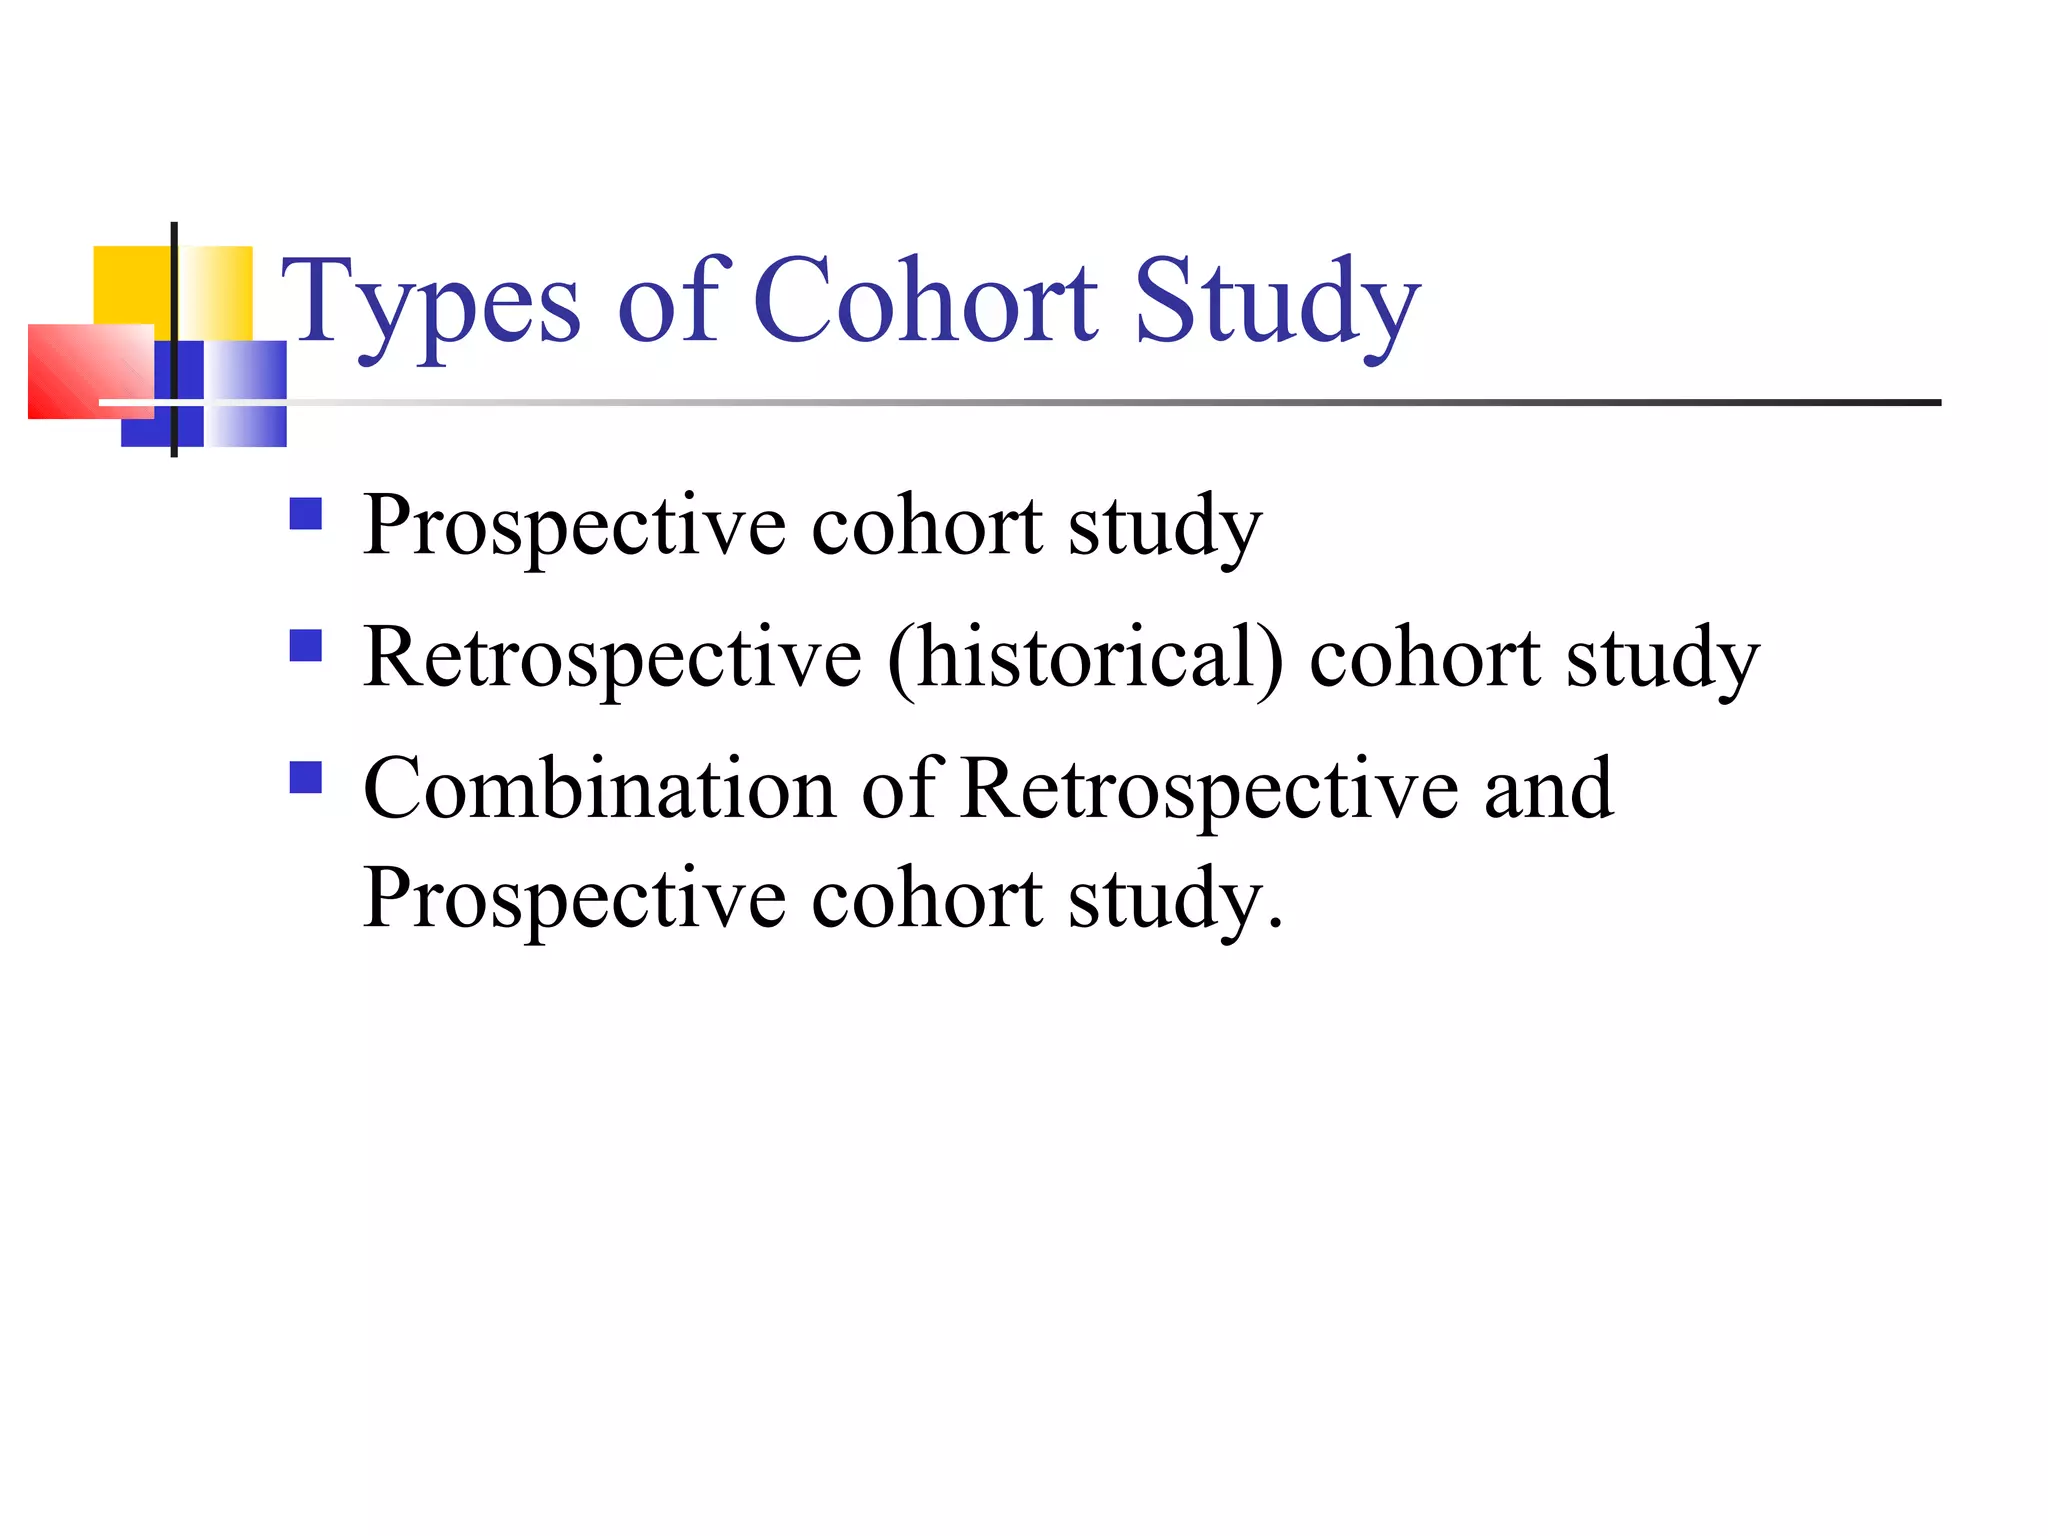
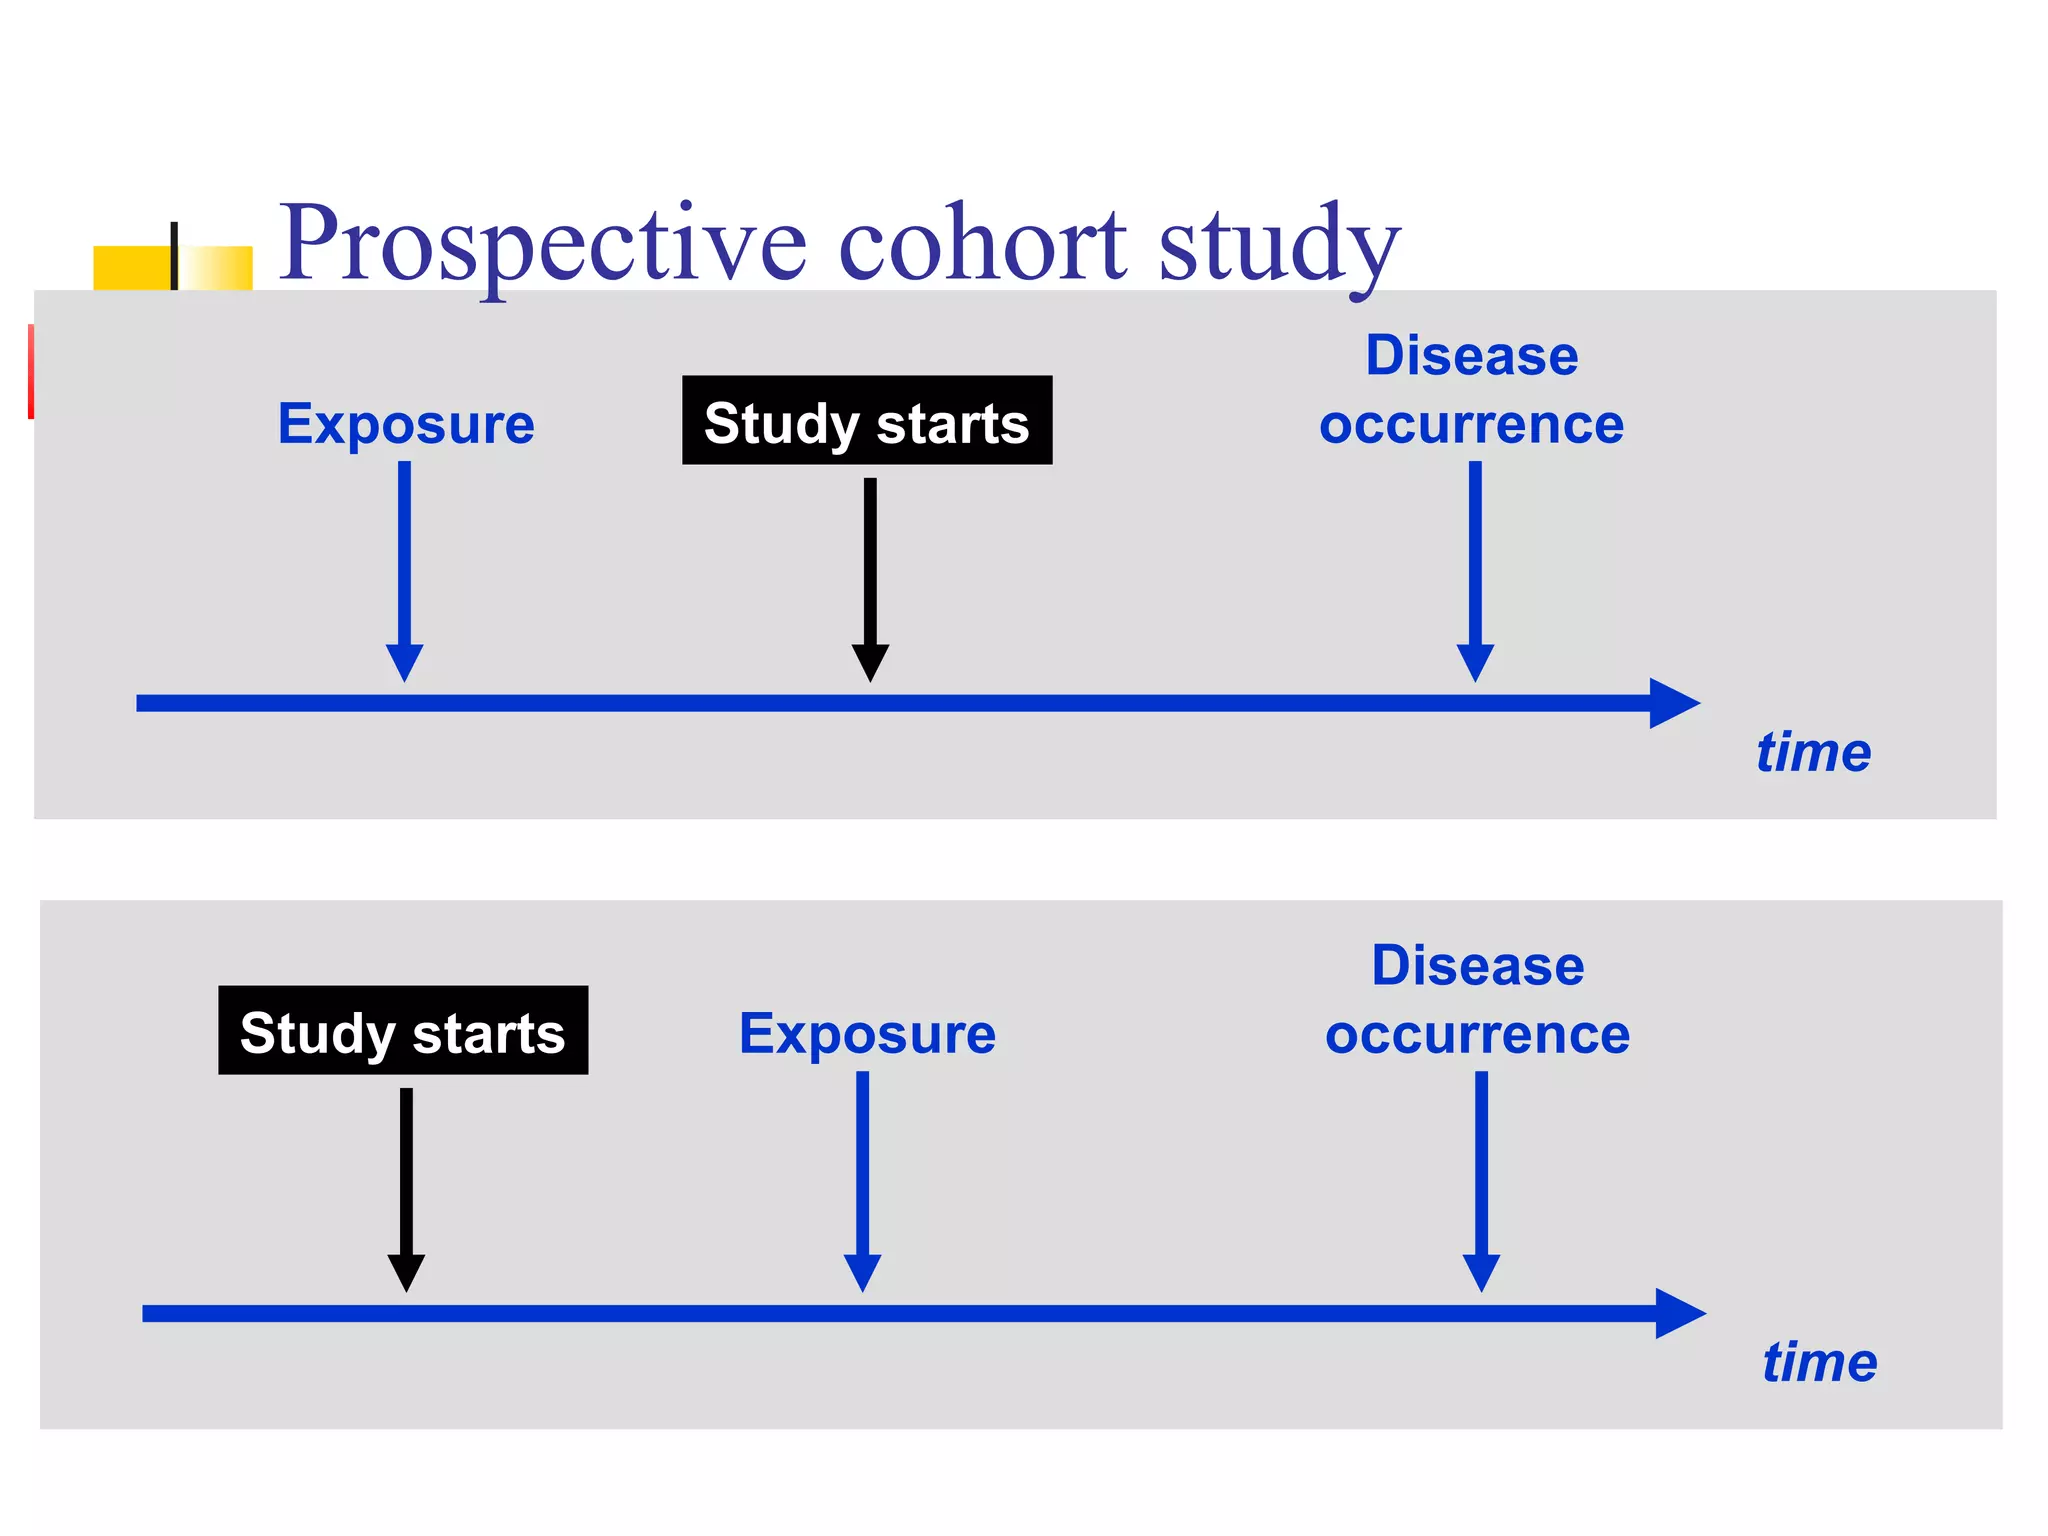
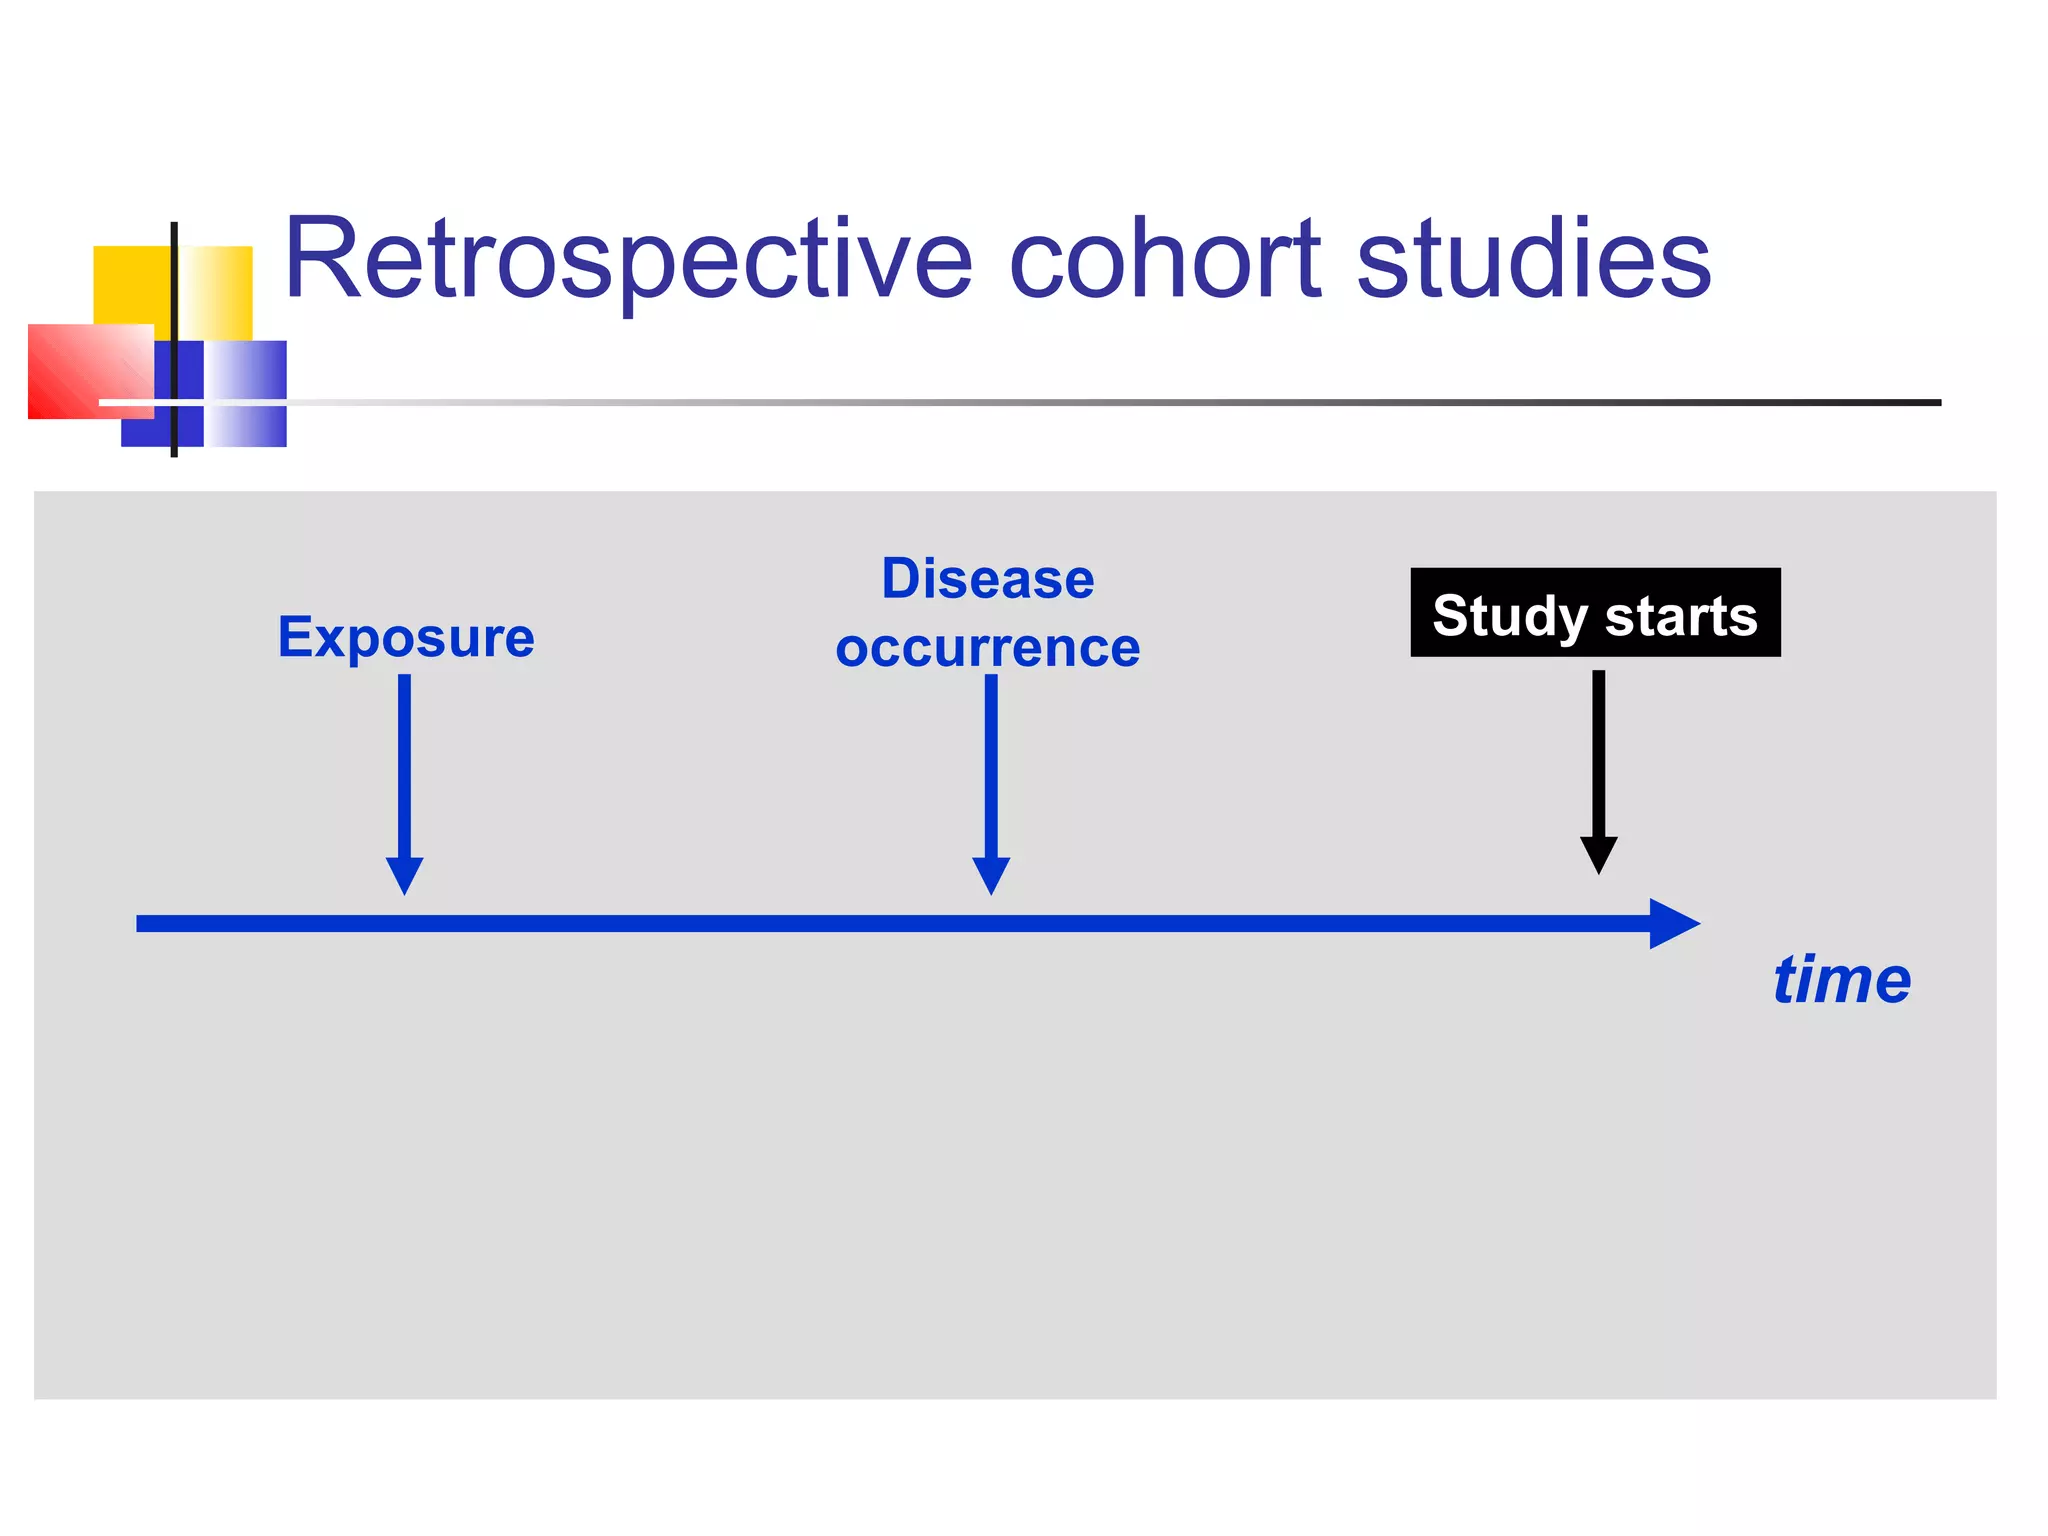
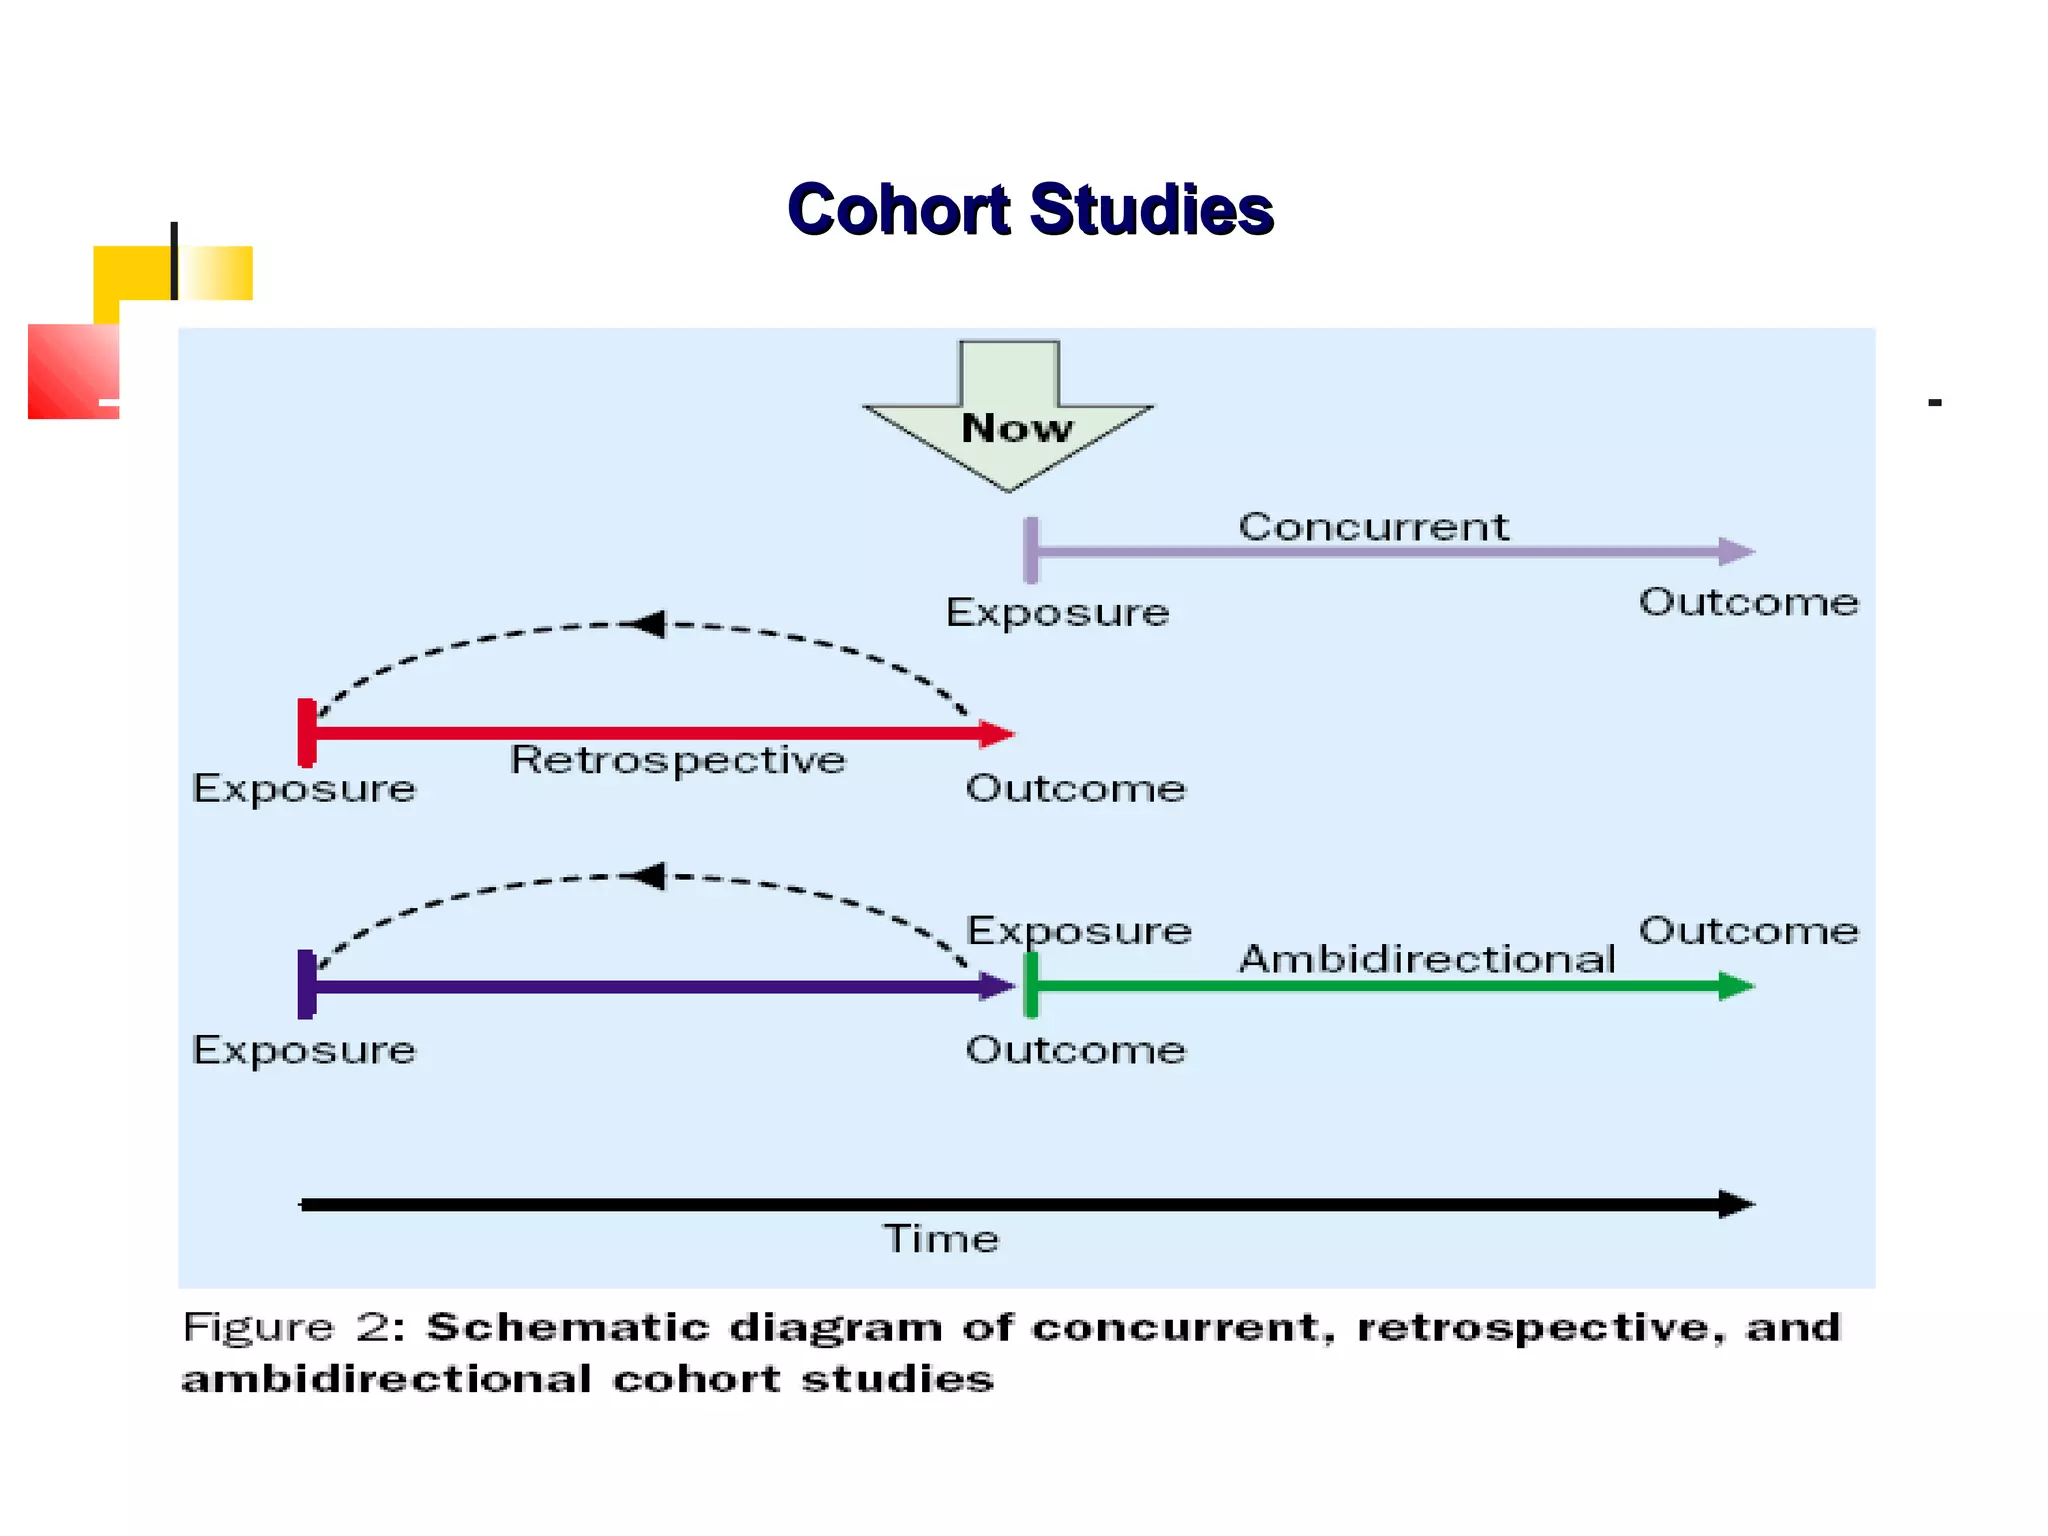
Includes prospective, retrospective, and combined cohort studies with focus on exposure timing.
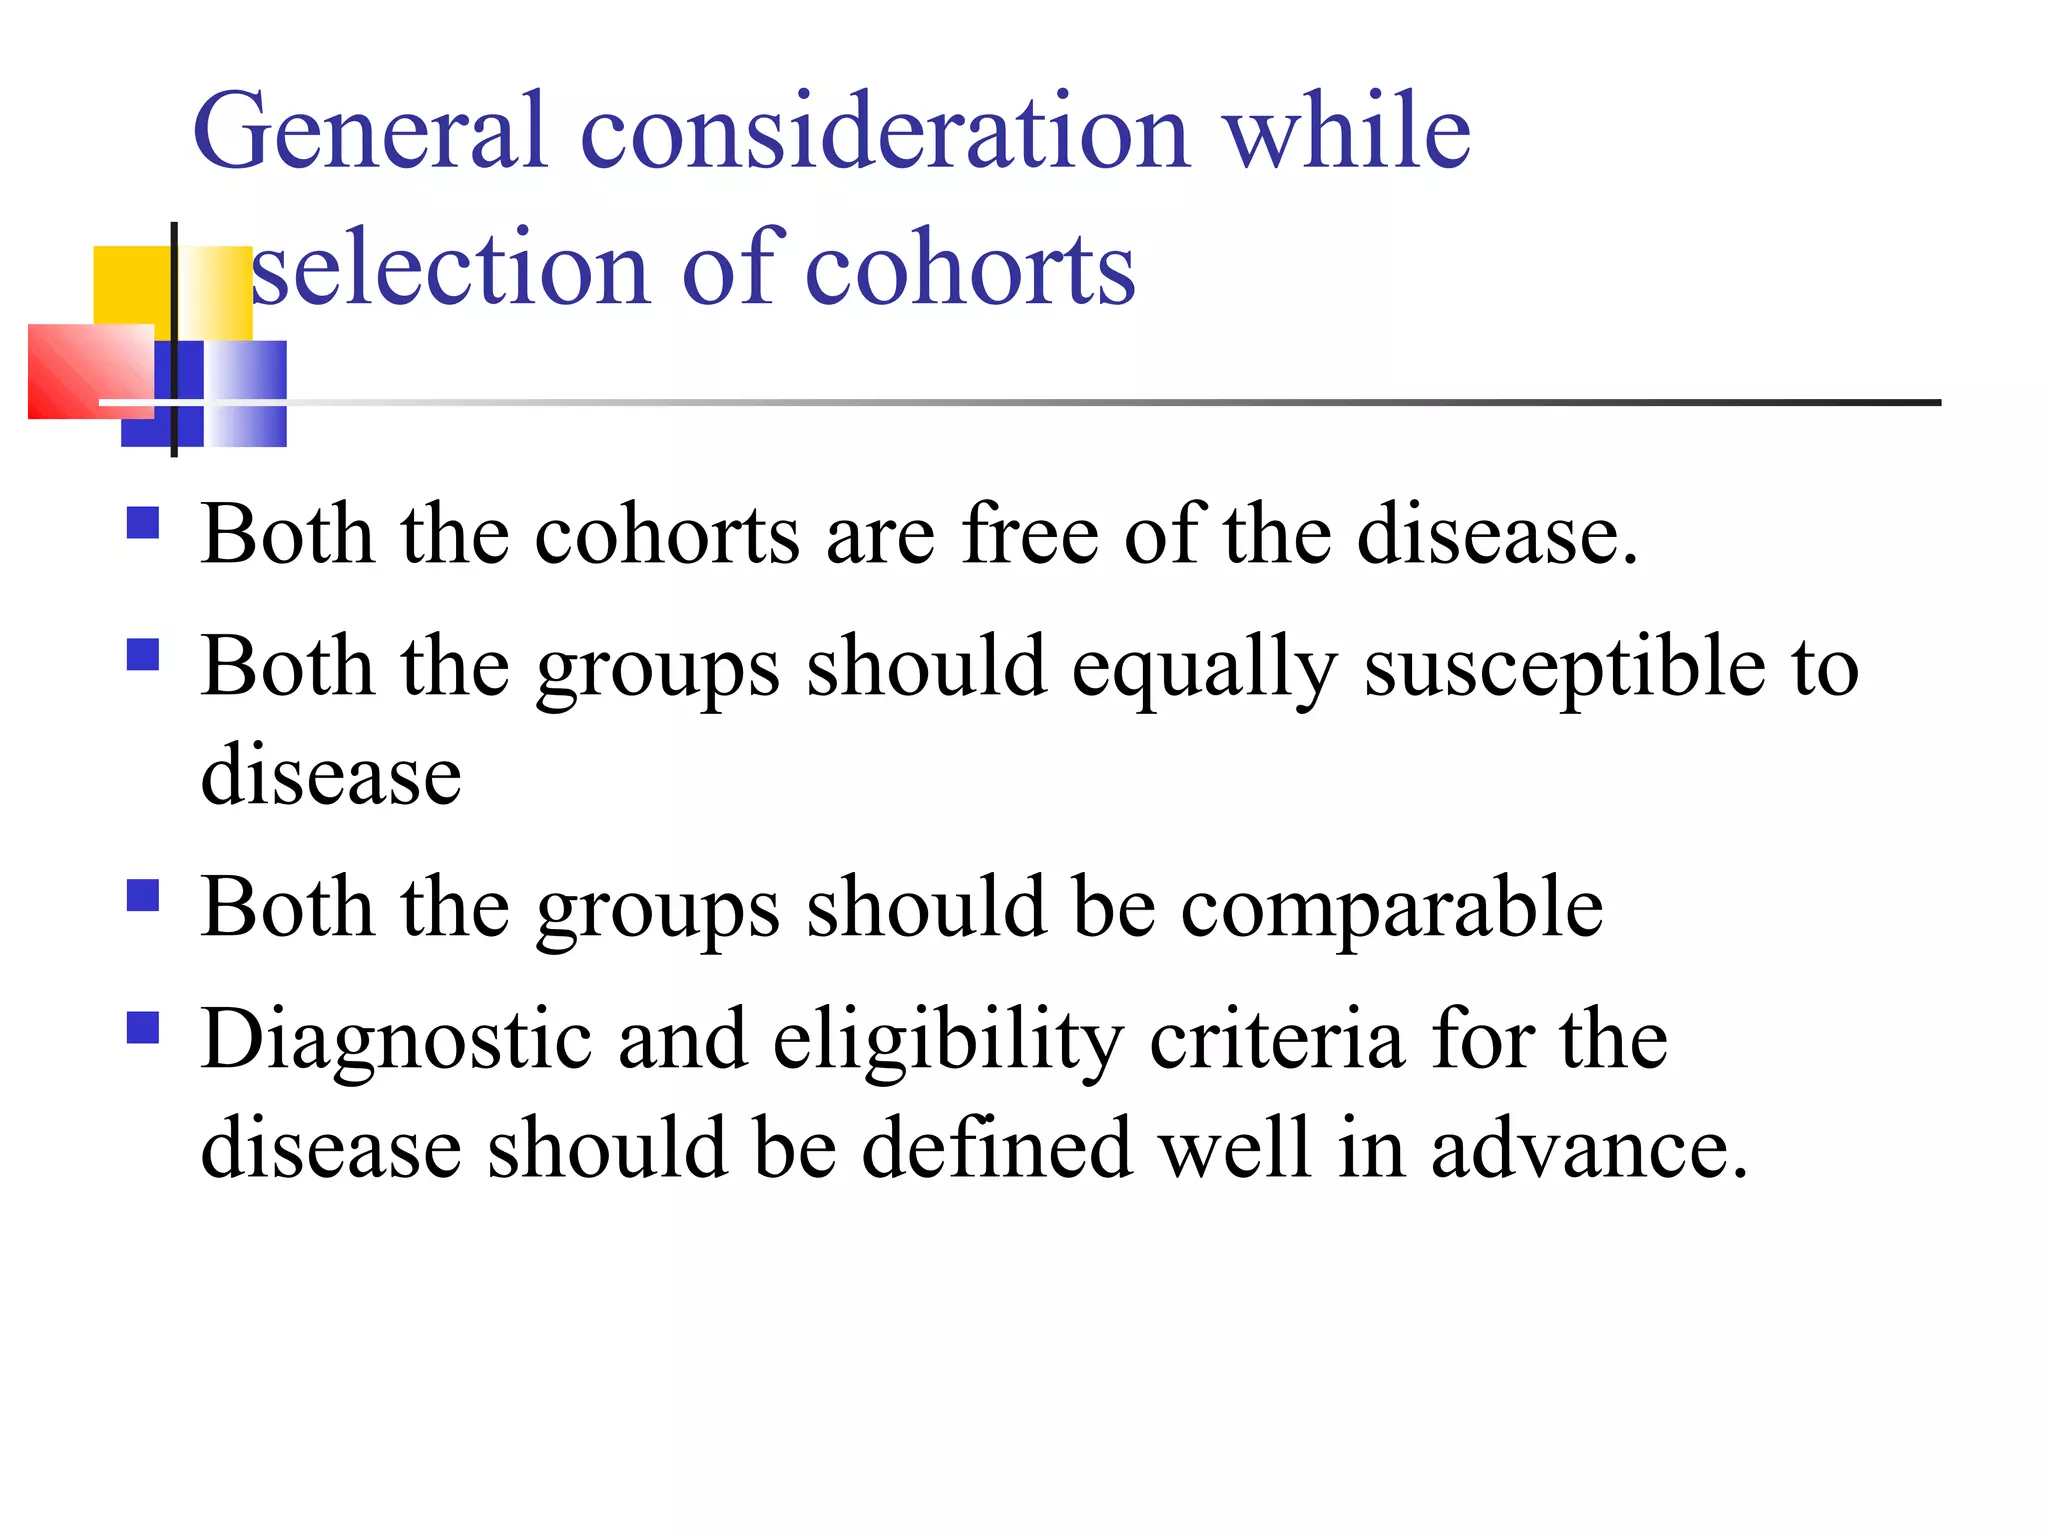
Selecting cohorts involves ensuring comparability and absence of disease at study initiation.
Key elements include selection methods, data acquisition, follow-up processes, and analysis.
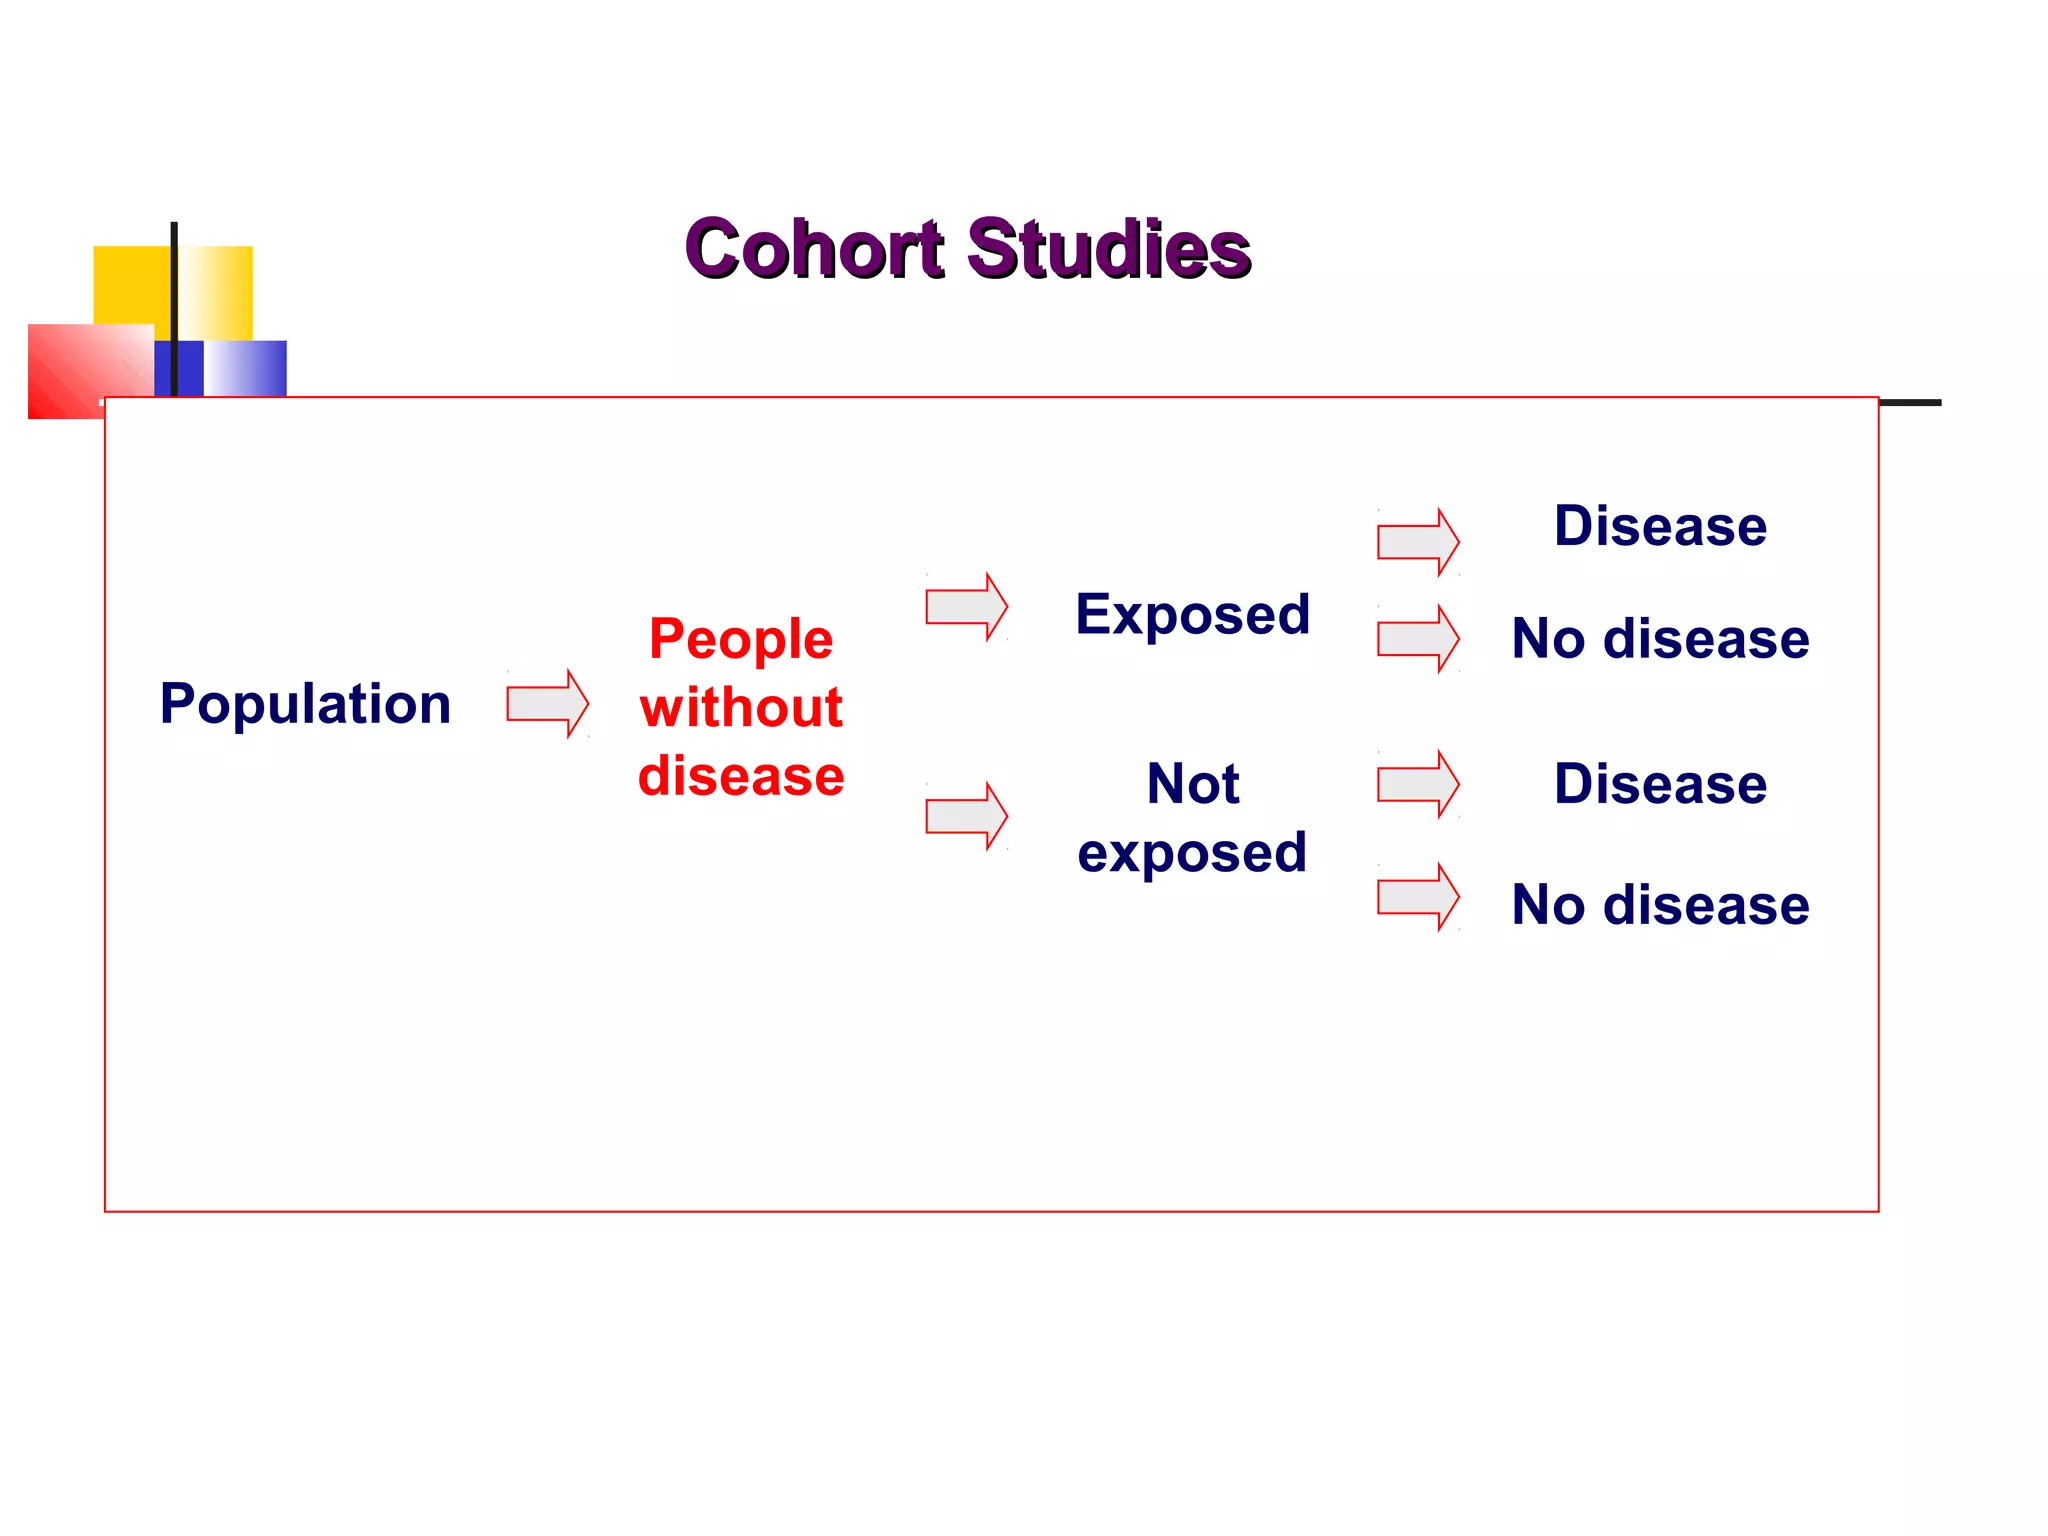
Methods include surveys and interviews for exposure data, classifying cohorts as exposed/non-exposed.
Comparison groups can be internal or external to better evaluate exposure's effect on disease.
Follow-up is critical for data collection and outcome assessment; loss to follow-up is a major challenge.
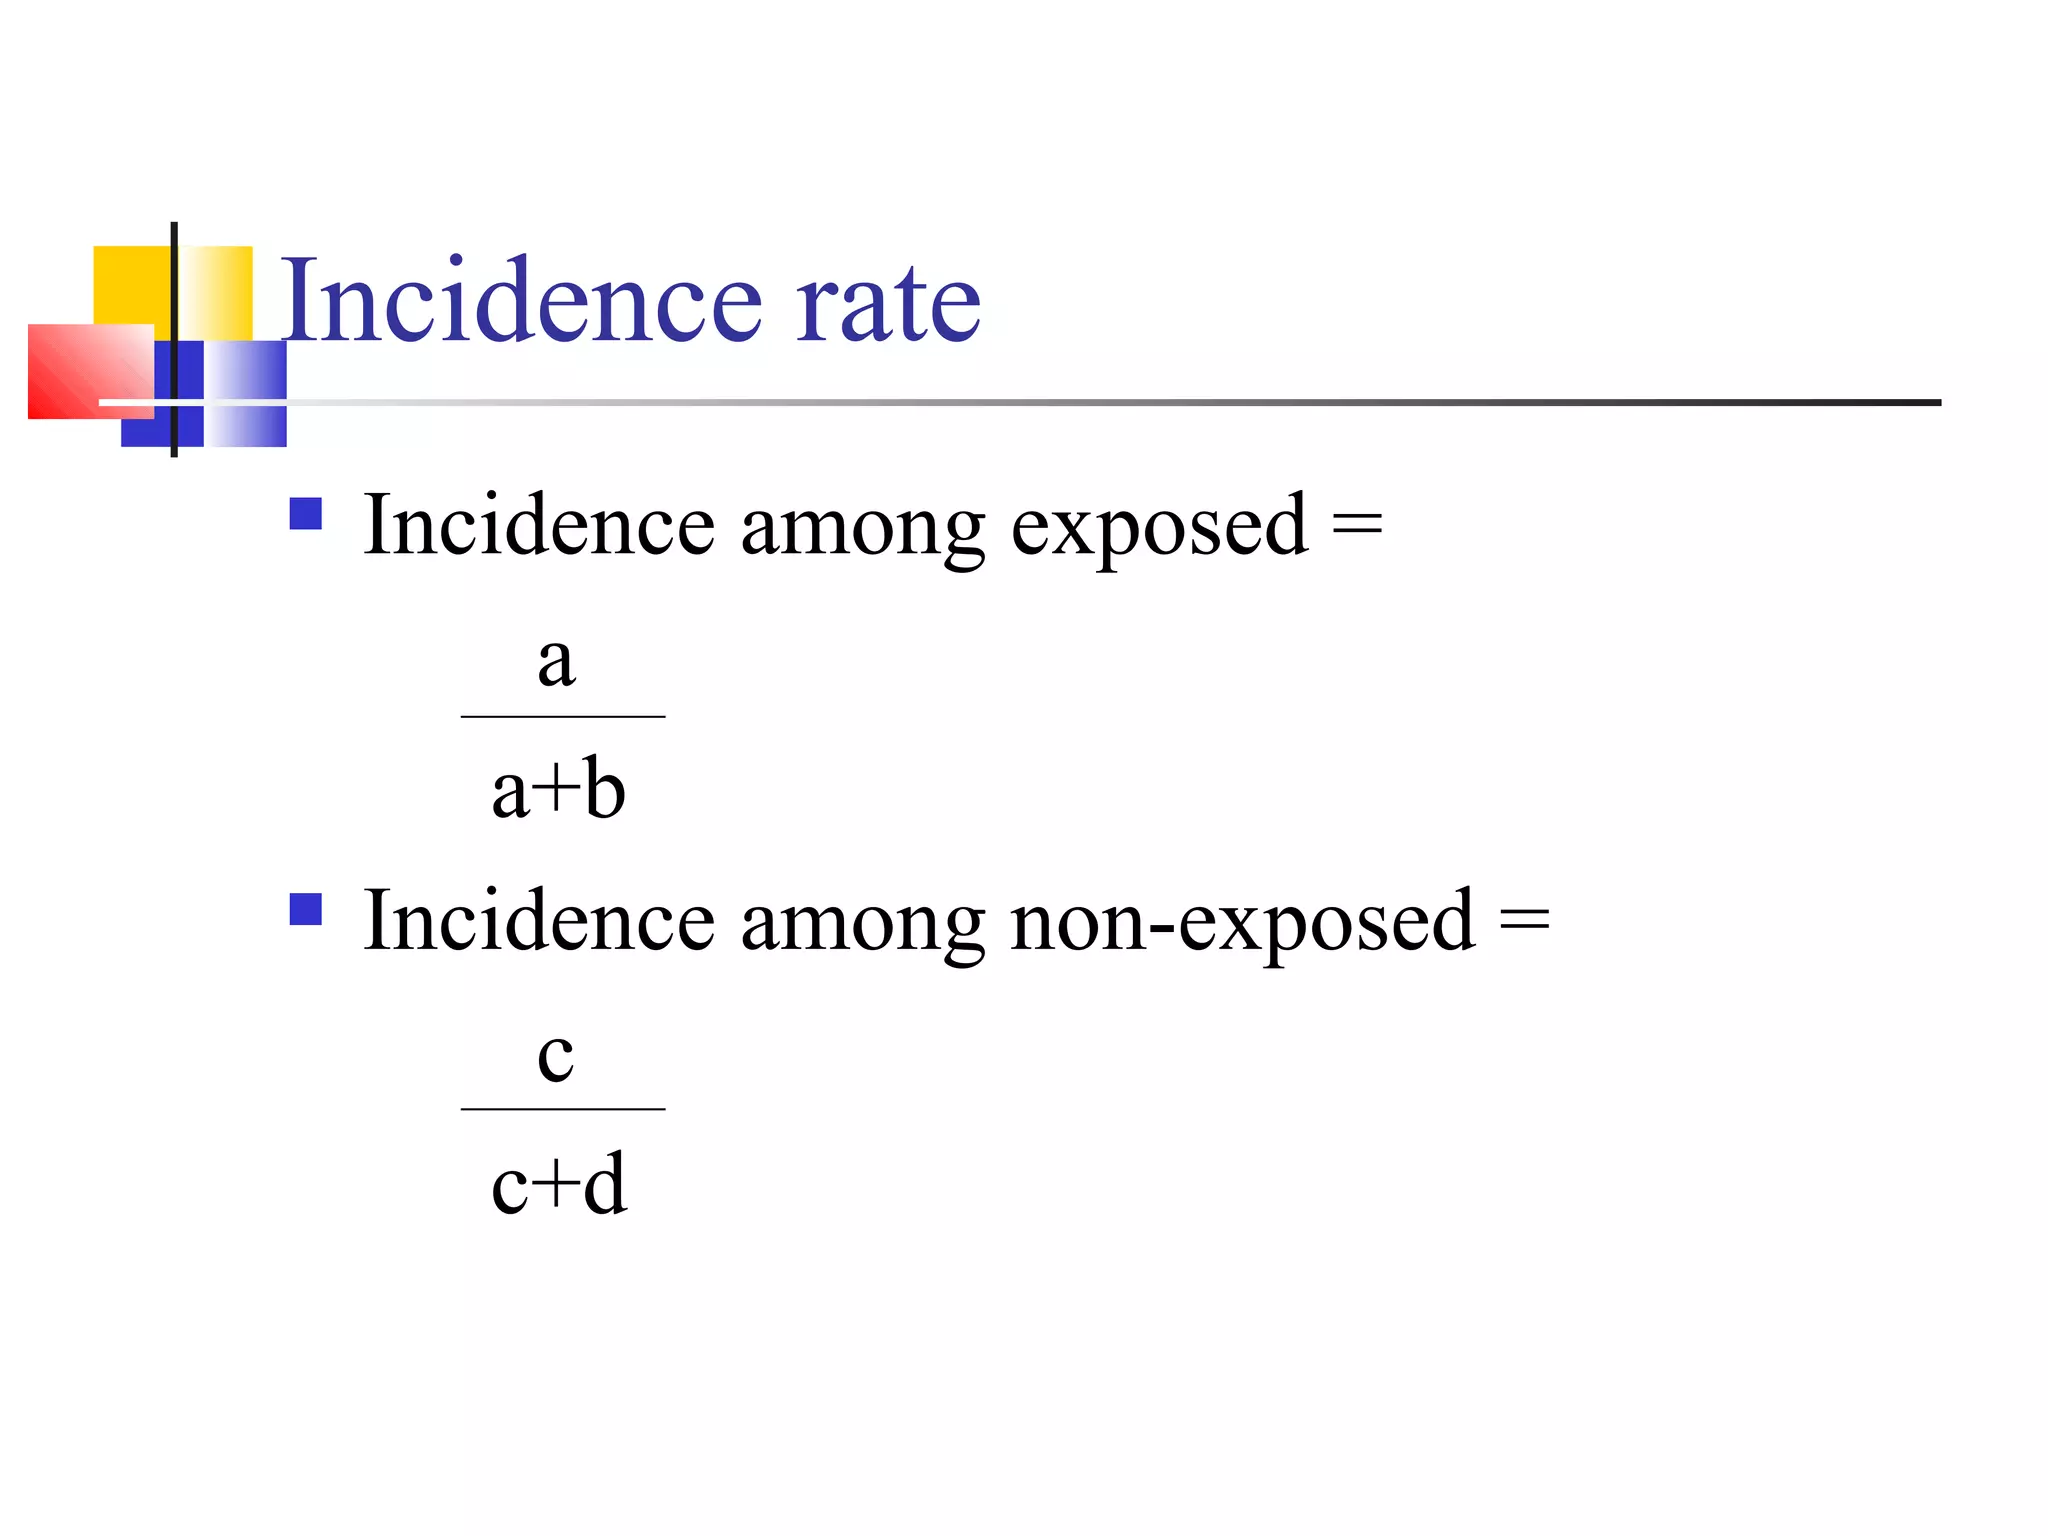
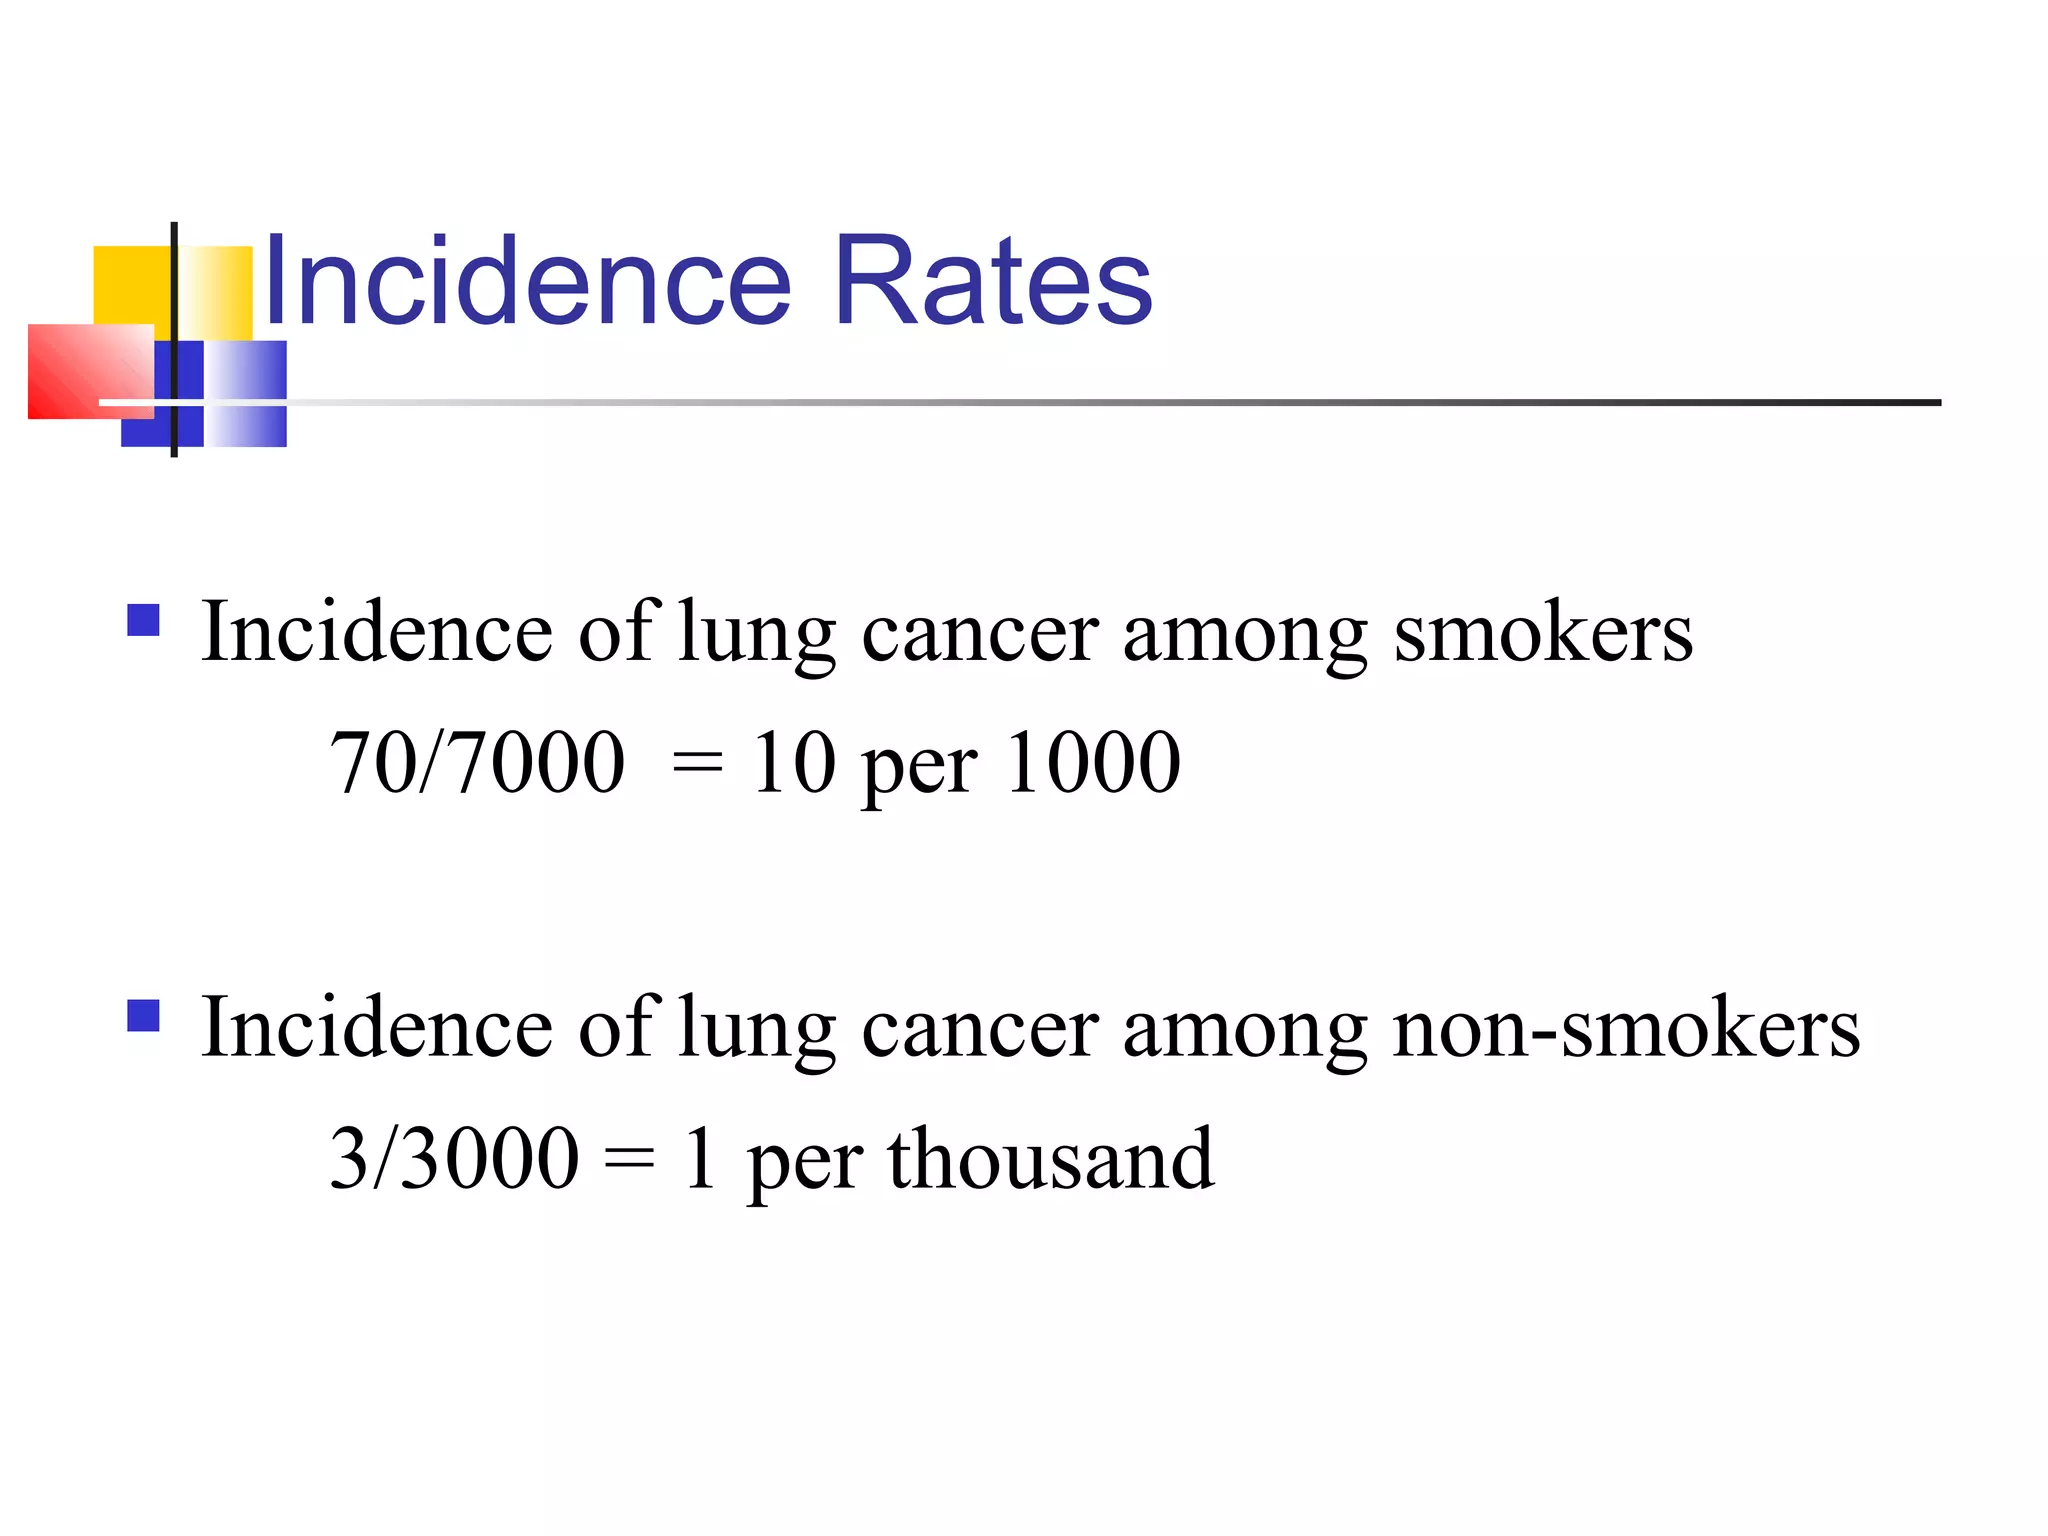
Analysis entails calculating incidence rates among exposed and non-exposed groups.
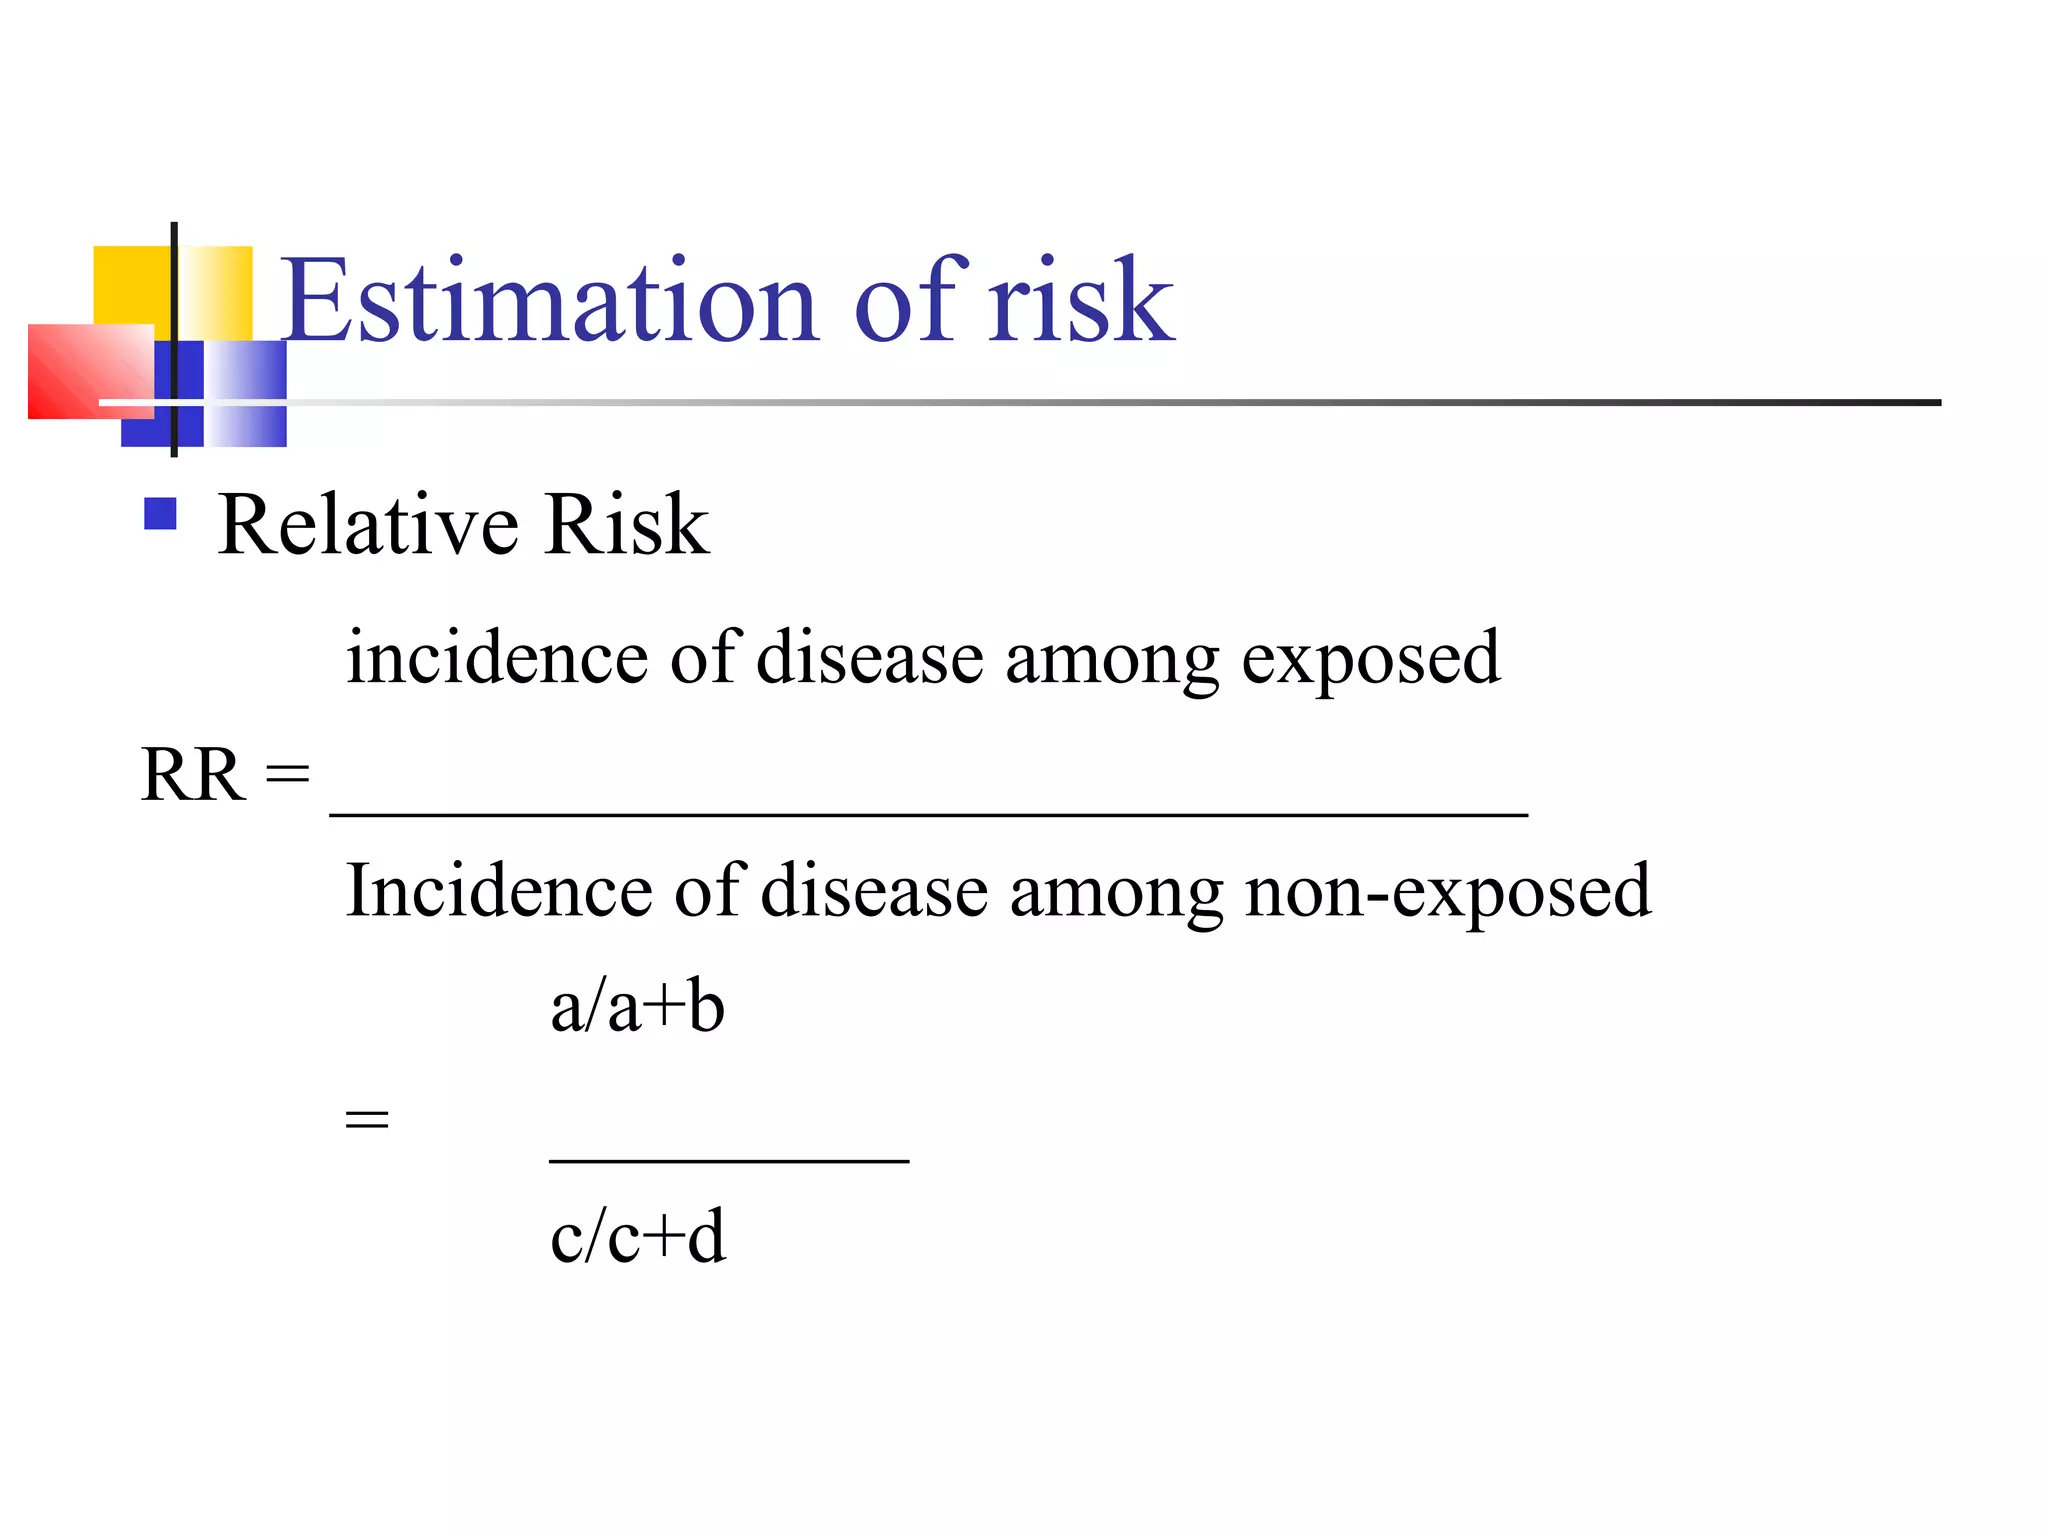
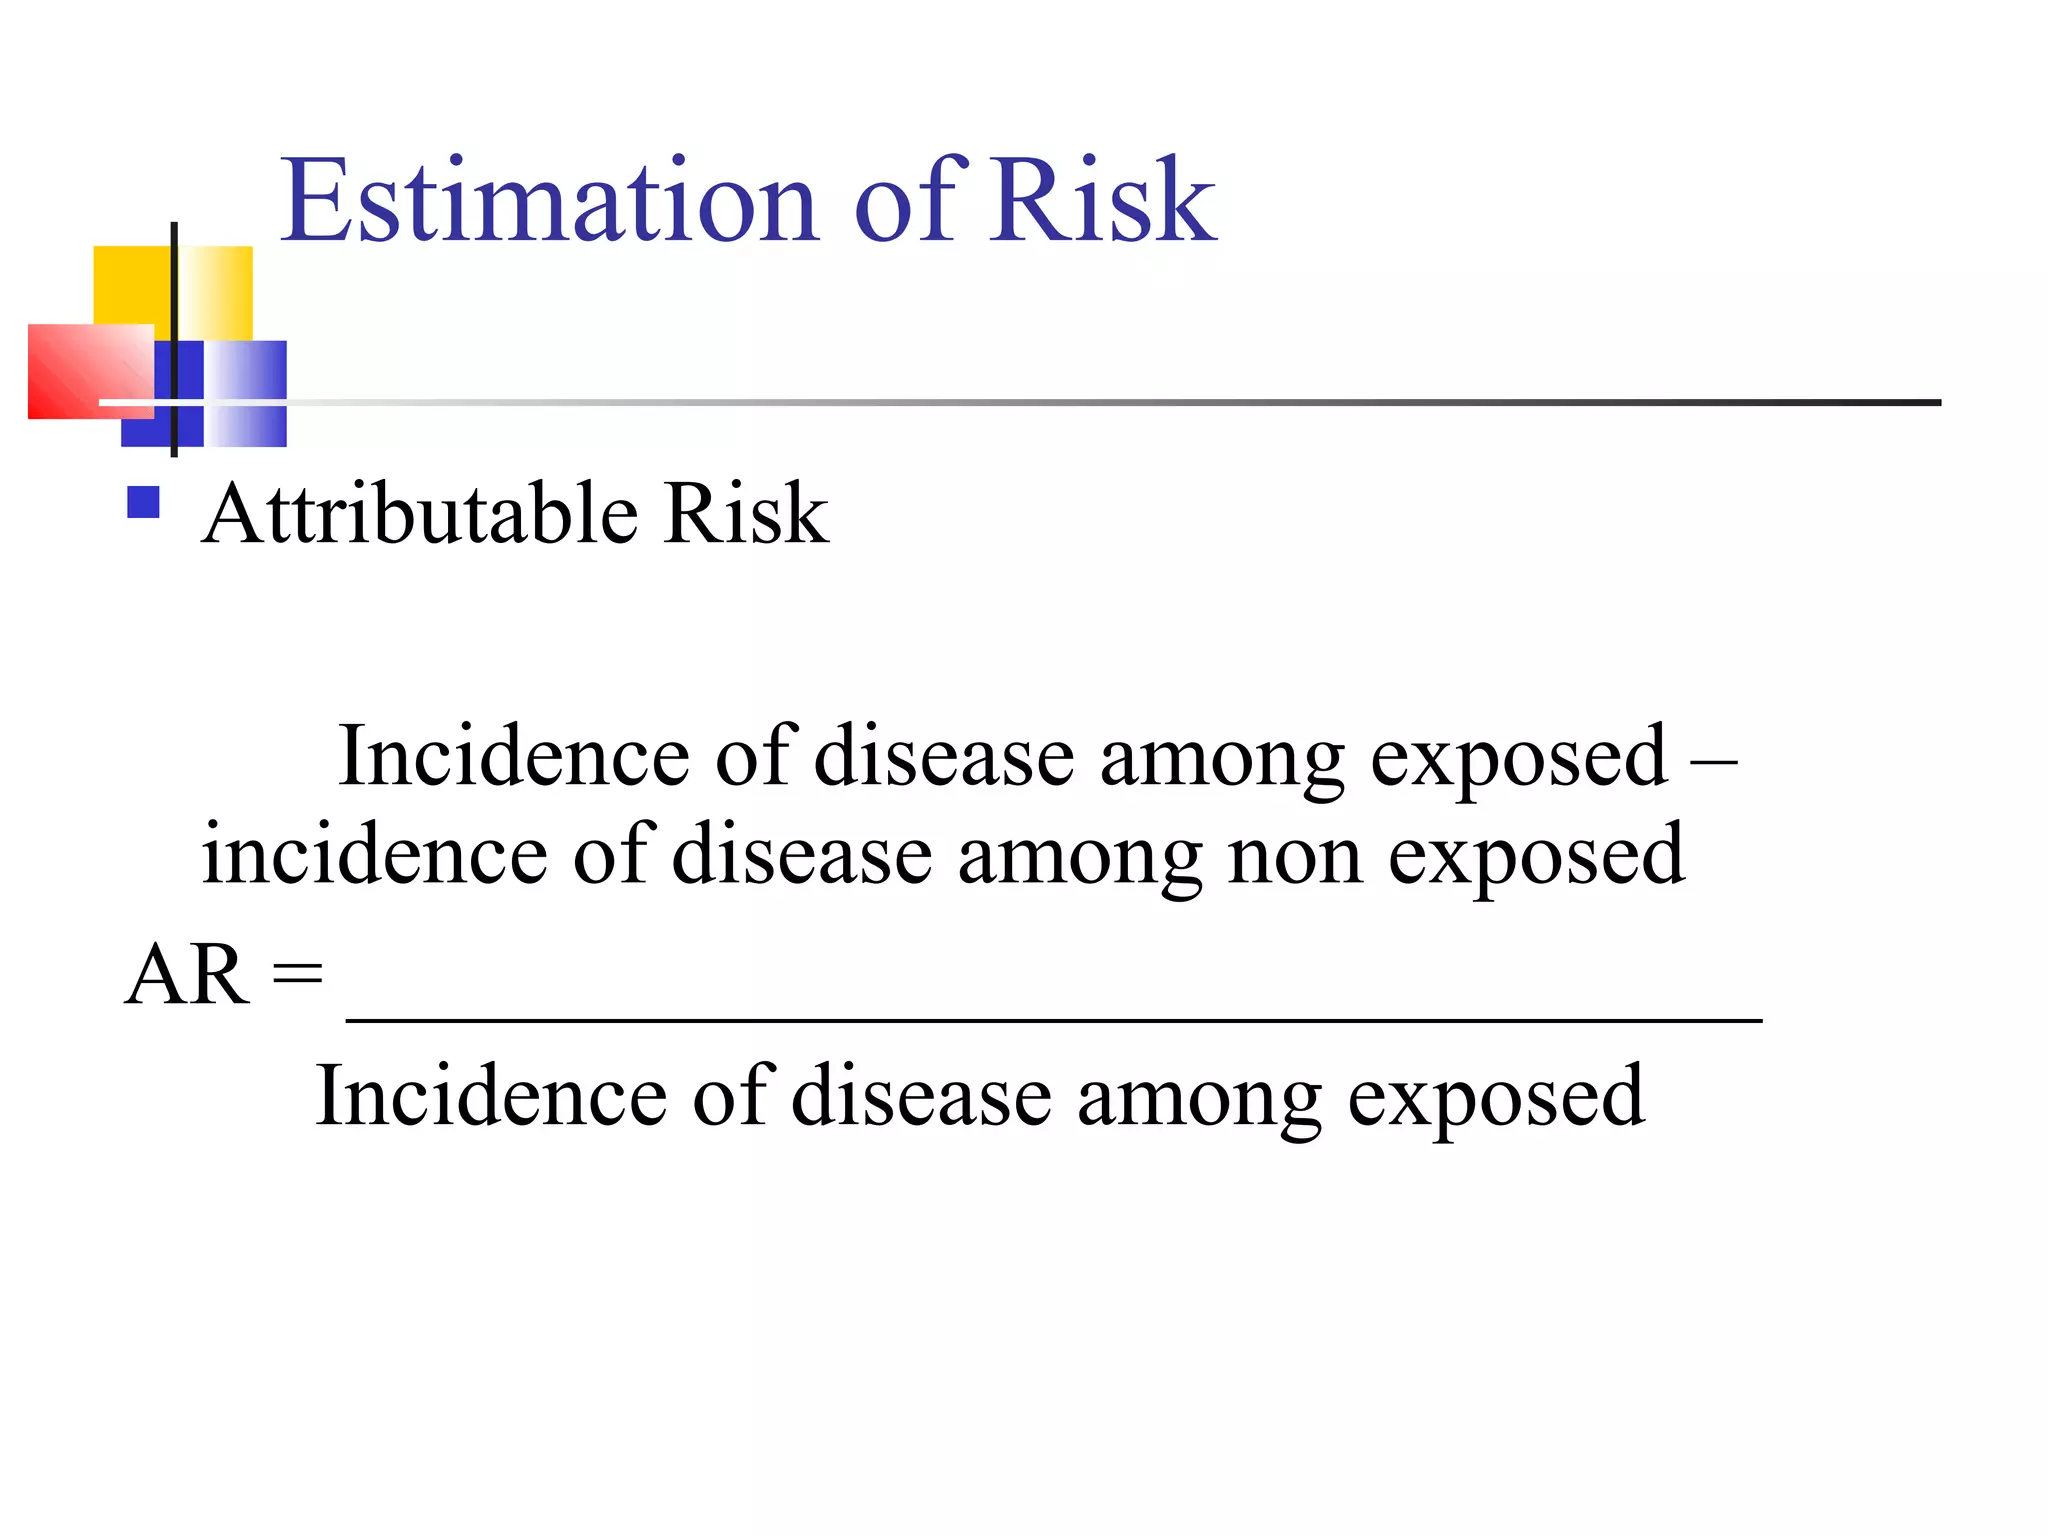
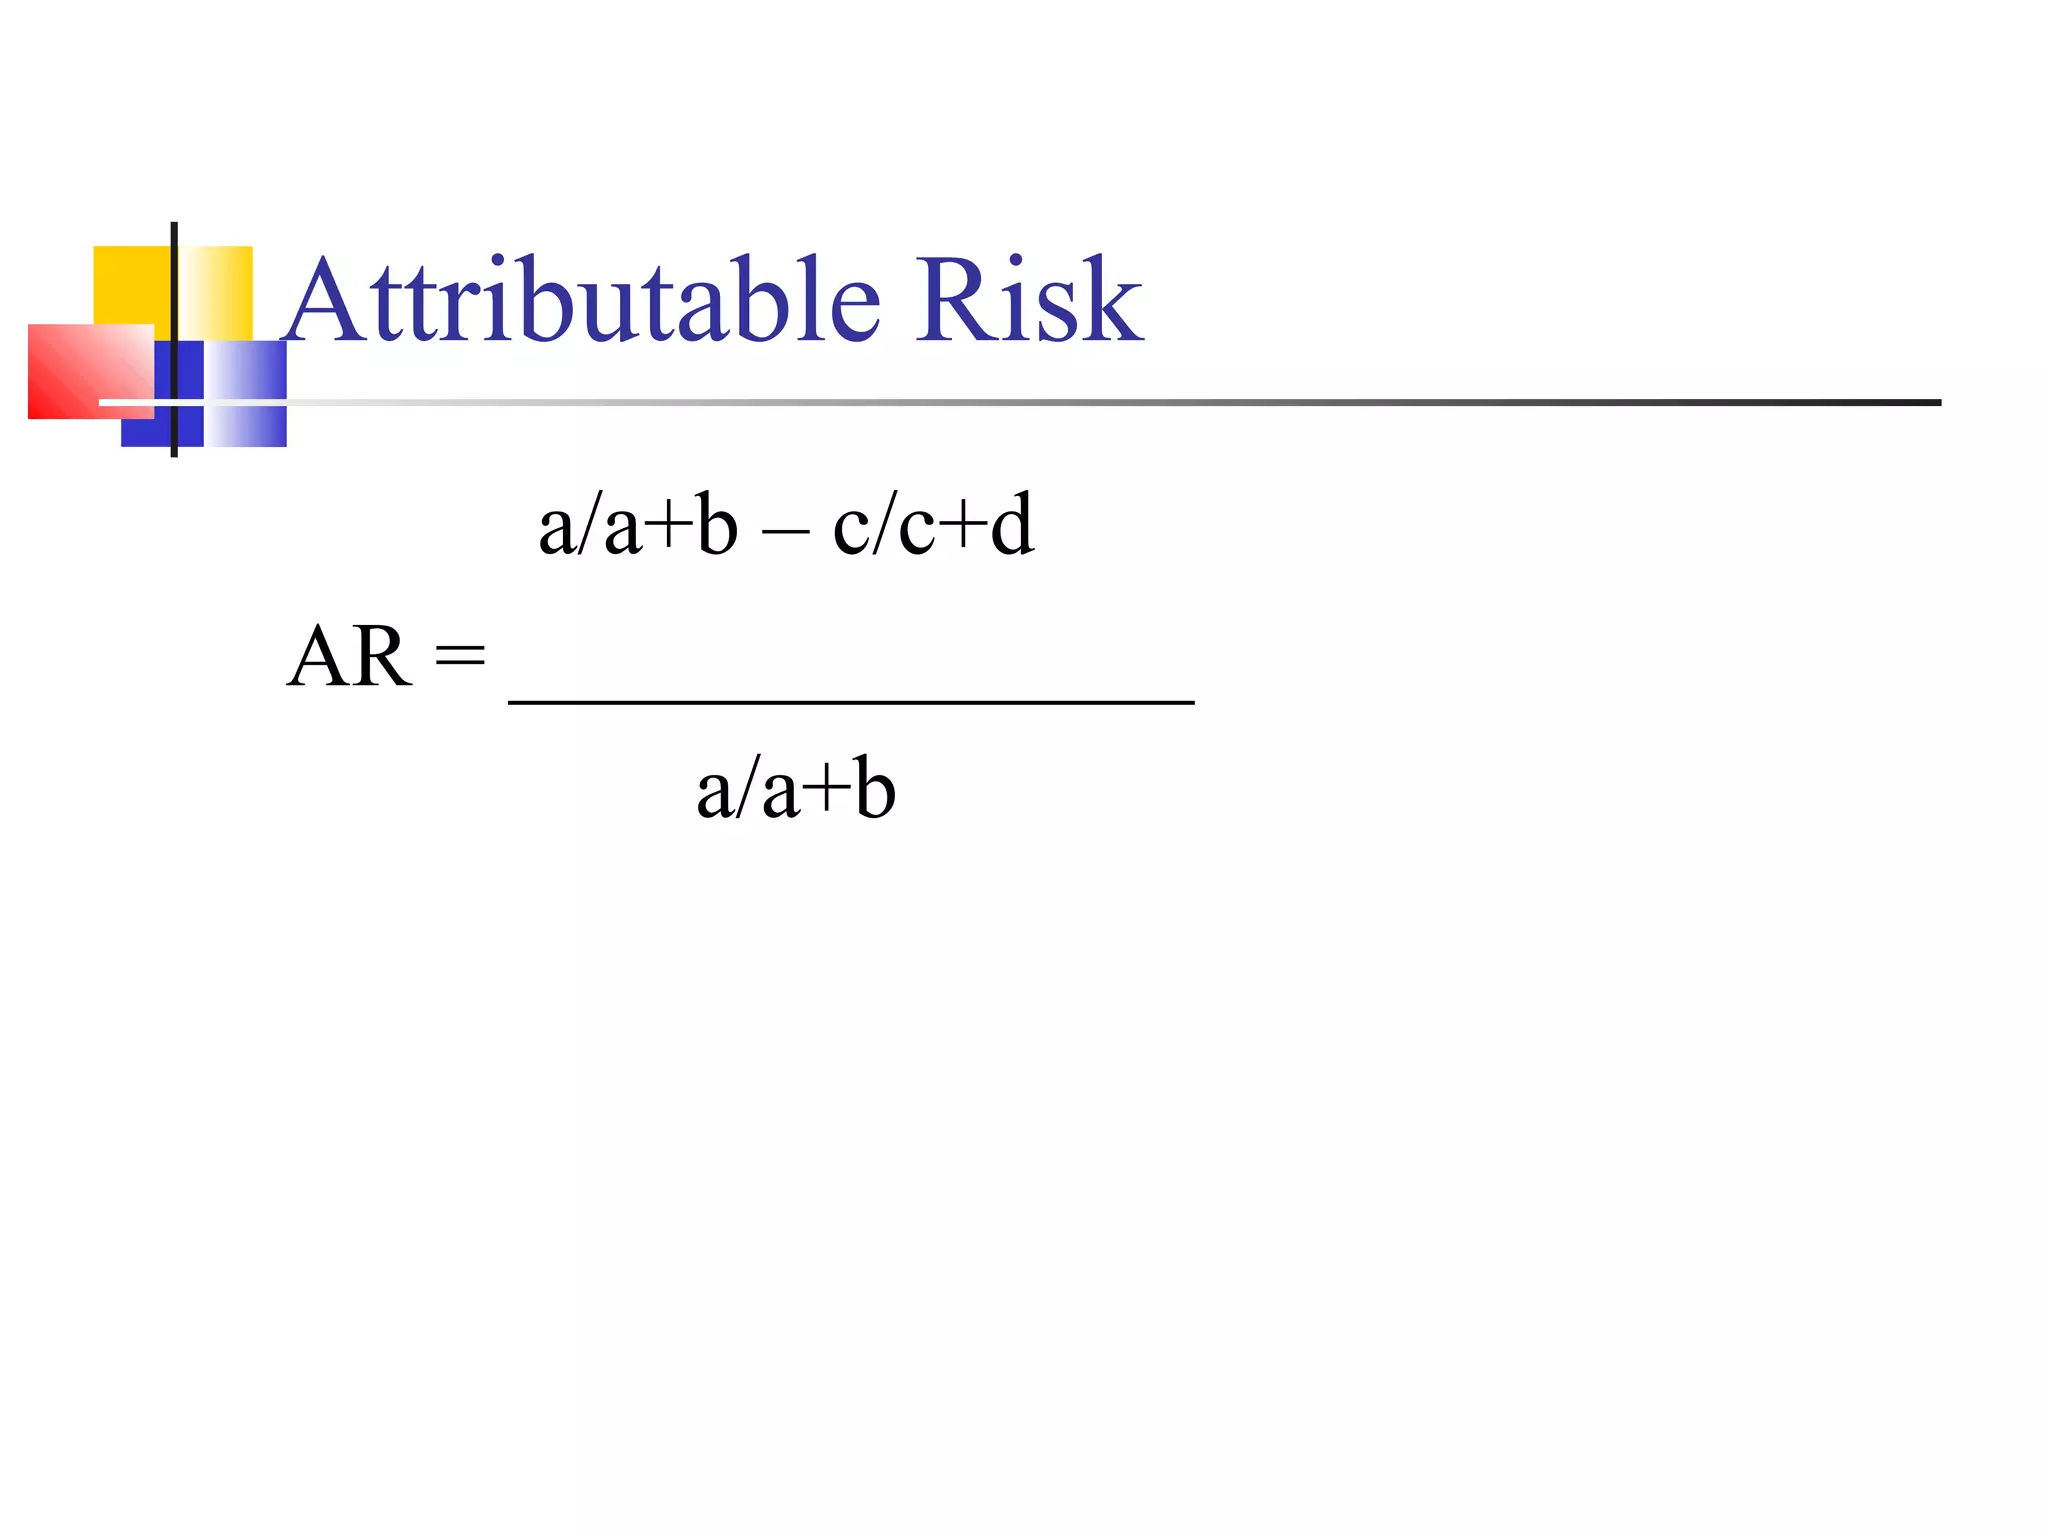
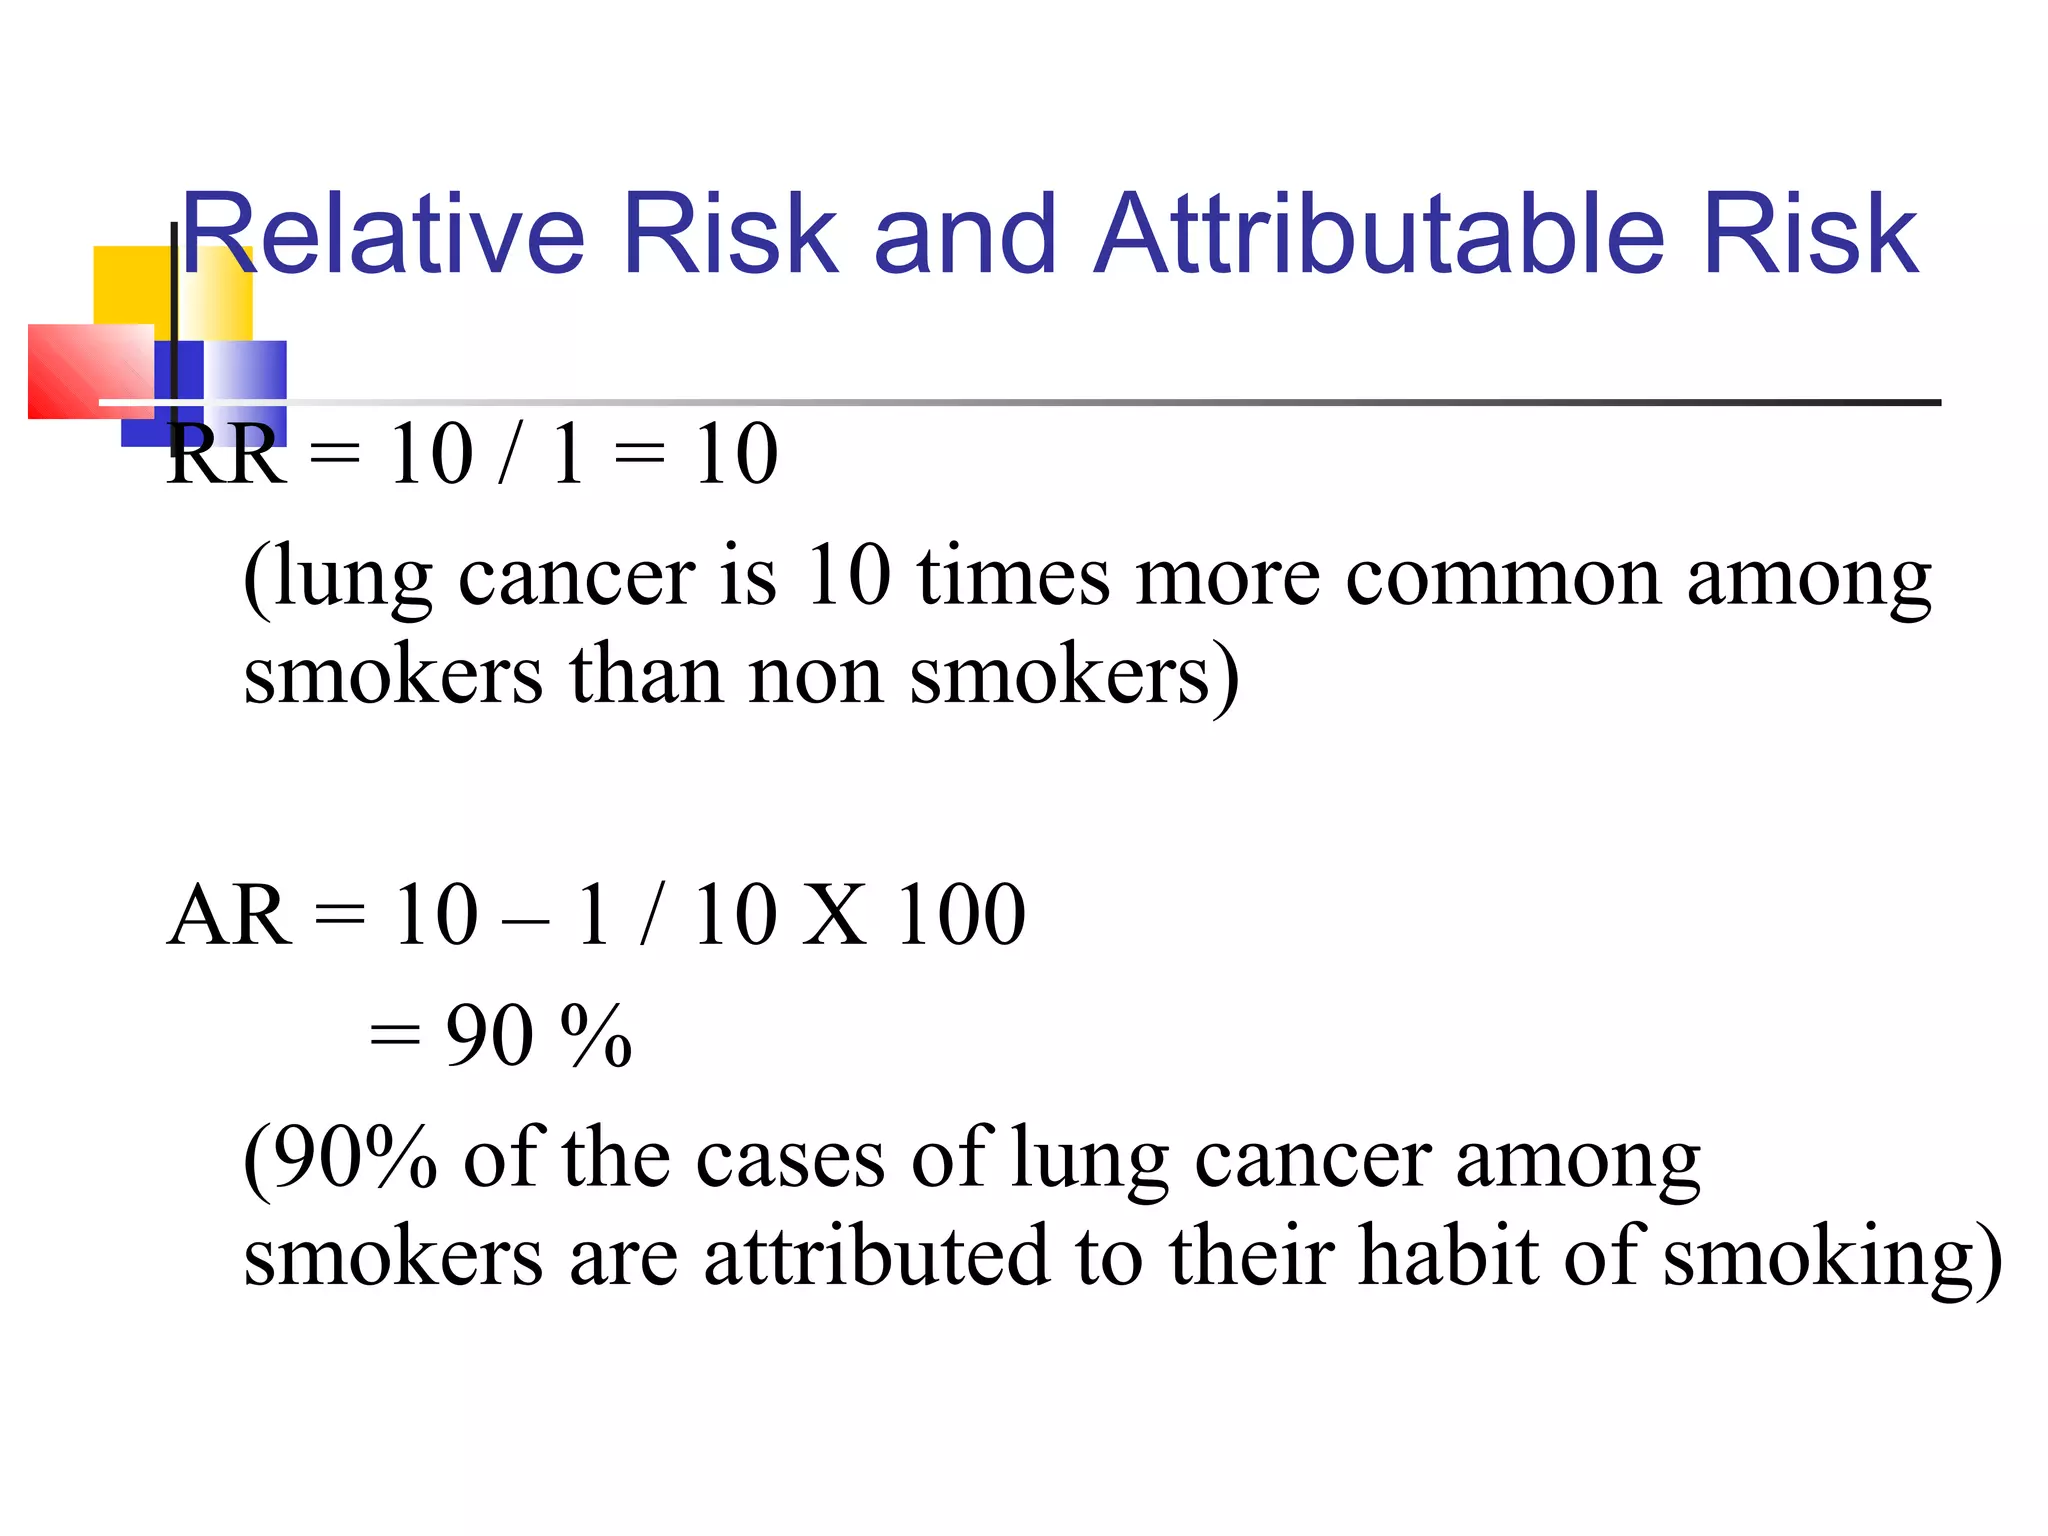
Relative and attributable risks are calculated to understand exposure impact on disease incidence.
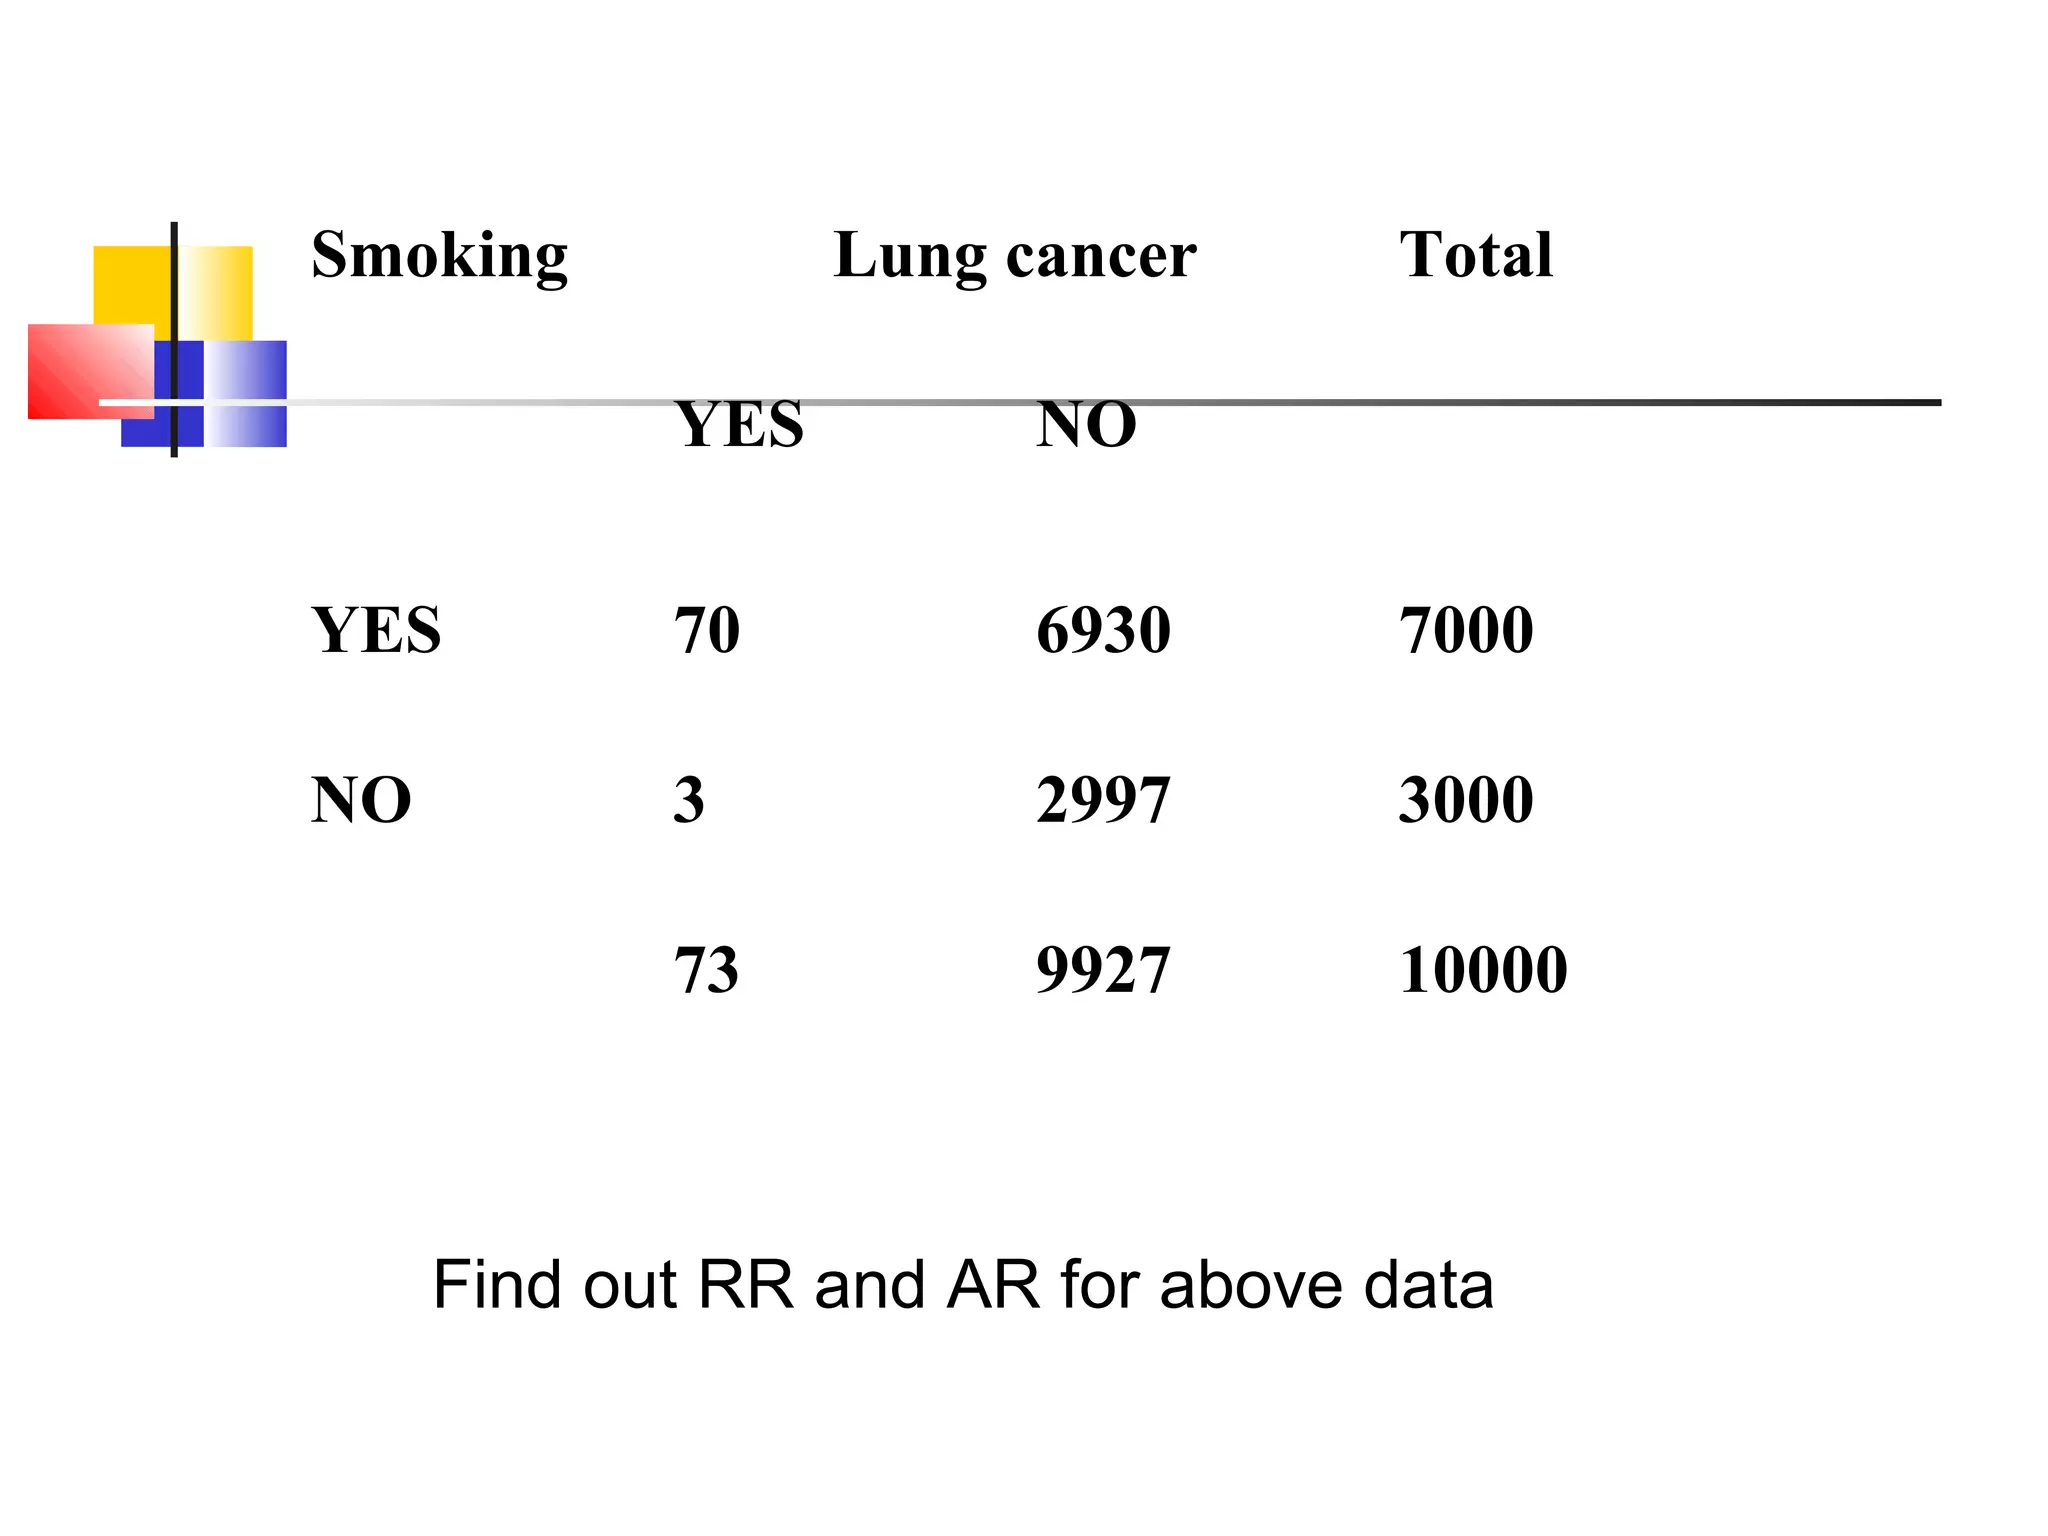
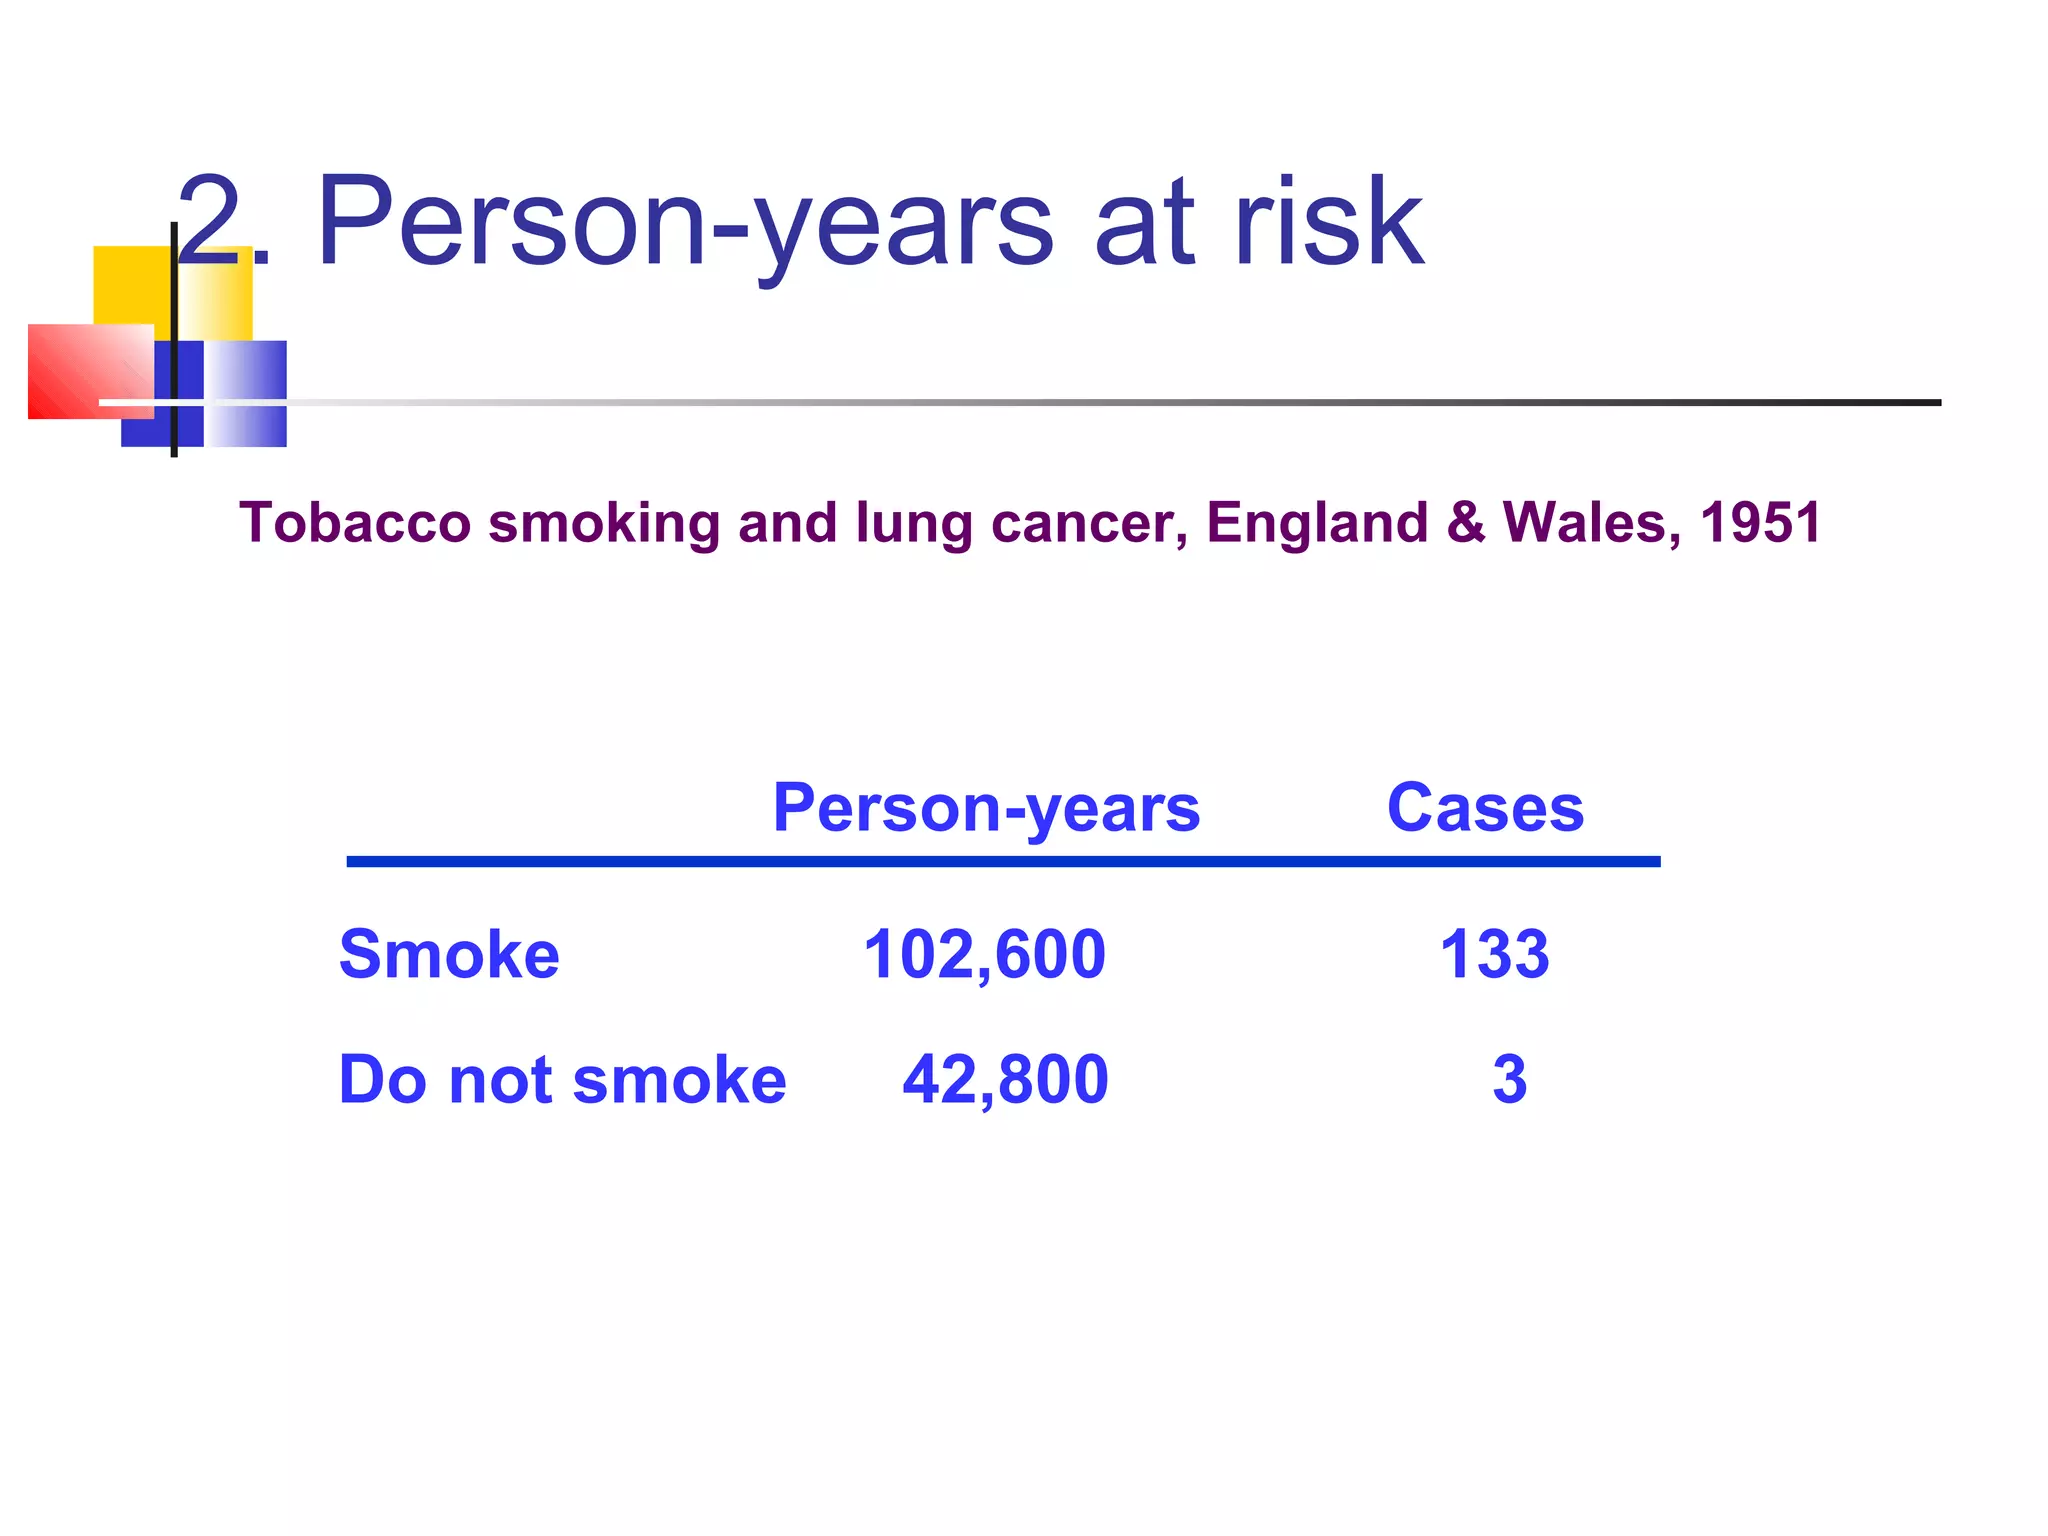
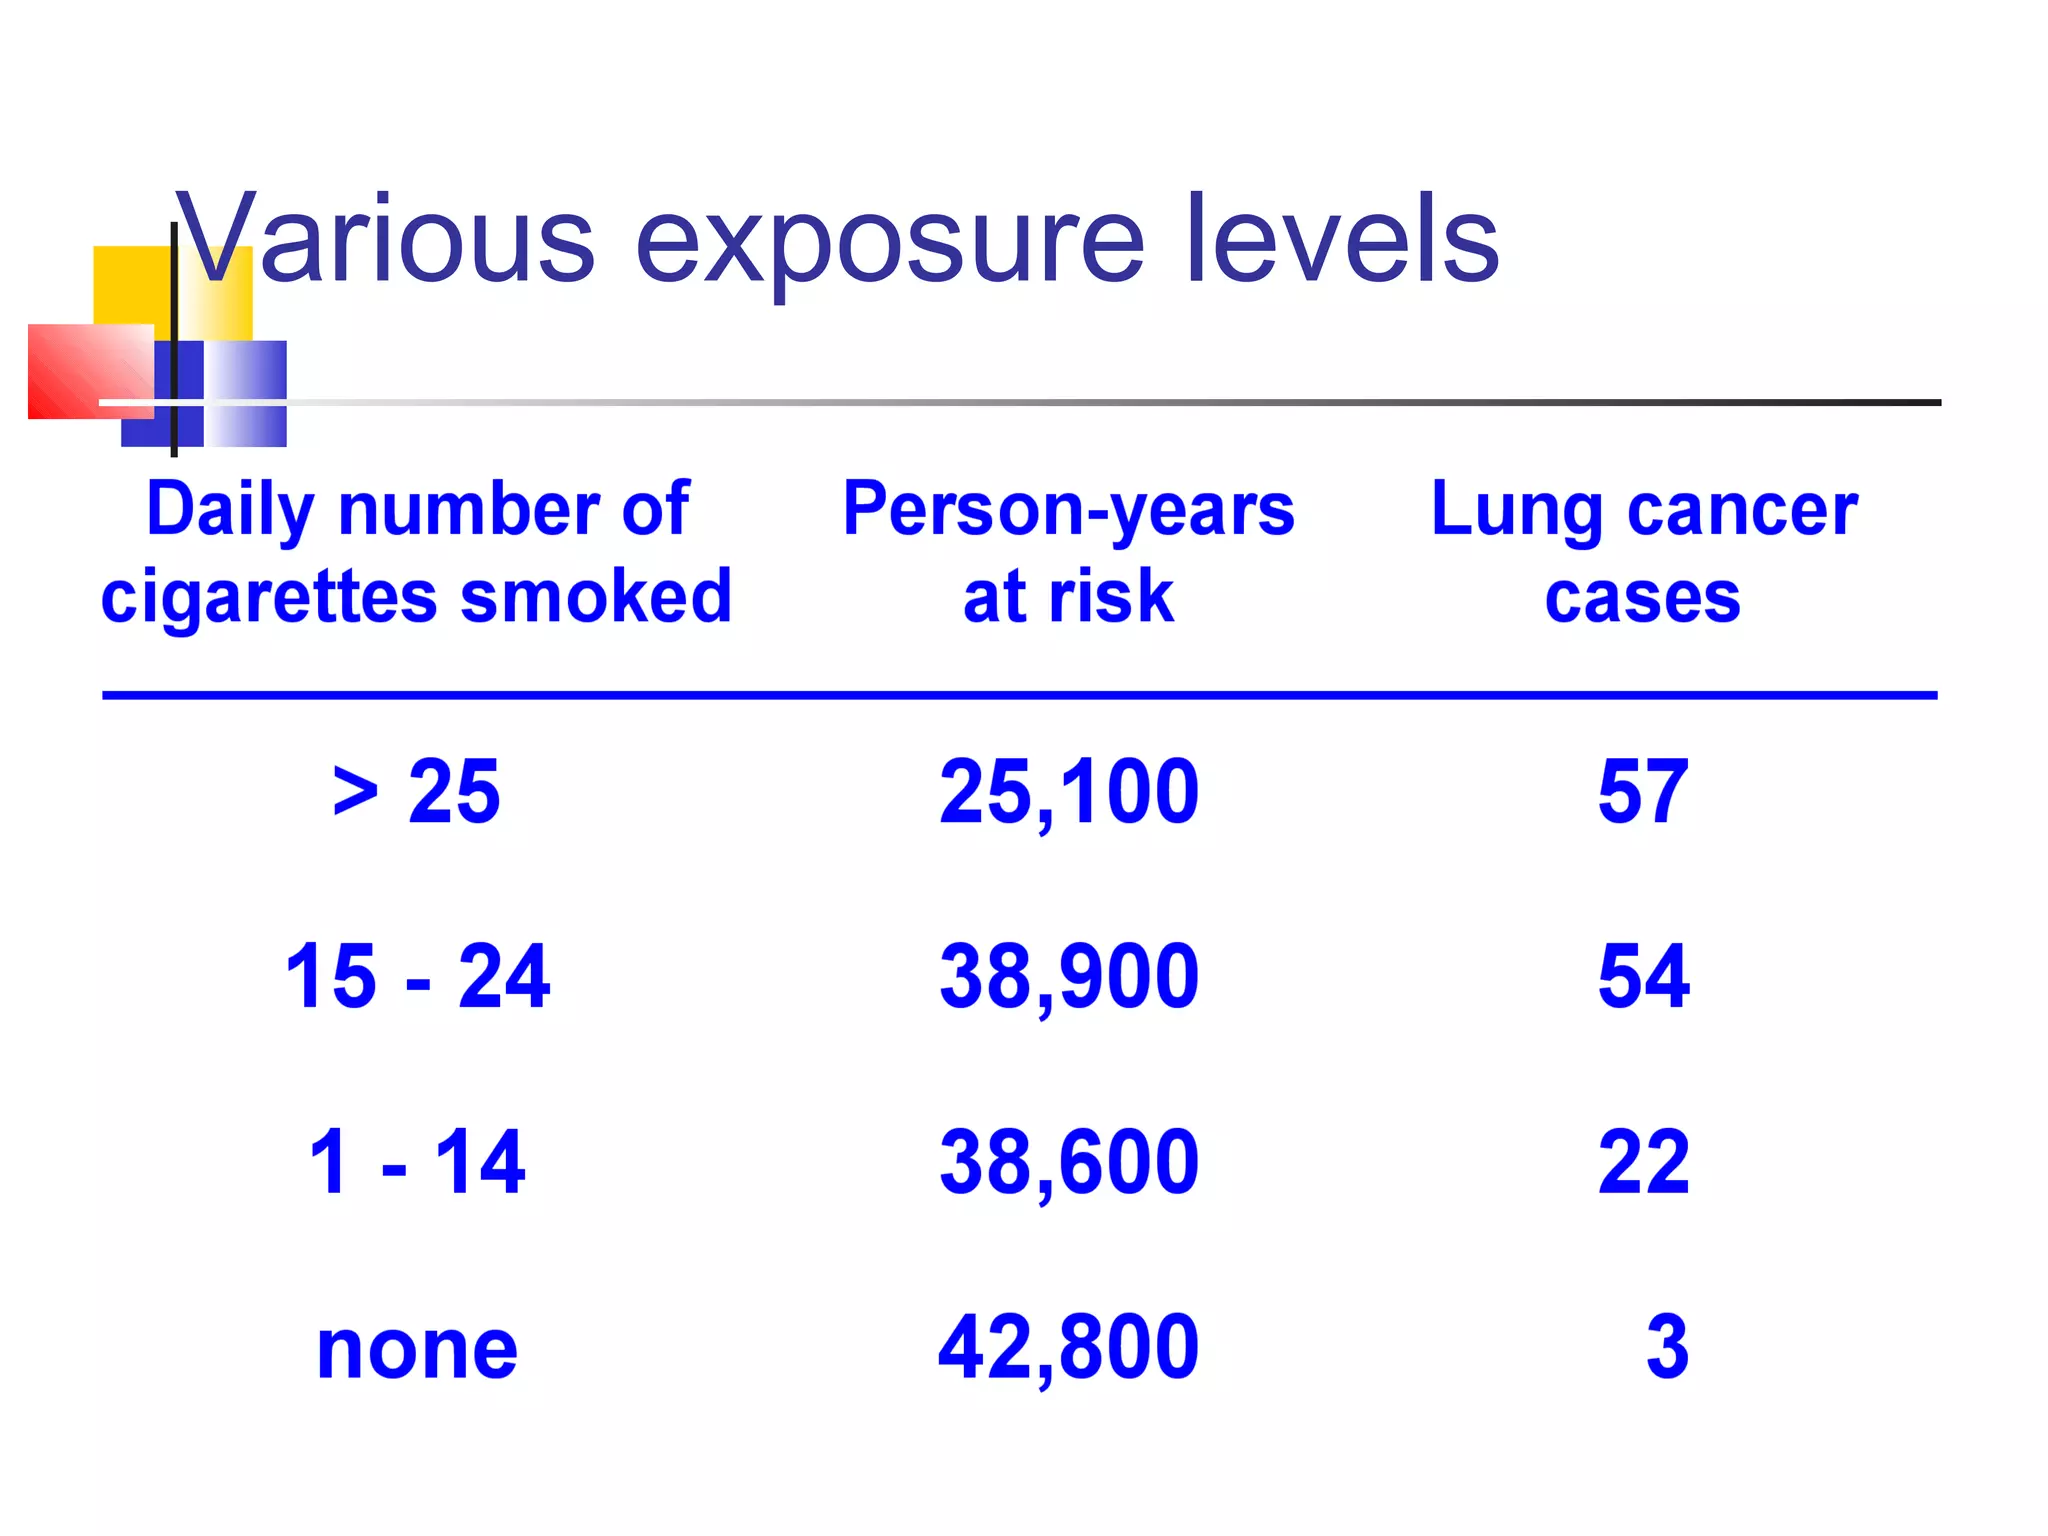
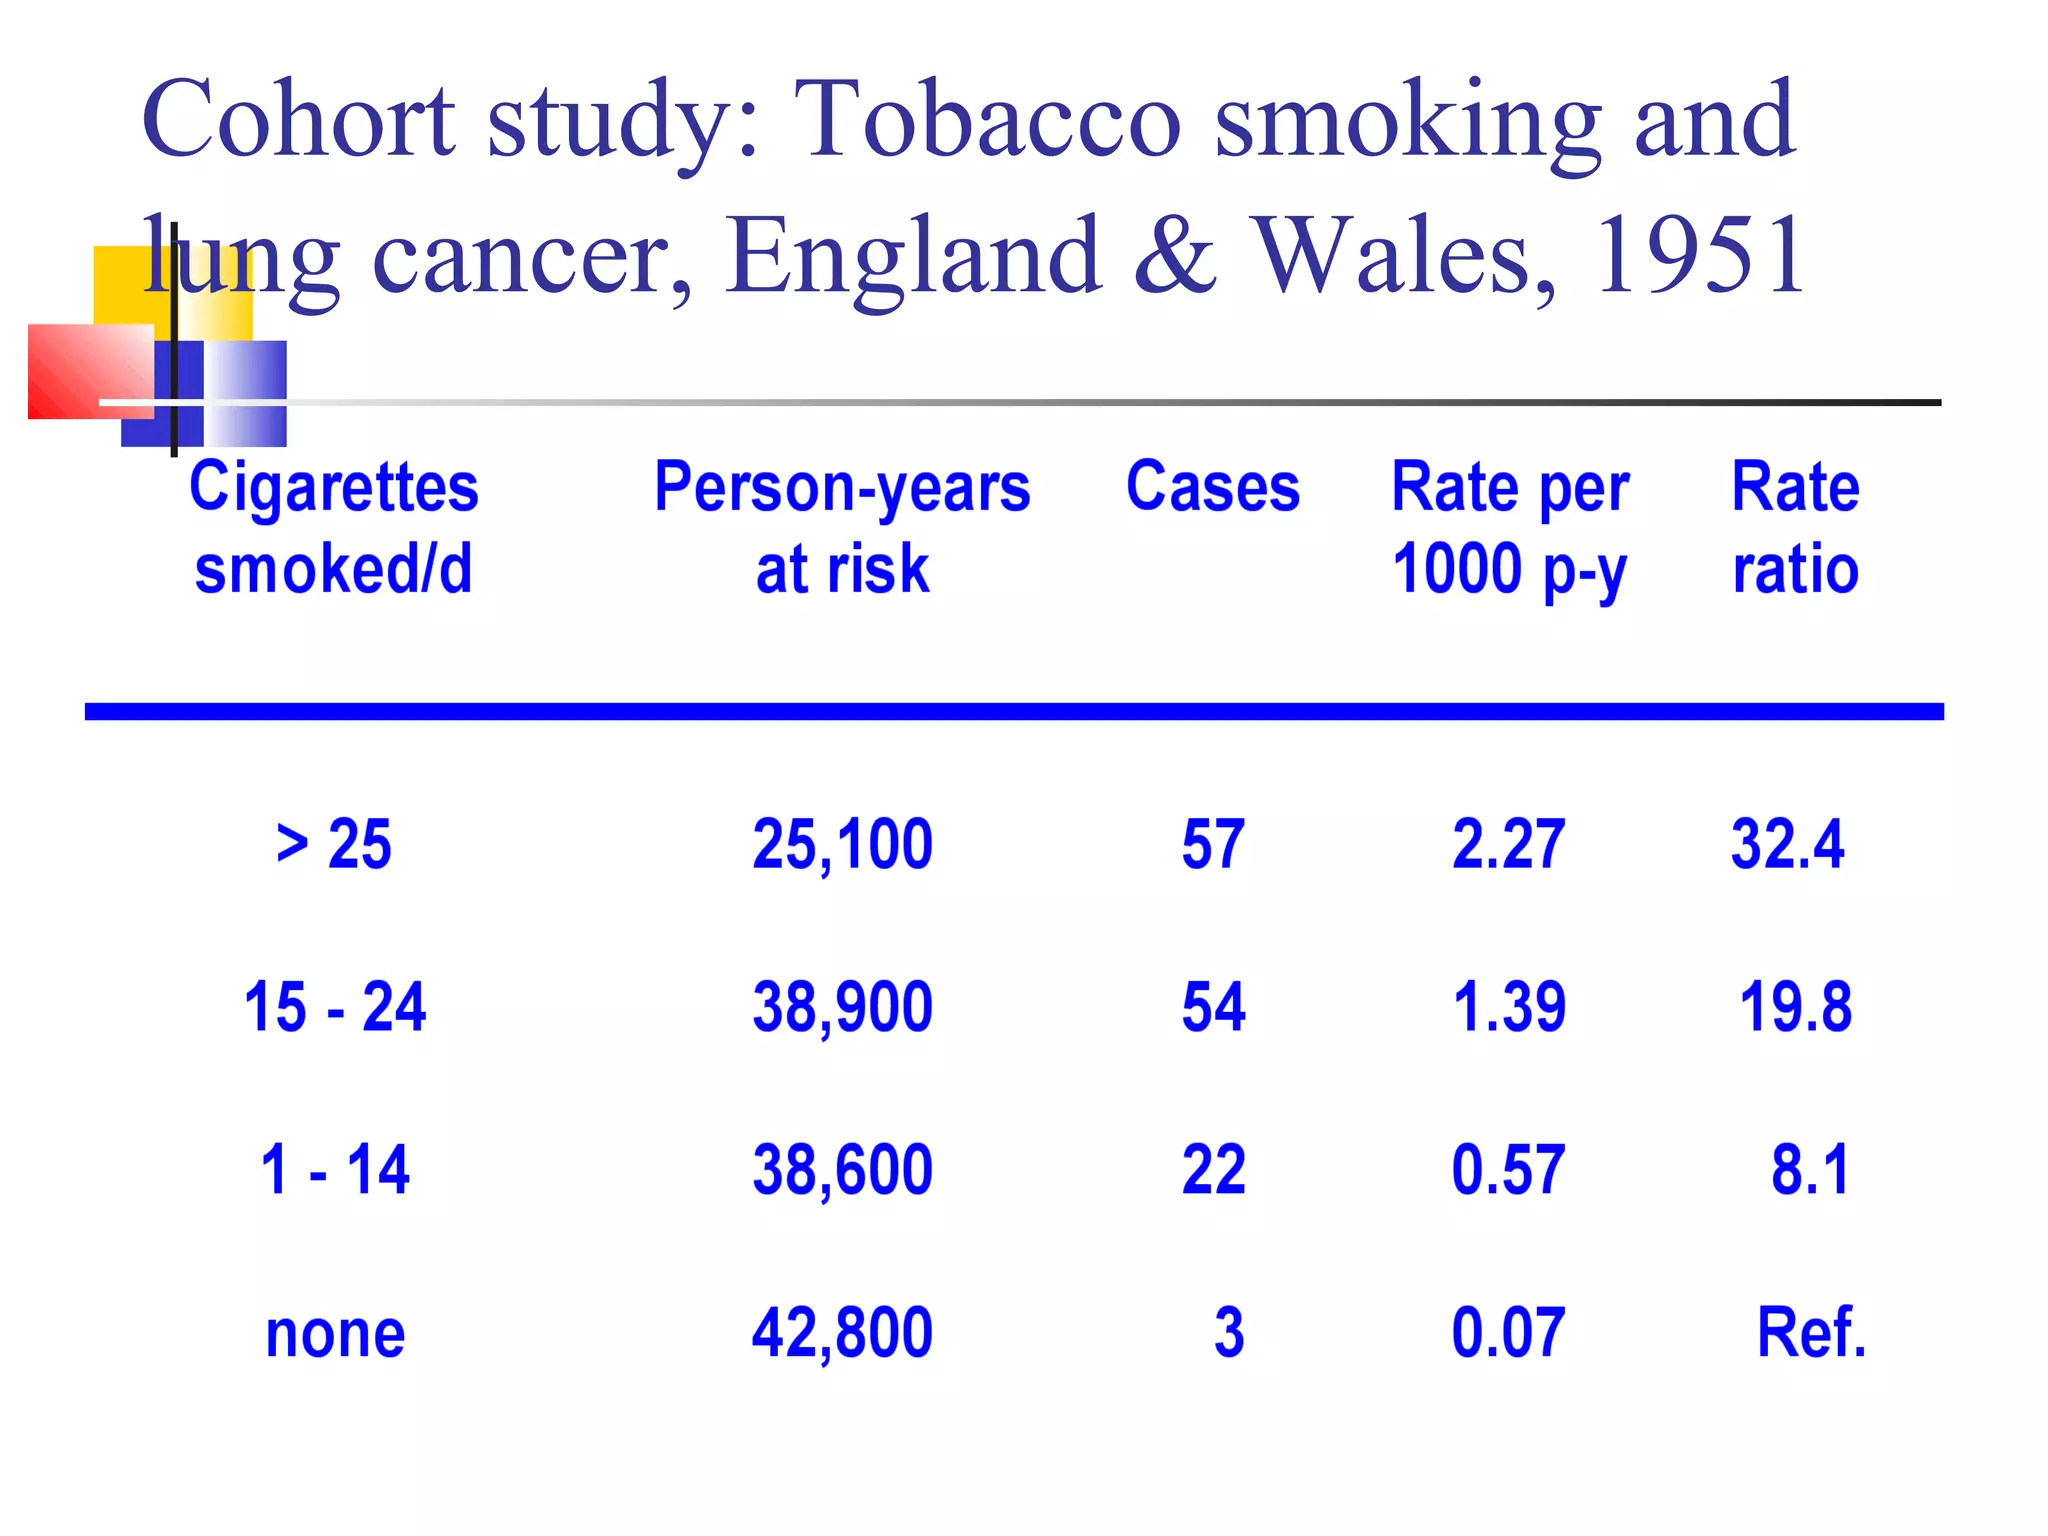
Example showcasing calculating incidence rates and risks for smoking and lung cancer, demonstrating significant findings.
Cohort studies allow establishing incidence rates, relative risk, and examining multiple disease outcomes.
Challenges include large sample requirements, time costs, ethical concerns, and potential biases.
Closing gratitude expressed, reiterating the importance of understanding cohort studies.
Presenting examples of cohort data related to HIV and tuberculosis risk among drug users.
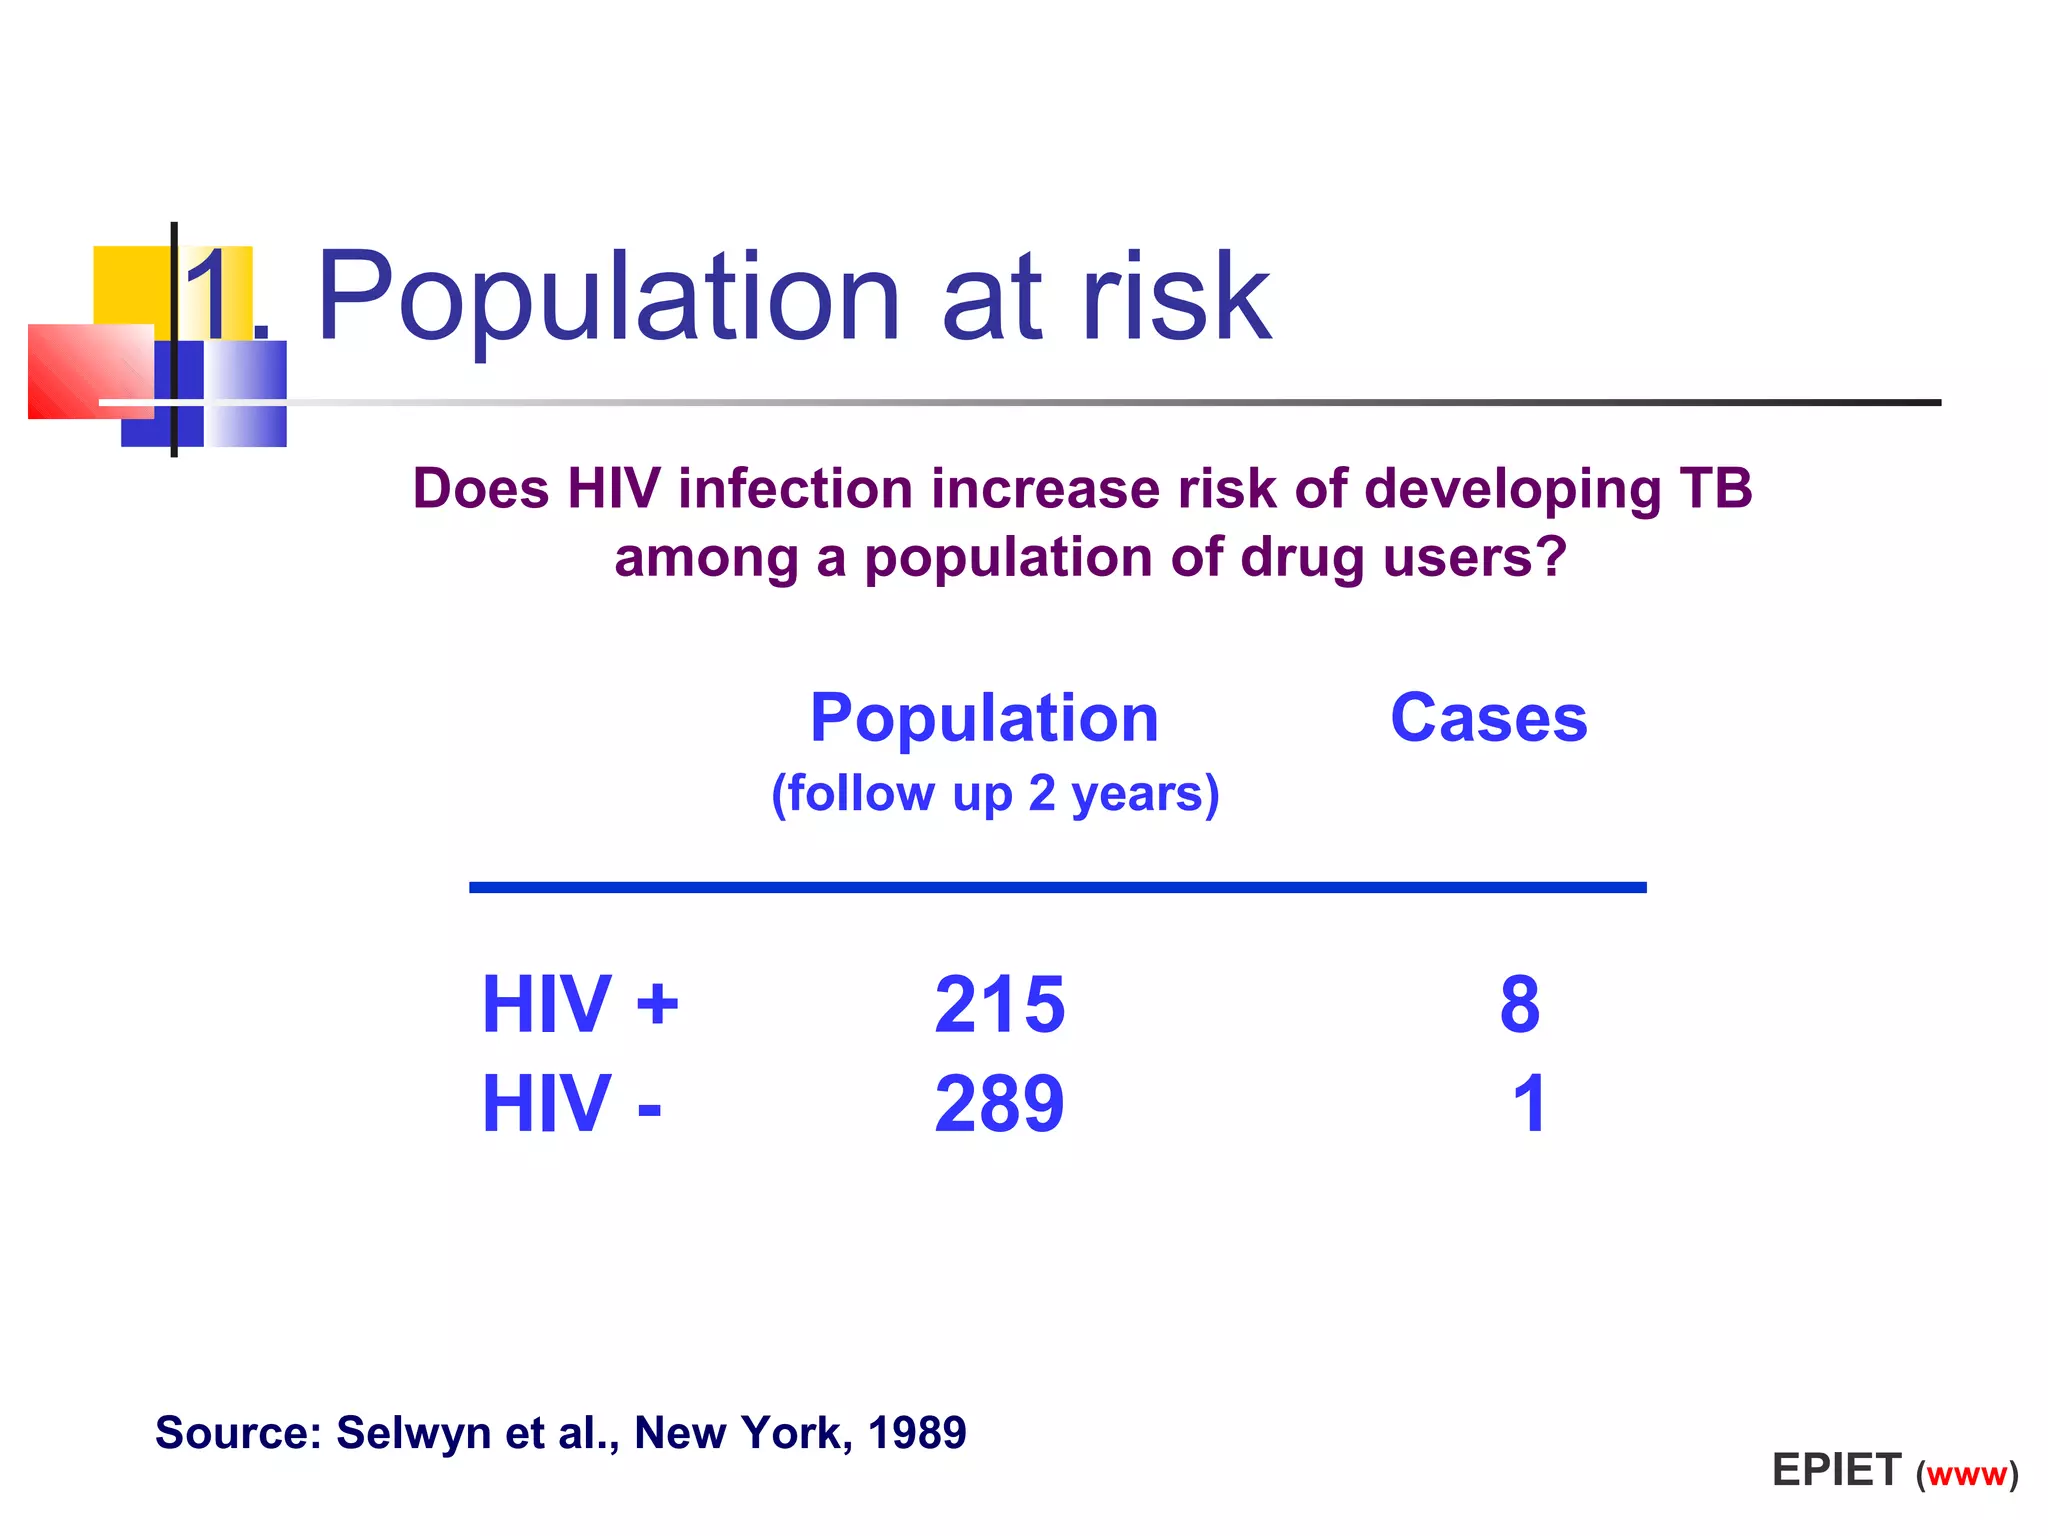
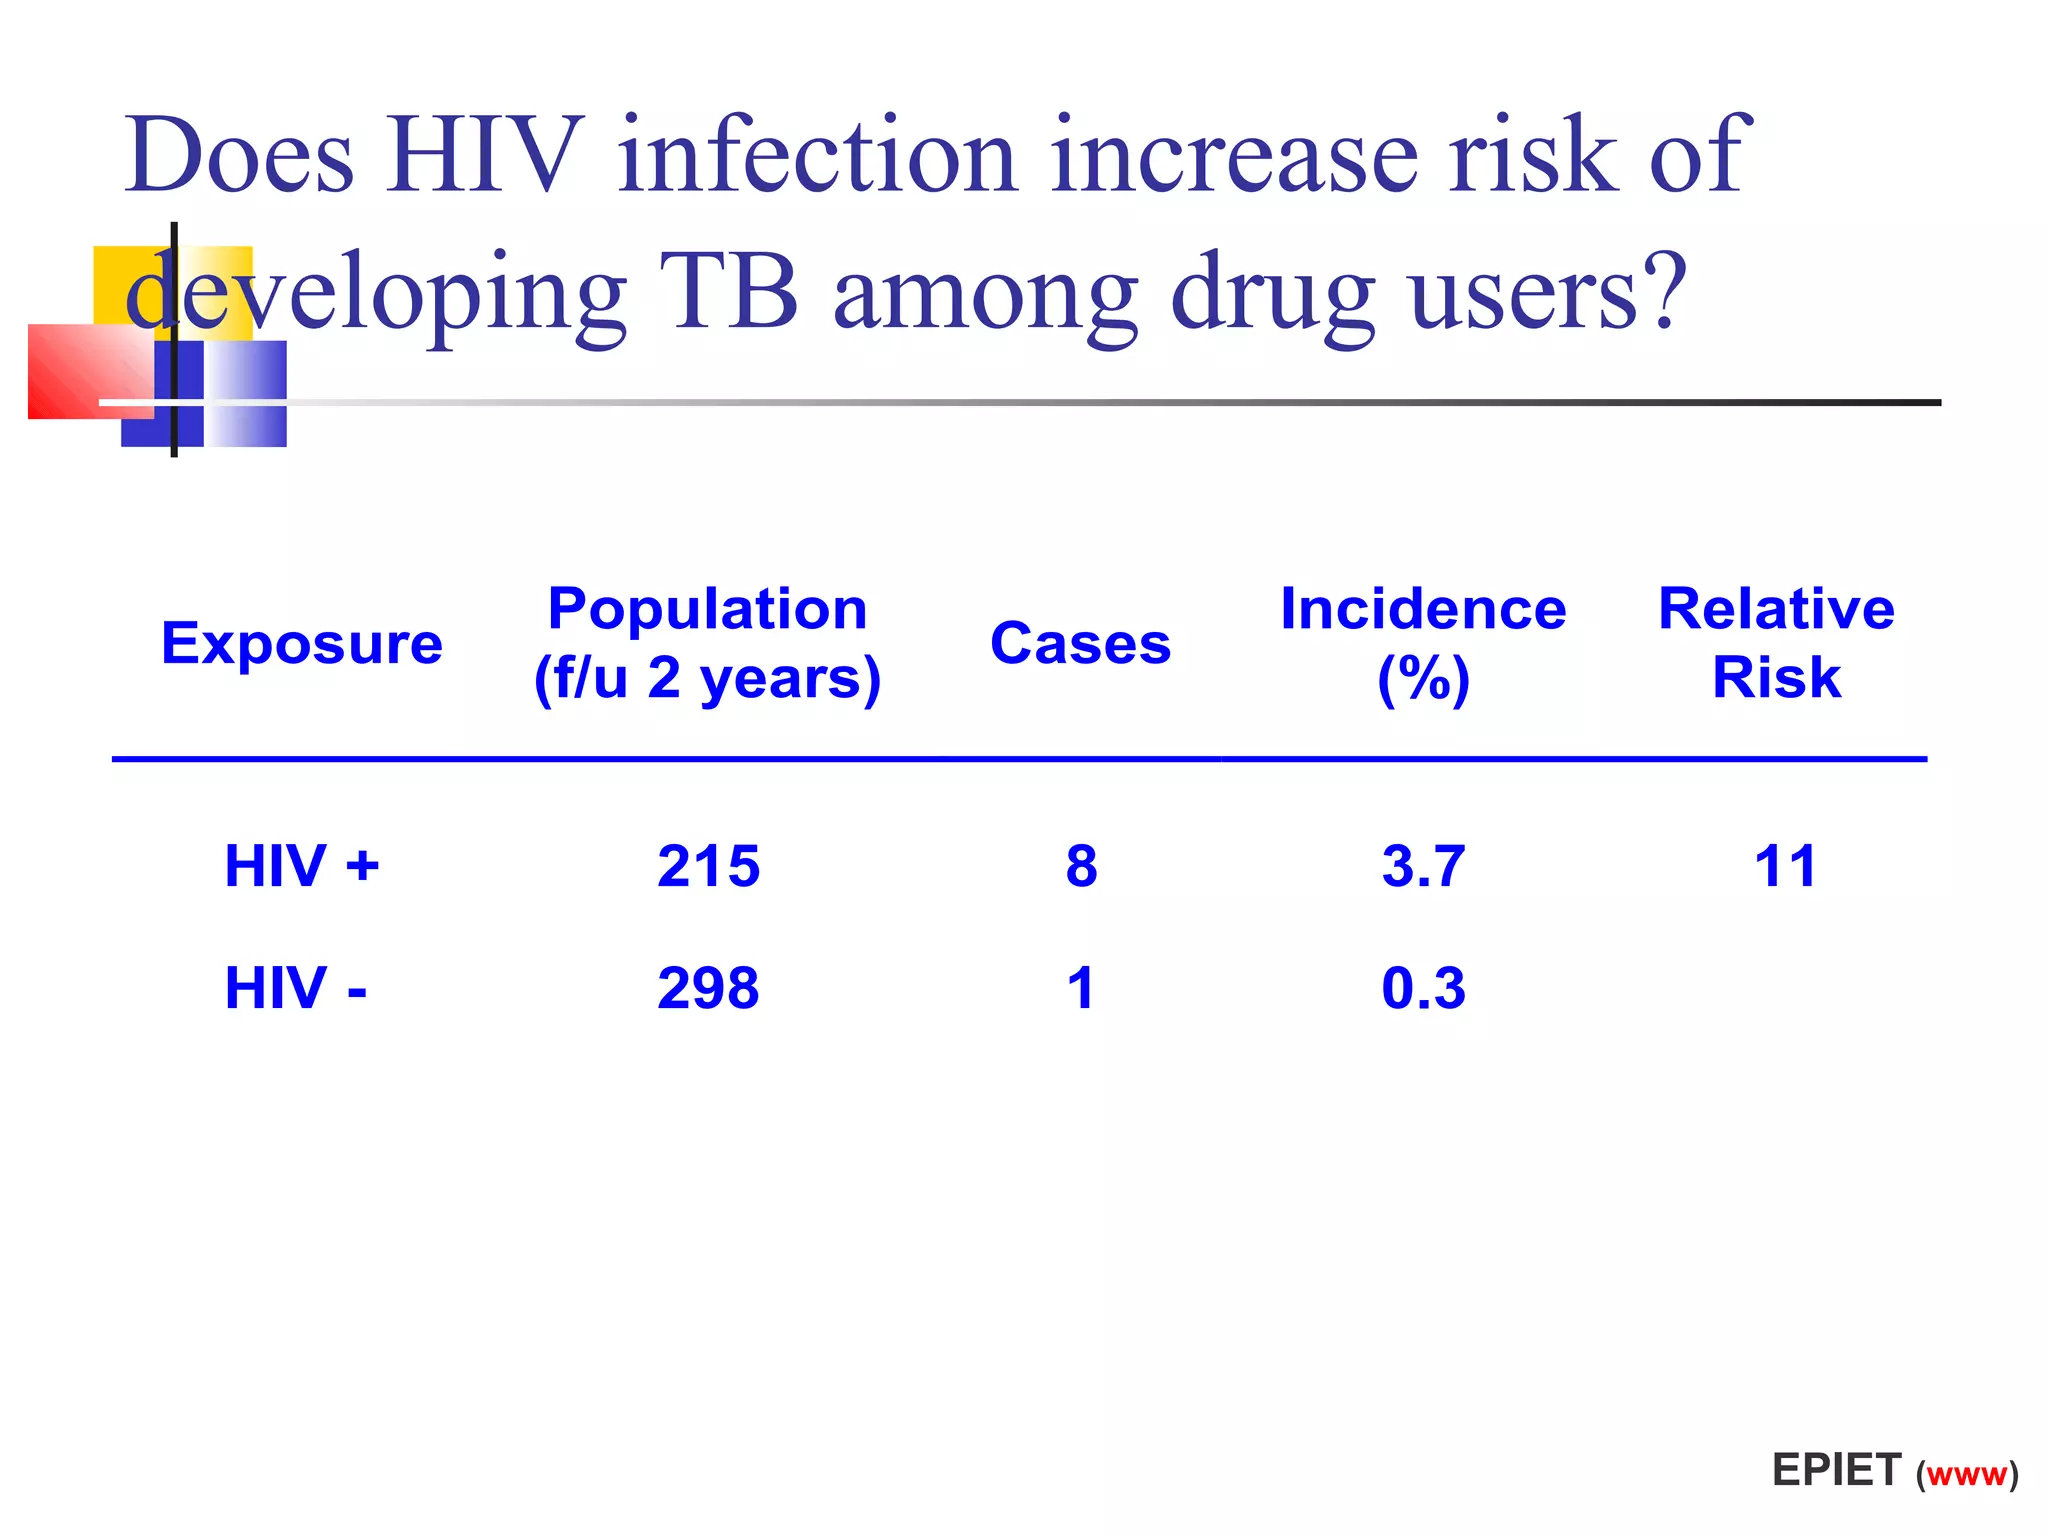
Investigating incidence and relative risk in populations based on HIV status and tuberculosis cases.
An overview of cohort statistics relating tobacco smoking to lung cancer incidence in England & Wales.