Downloaded 153 times


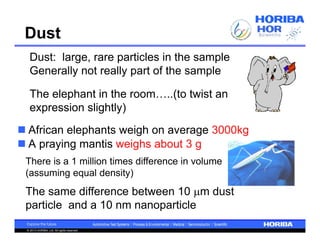


The document discusses the method development for dynamic light scattering (DLS), emphasizing its non-invasive measurement capabilities, sample preparation strategies, and the importance of proper dispersion for accurate particle size analysis. Key topics include the choice of sample cells, concentration levels, the effect of surfactants, and filtration techniques to prevent contamination from larger particles. Additionally, it covers the significance of measuring duration and repeats to ensure reliable data results.