Downloaded 508 times


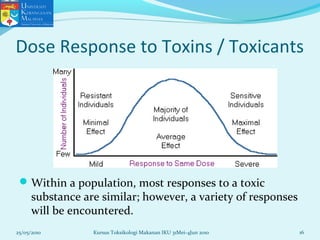
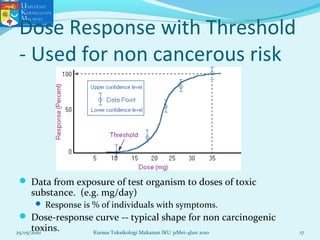
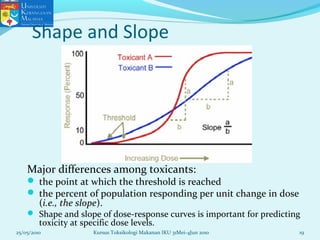
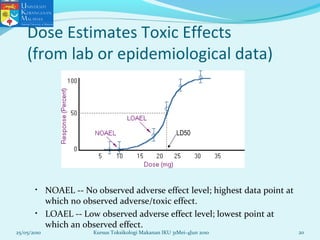


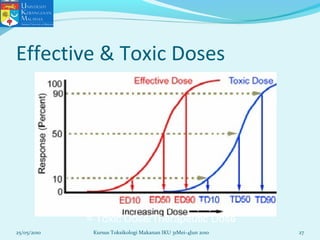
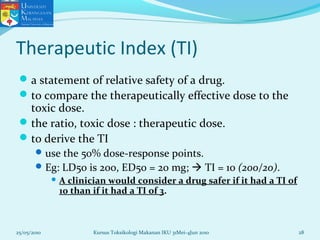
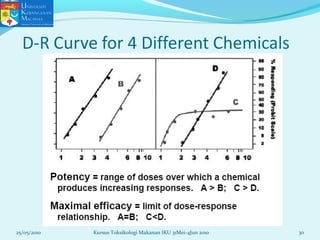
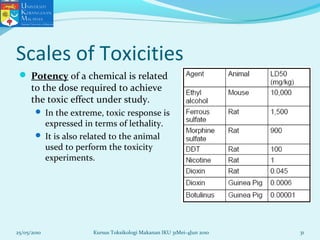
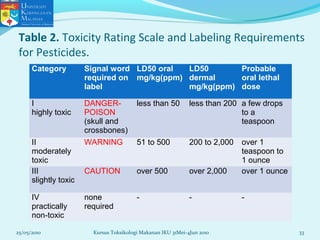
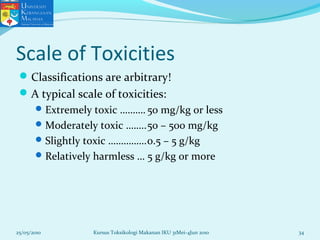
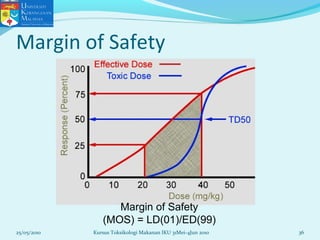
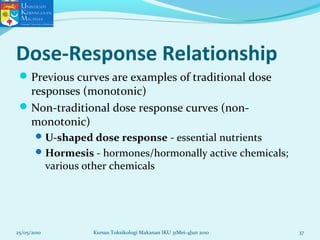
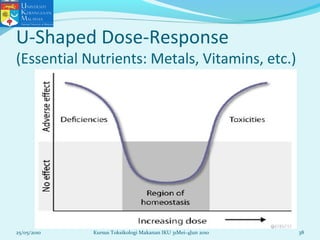
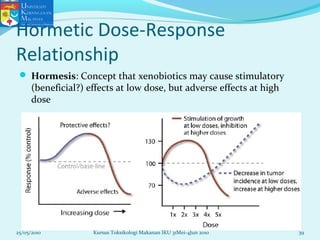
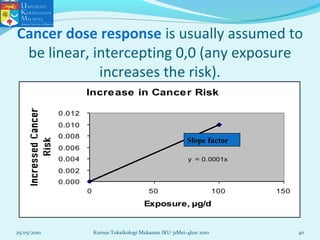
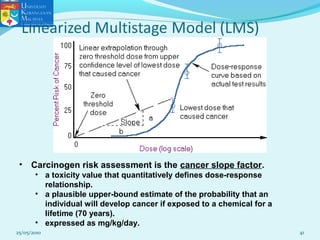

This document discusses key concepts in toxicology related to dose-response relationships. It explains that there is usually a relationship between the amount of a toxic substance received (dose) and the resulting toxic response. Important assumptions are that below a certain dose there is no measurable response, and increasing the dose beyond a maximum response level does not increase the effect. Dose-response curves are used to estimate thresholds for toxic effects like LD50, which is the dose at which 50% of subjects show a lethal response. The therapeutic index compares a substance's toxic dose to its therapeutic dose as a measure of its safety margin. The document also discusses non-traditional dose-response curves like U-shaped and hormetic relationships.