Download as PDF, PPTX


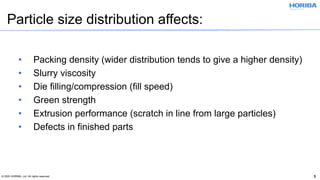
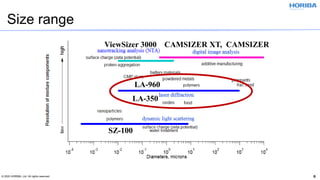
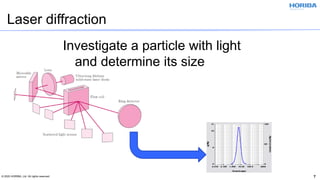
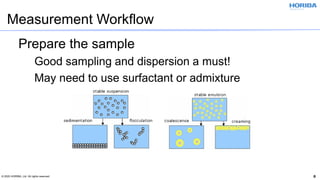
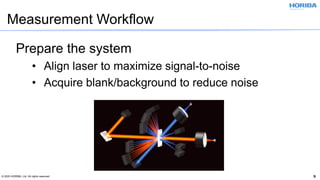
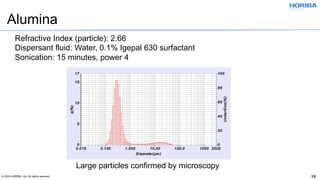
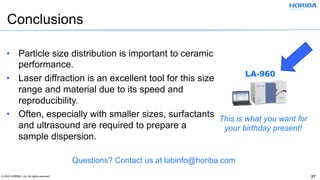


Particle size distribution affects various properties of ceramic powders and final products. Laser diffraction is well-suited for measuring the size of ceramic particles due to its wide measuring range and reproducibility. Proper sample preparation including dispersants and ultrasonication is often needed to attain an accurate measurement. The LA-960 laser diffraction analyzer provides a fast and flexible way to characterize ceramic powder particles.


![Polymer [ बहुलक ] Chemistry Notes PDF - Irfanullah Mehar - JJ Sir Chemistry.pdf](https://cdn.slidesharecdn.com/ss_thumbnails/polymerchemistrynotespdf-irfanullahmehar-jjsirchemistry-260210172118-3f9b37f7-thumbnail.jpg?width=640&height=640&fit=bounds)


