Downloaded 269 times


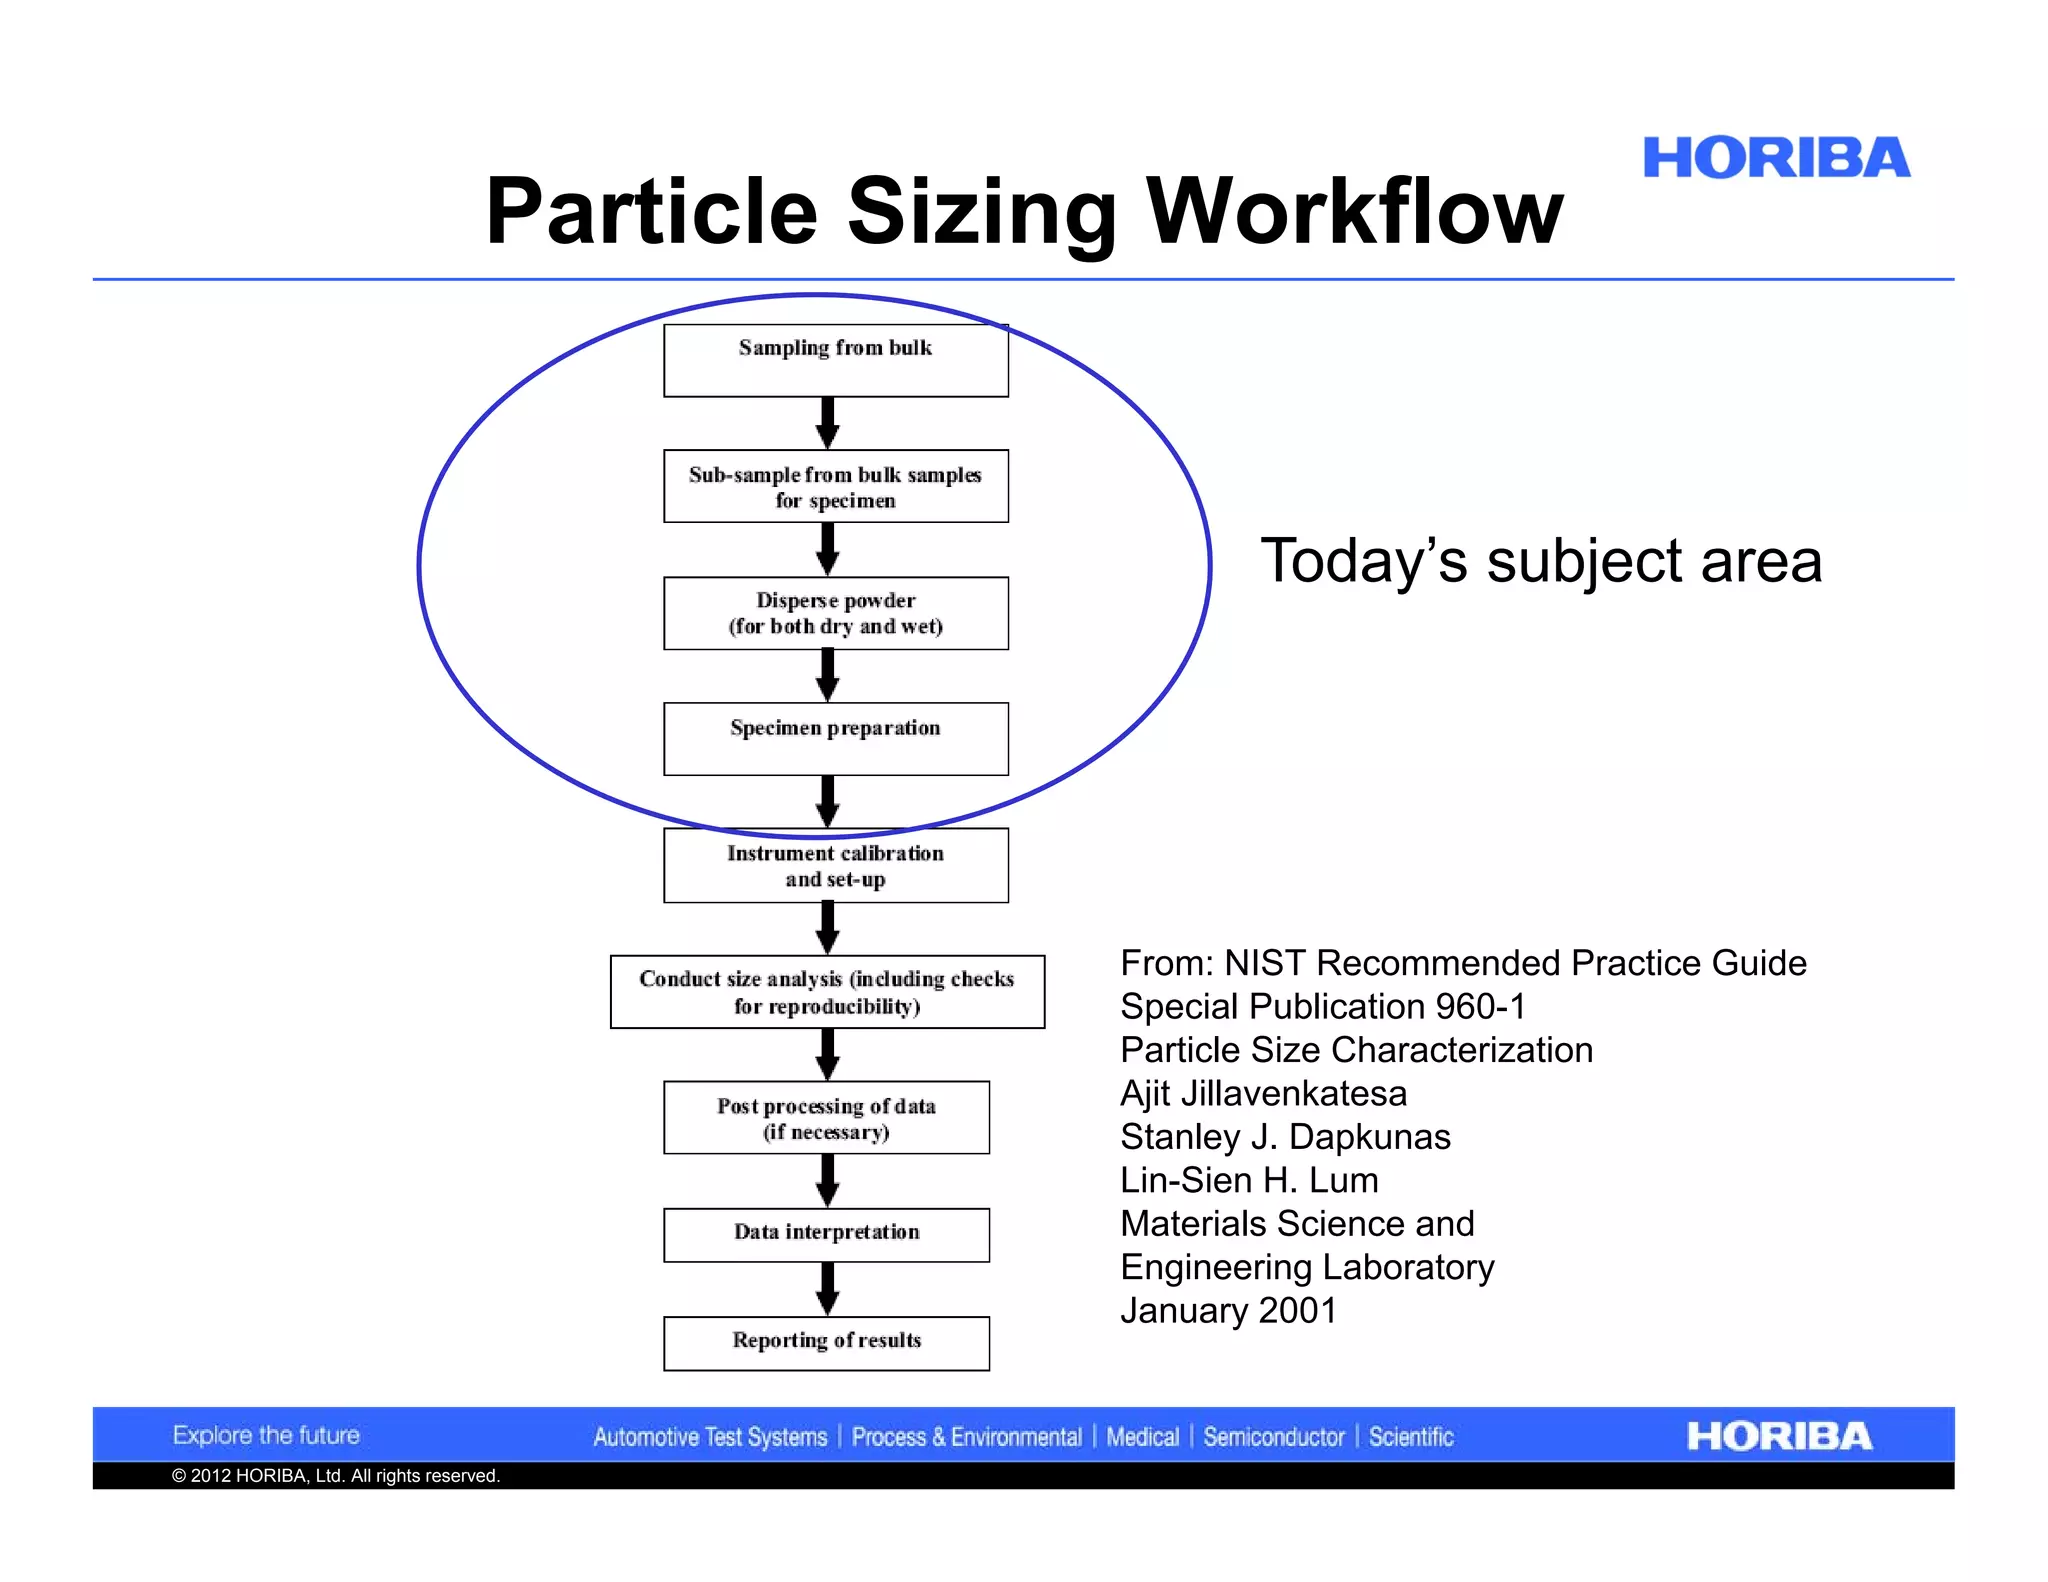


The document discusses sampling techniques and strategies for particle size analysis, focusing on methods for effective dispersion and measurement of powders. It highlights the importance of proper sampling, the use of surfactants for wetting and preventing agglomeration, and the effects of applied energy in preparing samples for analysis. Additionally, it includes various sampling methods, error sources in measurement, and the principles of particle interactions.