Downloaded 787 times


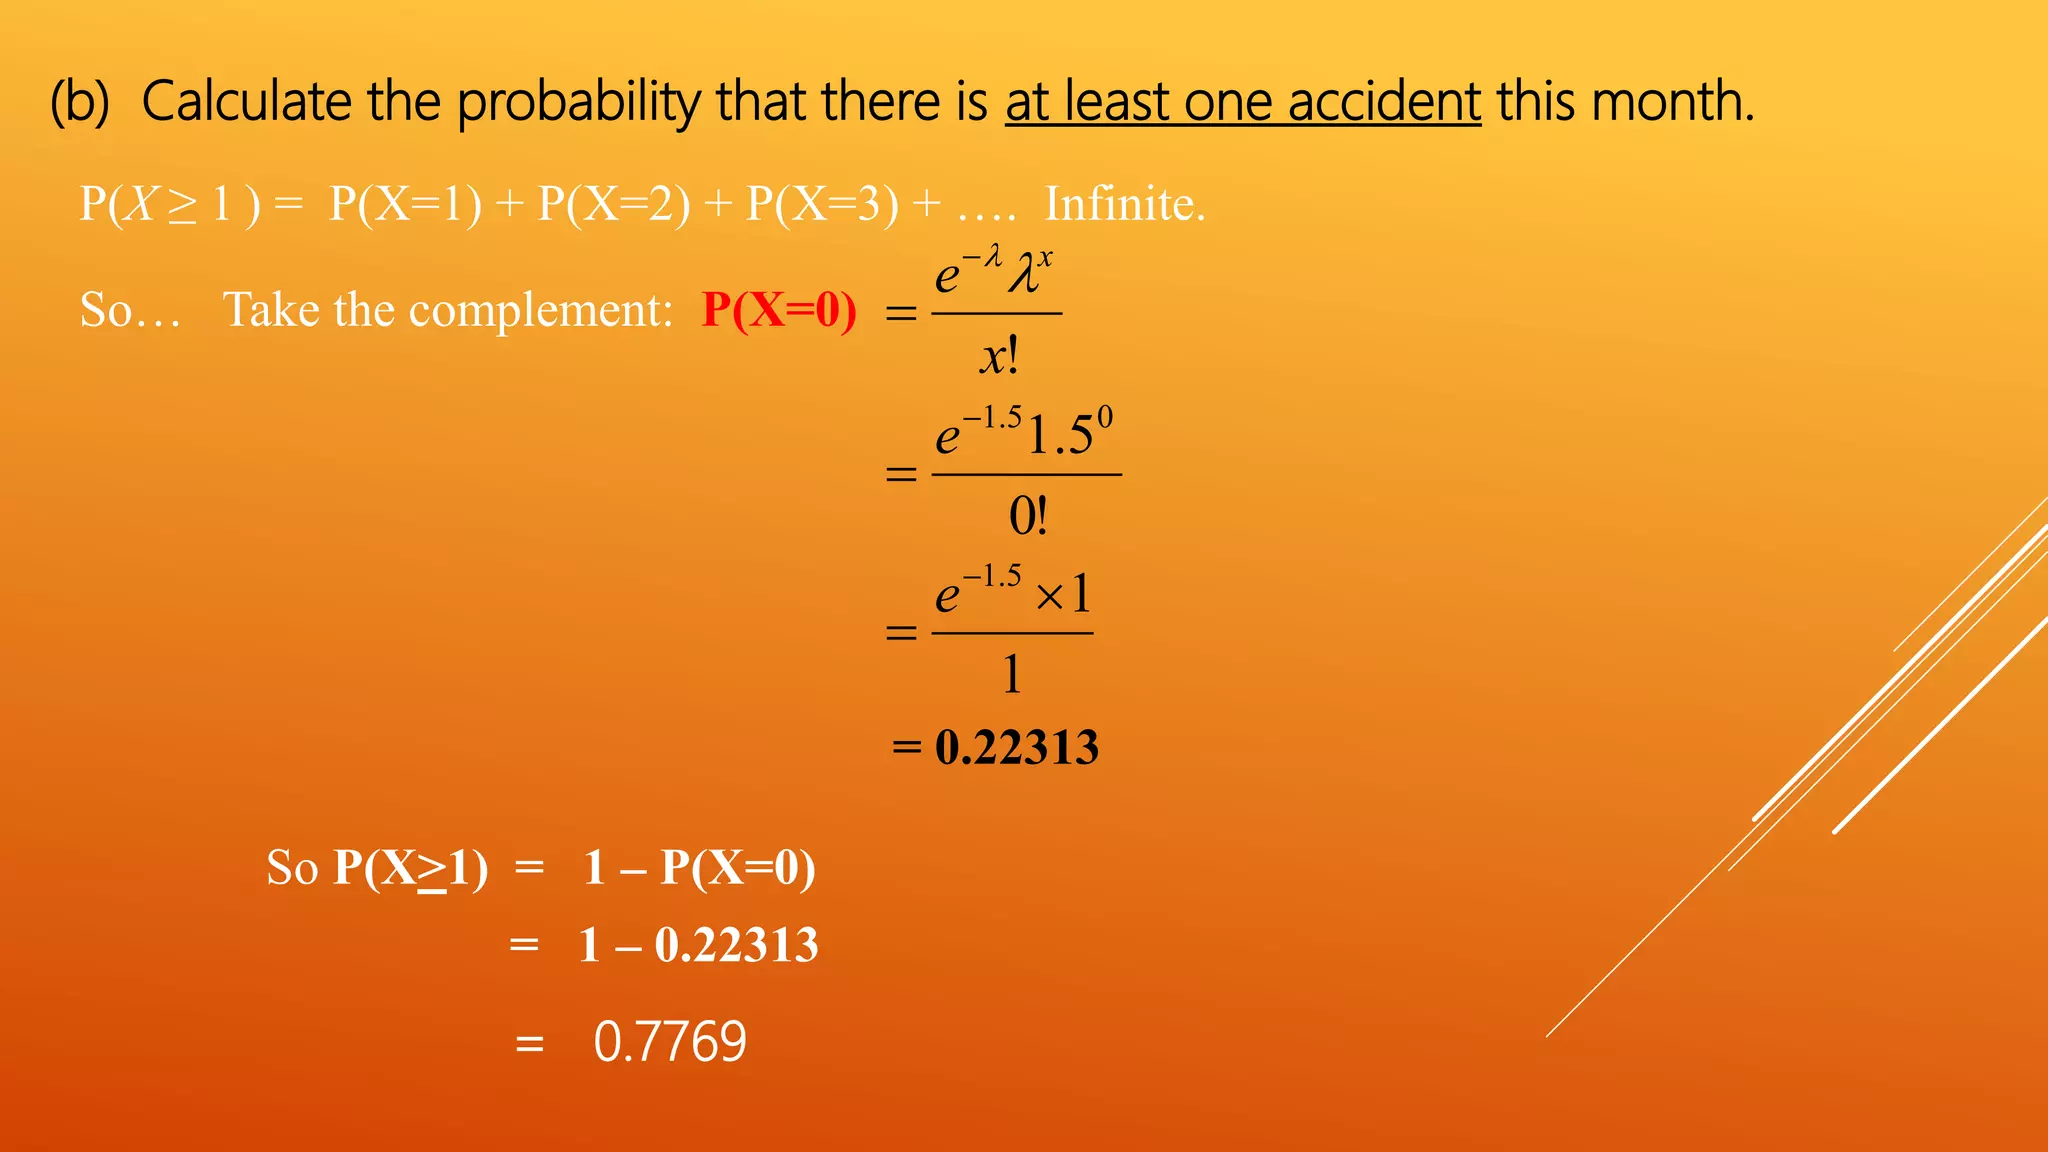
![c What is the probability that there are more than 2 accidents in a particular
month
b P(X > 2 ) = 1 – P(X < 2)
There are an infinite number of
cases so instead consider X < 2
= 1 – [ P(X =0) + P(X=1) + P(X=2)]
= 1 – [ 0.2231 + 0.3347 + 0.2510]
= 1 – 0.8088
= 0.1912](https://image.slidesharecdn.com/poissondistribution-161124043028/75/Poisson-distribution-12-2048.jpg)

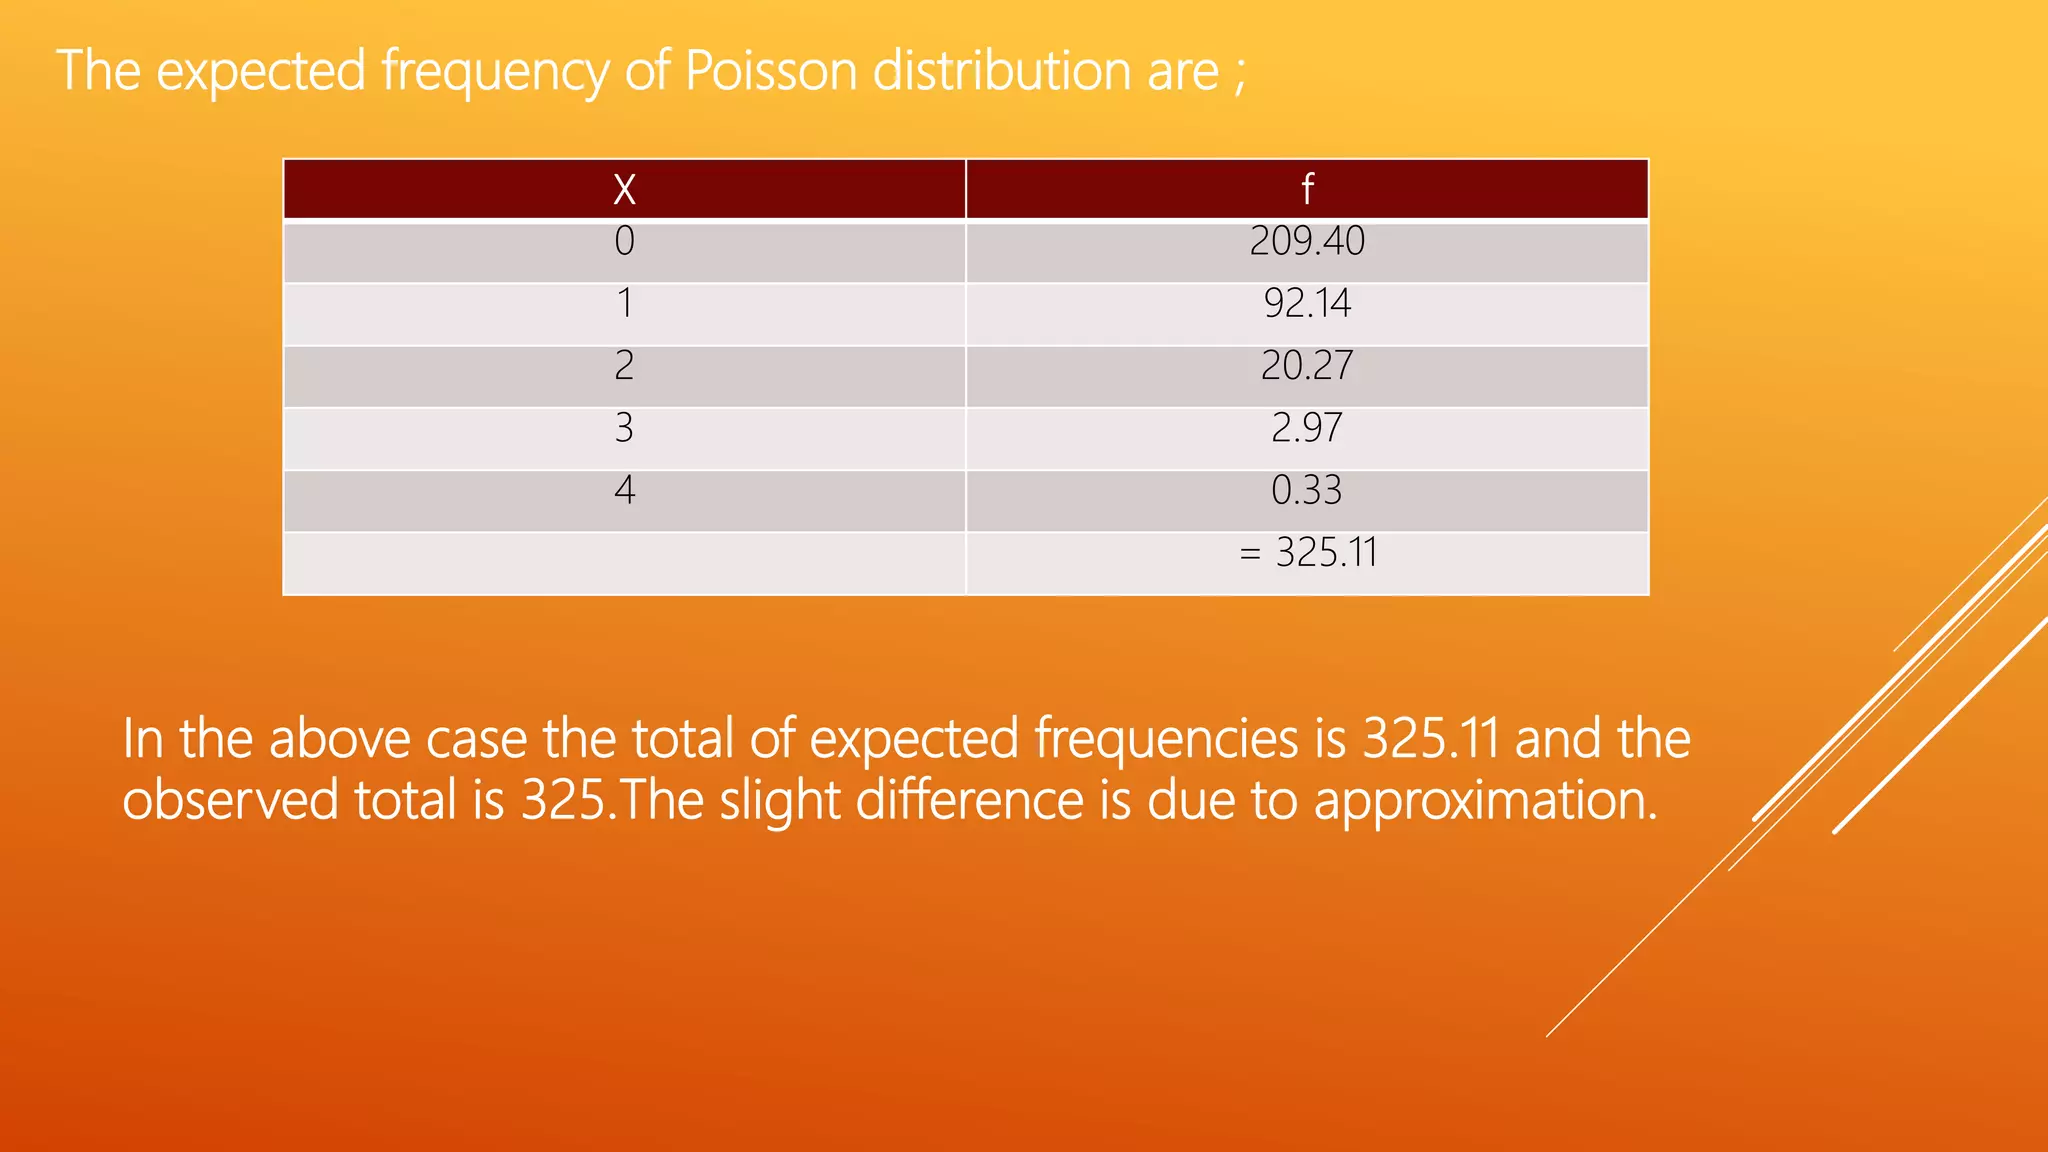
![Q) The following mistakes were observed in a book: [e0.44 = 0.6443]
X f fX
0 211 0
1 90 90
2 19 38
3 5 15
4 0 0
N = 325 ΣfX = 143
X f
0 211
1 90
2 19
3 5
4 0
Solution:](https://image.slidesharecdn.com/poissondistribution-161124043028/75/Poisson-distribution-14-2048.jpg)


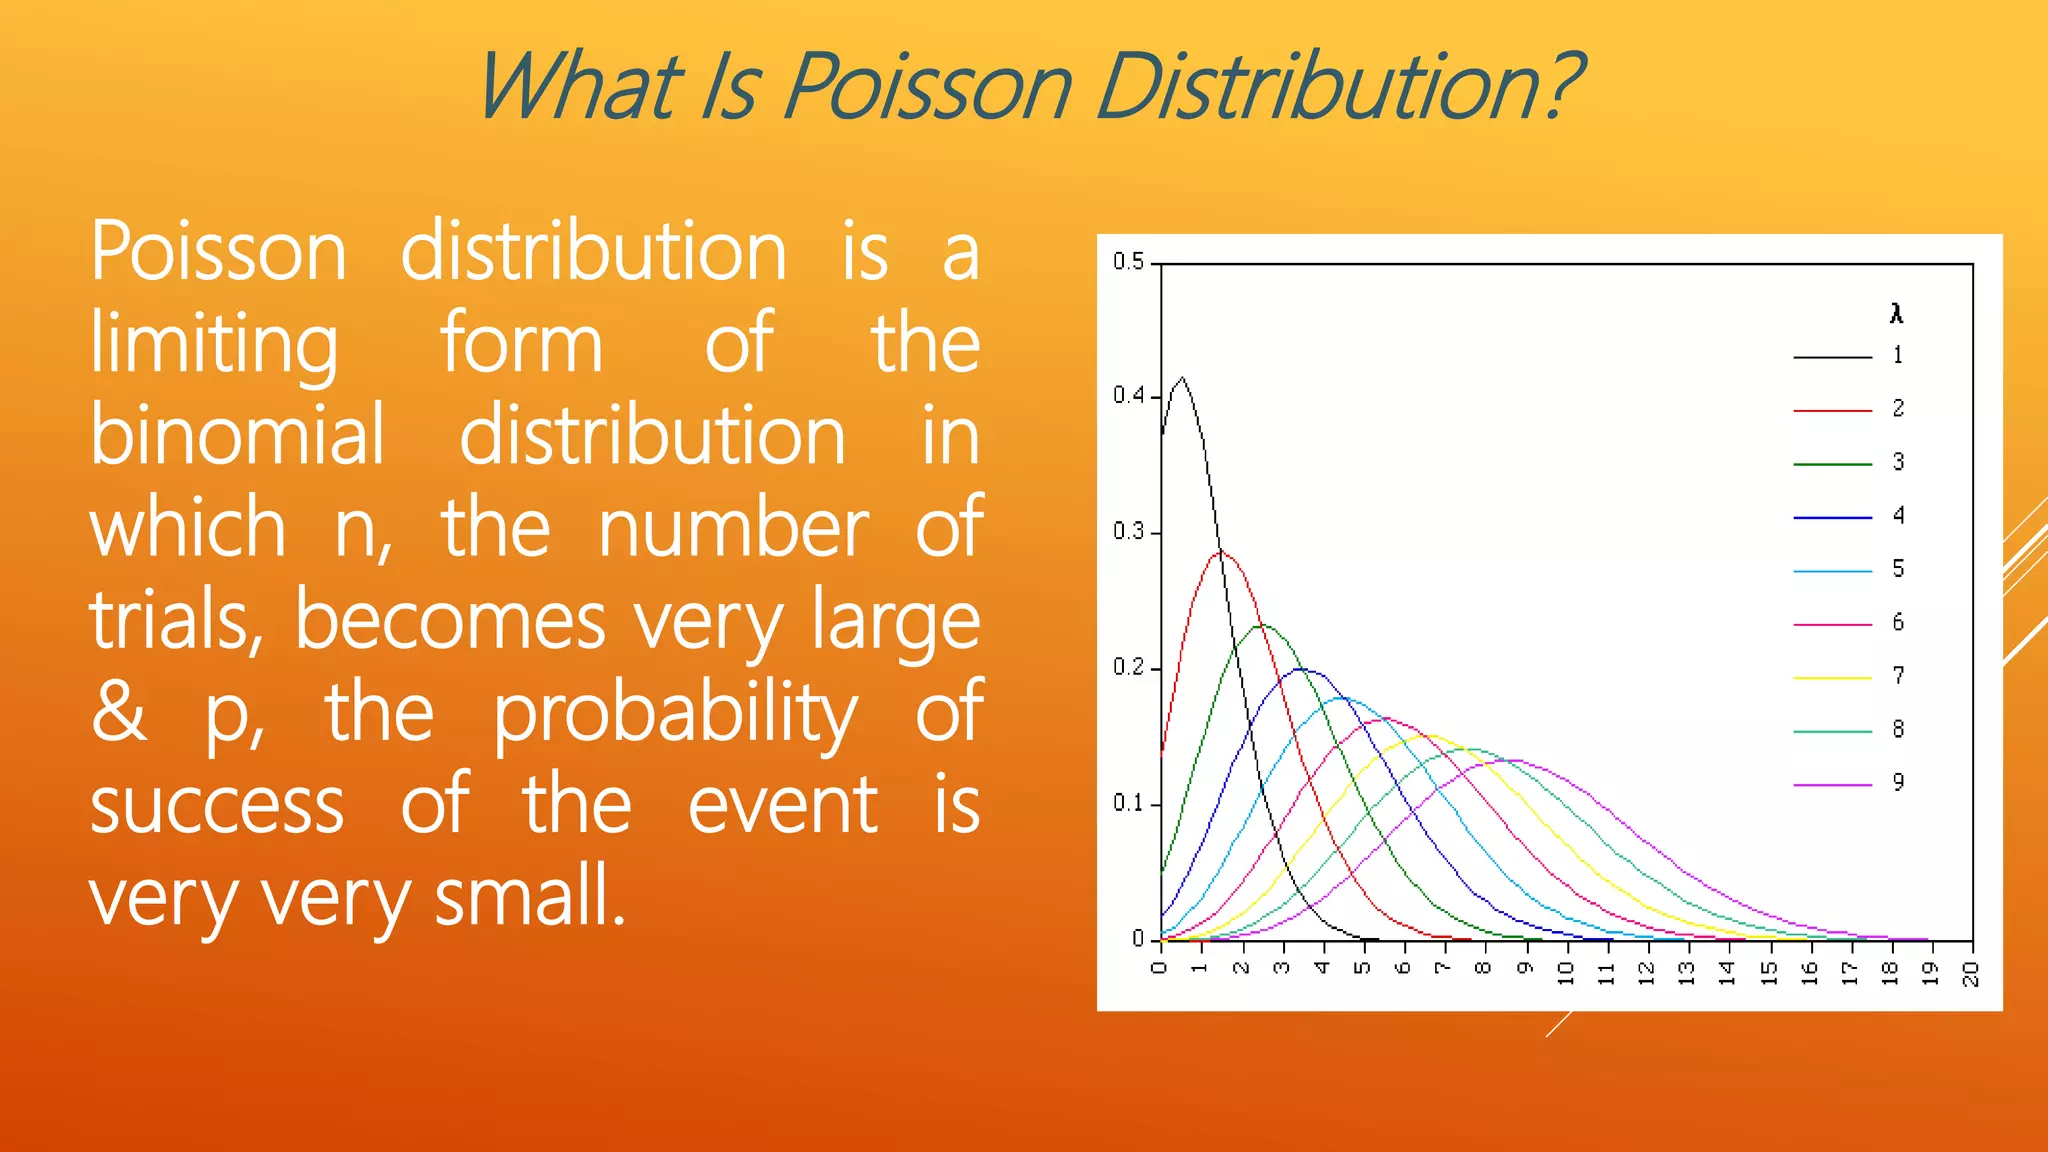
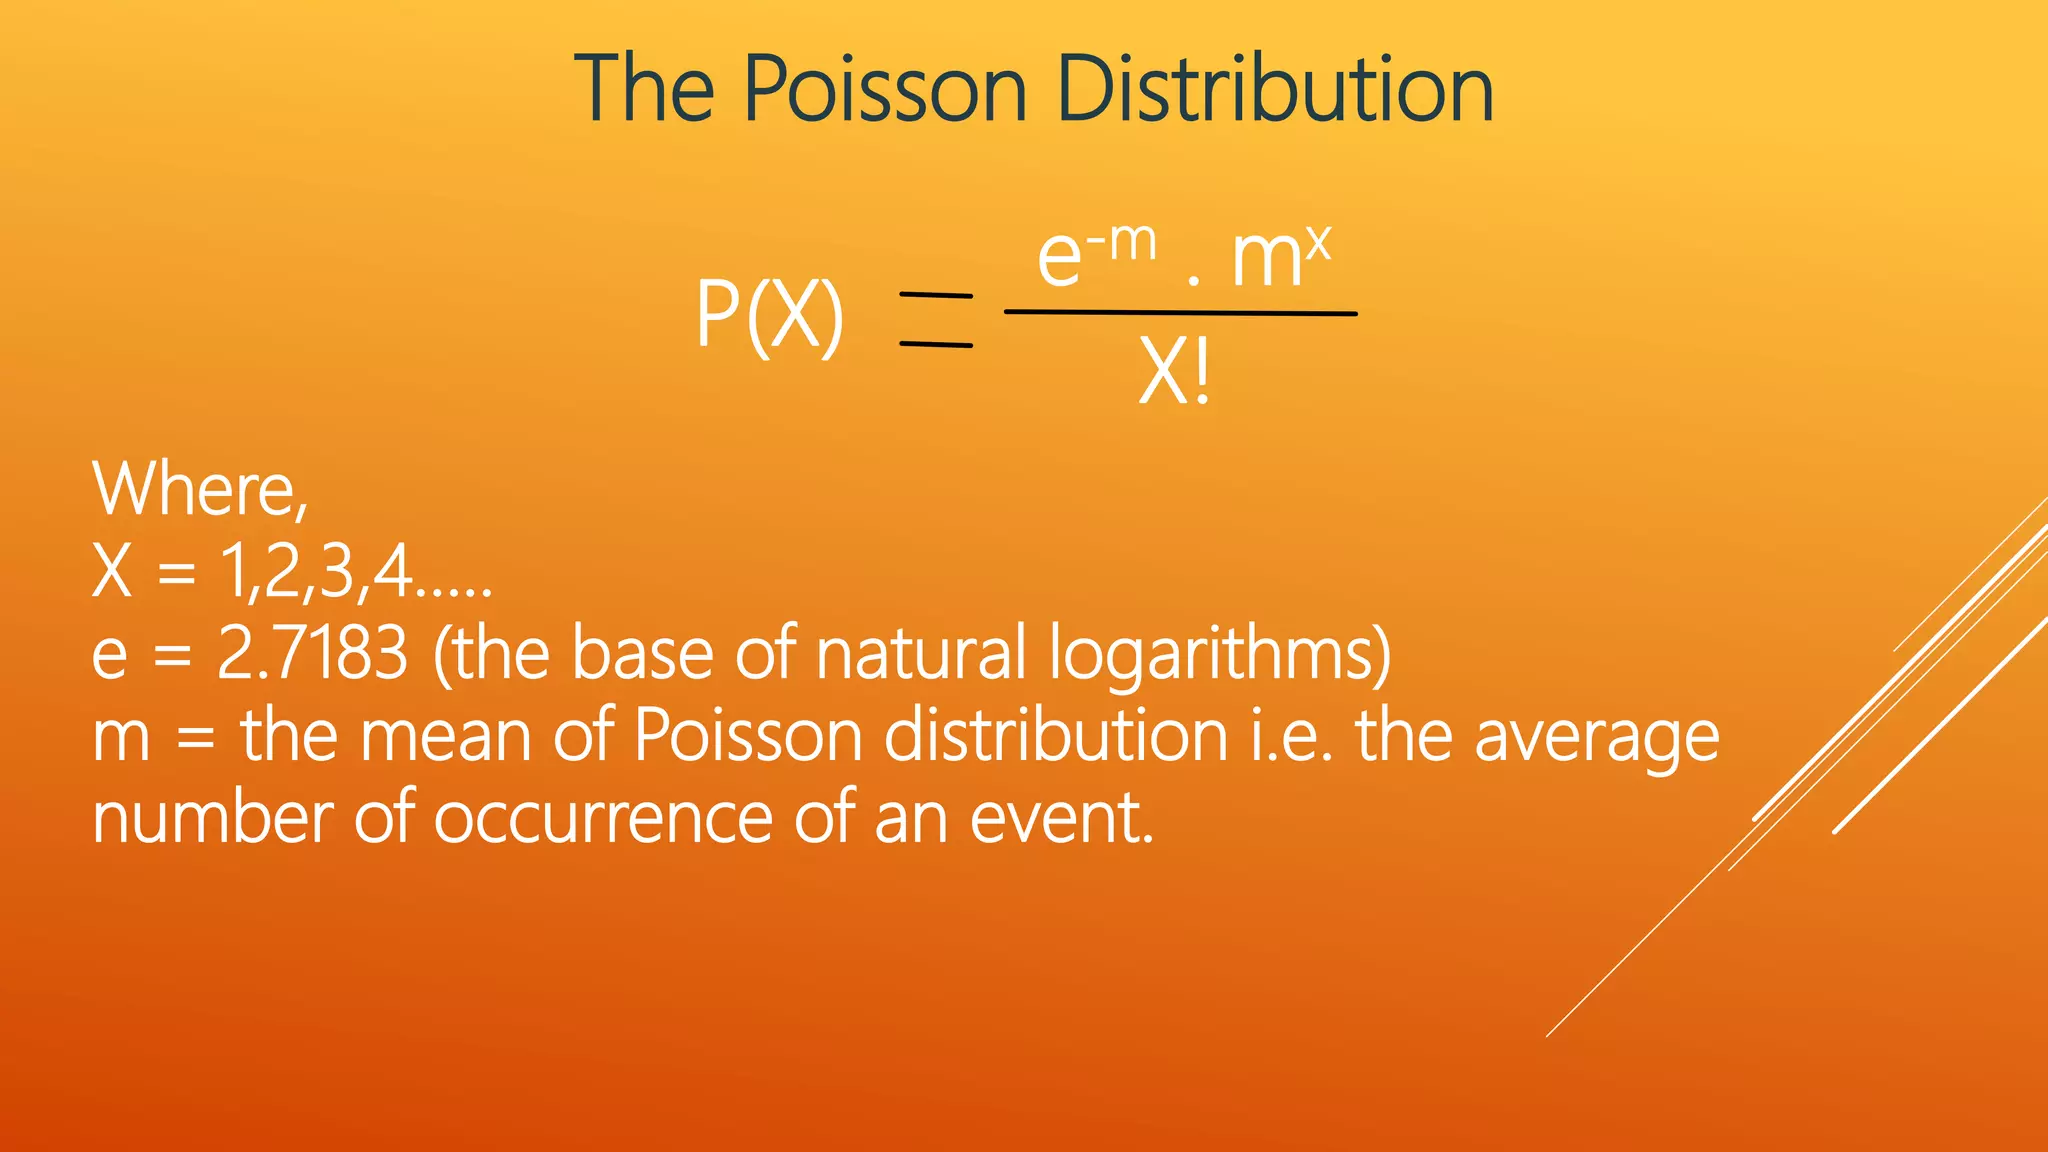
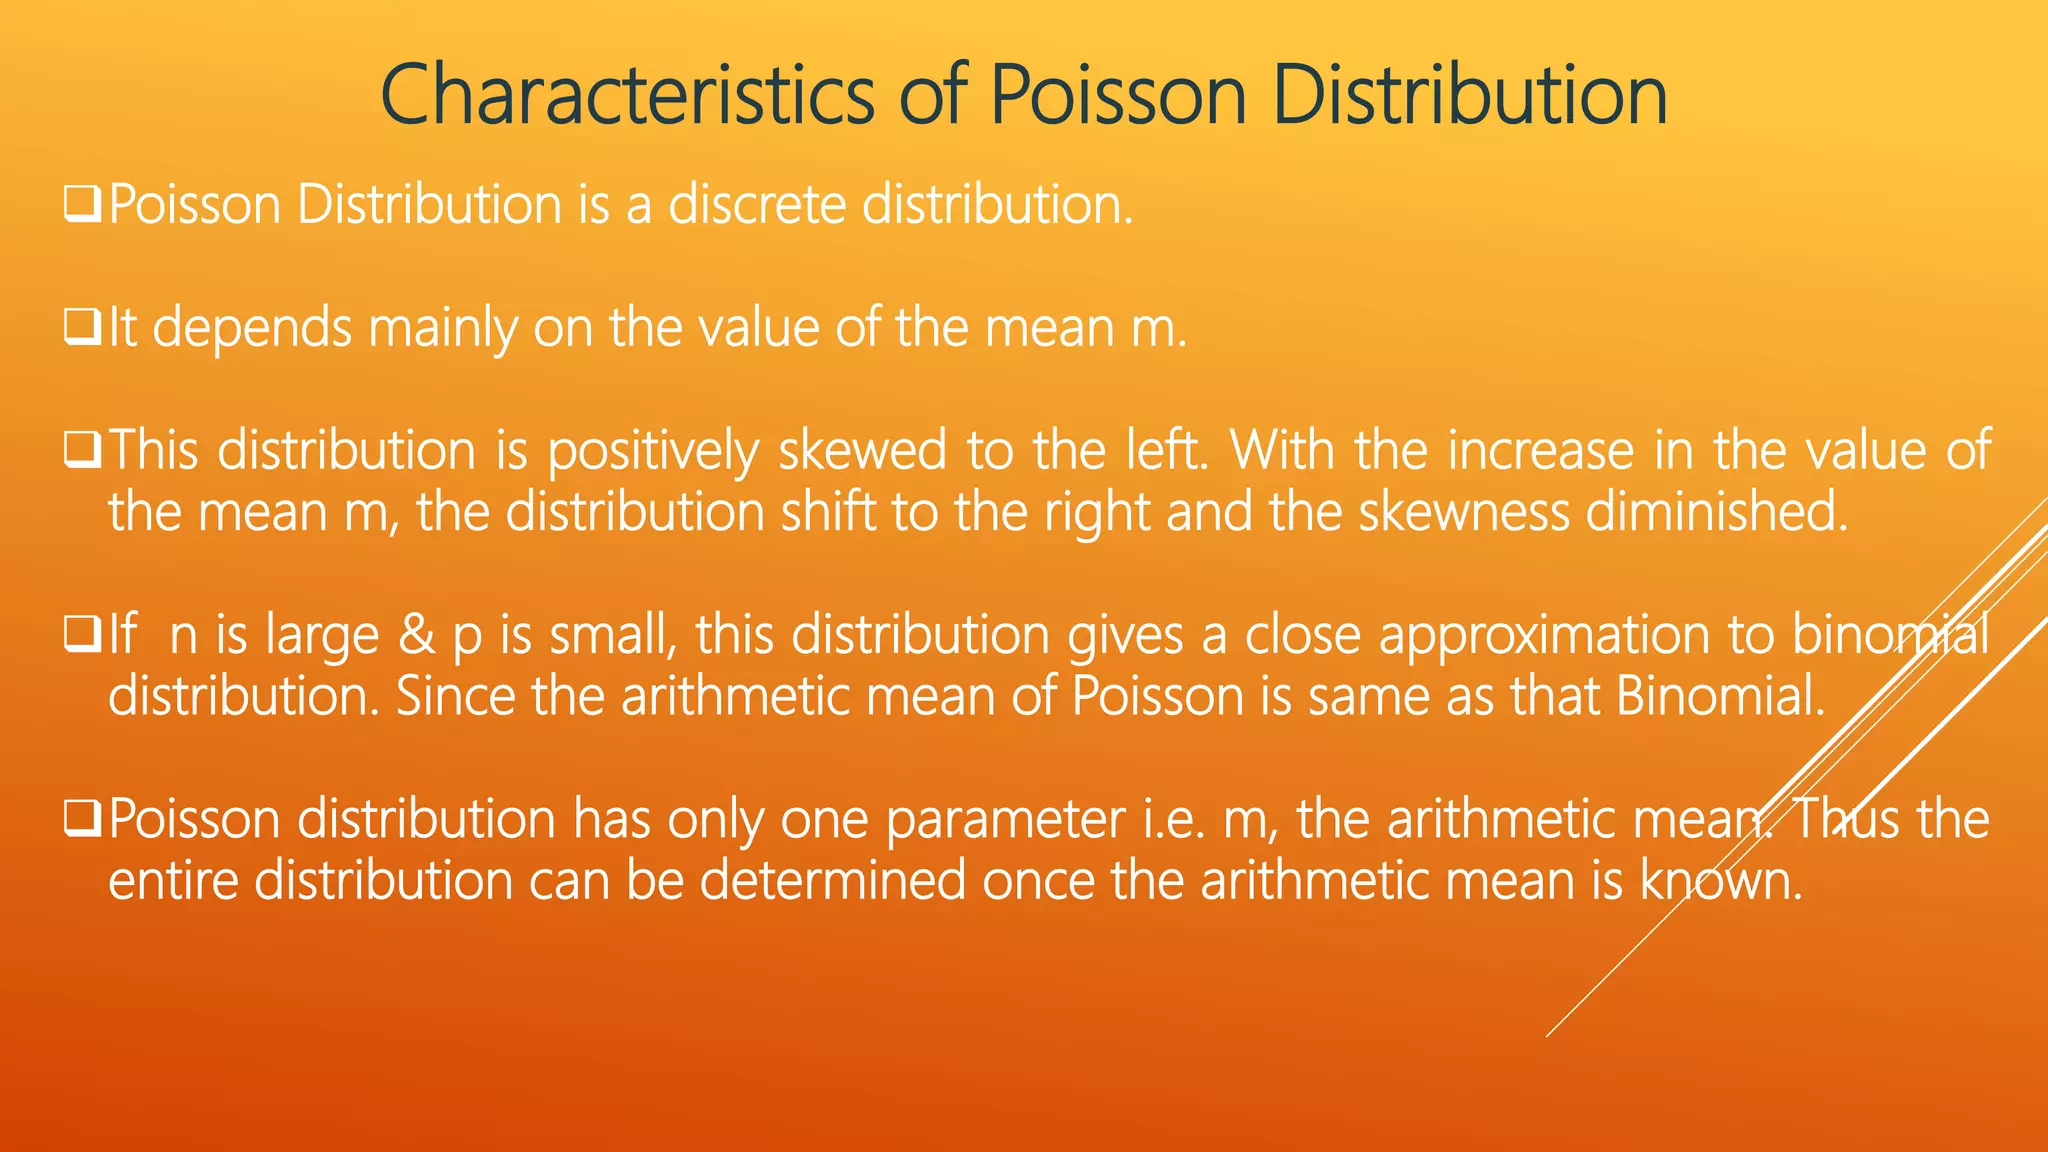
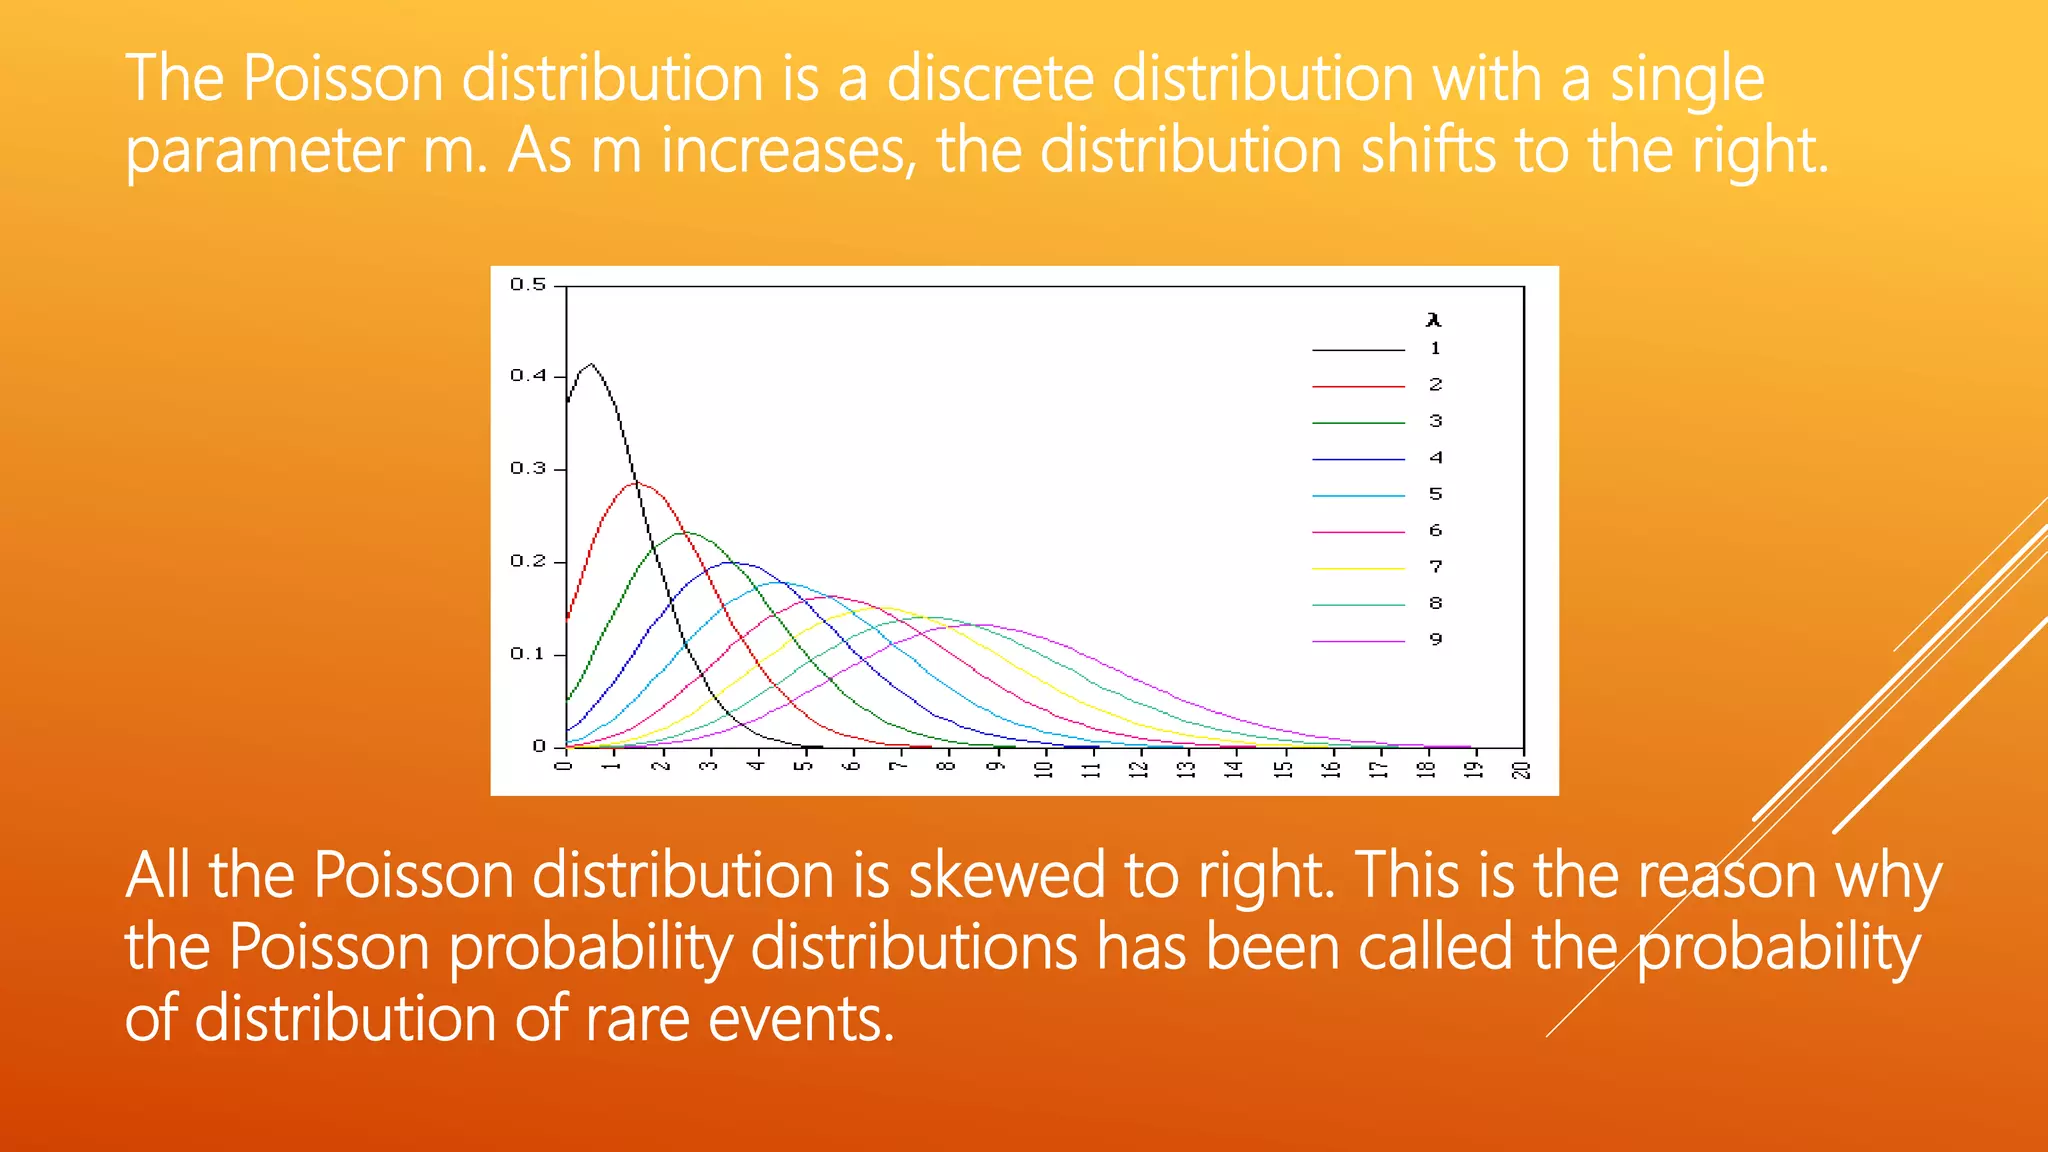
The document discusses the Poisson distribution, which describes the probability of rare events. It has one parameter, the mean (m), and is used when the number of trials is large but the probability of an individual success is small. Examples of Poisson distributions given include defects per box of screws and printing mistakes per page. The key characteristics are outlined, such as being discrete and positively skewed. The document provides an example problem calculating probabilities based on the average number of accidents per month at an intersection. It also demonstrates how to fit data to a Poisson distribution by calculating expected frequencies based on the observed mean number of events.