Q3 2024 Earnings Conference Call and Webcast Slides
India Market Falls on Global Debt Fears
1. Market Outlook
India Research
May 26, 2010
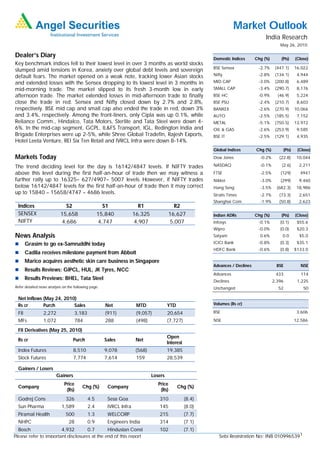
Dealer’s Diary Domestic Indices Chg (%) (Pts) (Close)
Key benchmark indices fell to their lowest level in over 3 months as world stocks
BSE Sensex -2.7% (447.1) 16,022
slumped amid tensions in Korea, anxiety over global debt levels and sovereign
default fears. The market opened on a weak note, tracking lower Asian stocks Nifty -2.8% (134.1) 4,944
and extended losses with the Sensex dropping to its lowest level in 3 months in MID CAP -3.0% (200.8) 6,489
mid-morning trade. The market slipped to its fresh 3-month low in early SMALL CAP -3.4% (290.7) 8,176
afternoon trade. The market extended losses in mid-afternoon trade to finally BSE HC -0.9% (46.9) 5,224
close the trade in red. Sensex and Nifty closed down by 2.7% and 2.8%, BSE PSU -2.4% (210.7) 8,603
respectively. BSE mid cap and small cap also ended the trade in red, down 3% BANKEX -2.6% (270.9) 10,066
and 3.4%, respectively. Among the front-liners, only Cipla was up 0.1%, while AUTO -2.5% (185.5) 7,152
Reliance Comm., Hindalco, Tata Motors, Sterlite and Tata Steel were down 4- METAL -5.1% (750.5) 13,972
6%. In the mid-cap segment, GCPL, IL&FS Transport, IGL, Redington India and OIL & GAS -2.6% (253.9) 9,585
Brigade Enterprises were up 2-5%, while Shree Global Tradefin, Rajesh Exports, BSE IT -2.5% (129.1) 4,935
Hotel Leela Venture, REI Six Ten Retail and IVRCL Infra were down 8-14%.
Global Indices Chg (%) (Pts) (Close)
Markets Today Dow Jones -0.2% (22.8) 10,044
The trend deciding level for the day is 16142/4847 levels. If NIFTY trades NASDAQ -0.1% (2.6) 2,211
above this level during the first half-an-hour of trade then we may witness a FTSE -2.5% (129) 4941
further rally up to 16325– 627/4907– 5007 levels. However, if NIFTY trades Nikkei -3.0% (299) 9,460
below 16142/4847 levels for the first half-an-hour of trade then it may correct Hang Seng -3.5% (682.3) 18,986
up to 15840 – 15658/4747 – 4686 levels. Straits Times -2.7% (73.3) 2,651
Shanghai Com -1.9% (50.8) 2,623
Indices S2 S1 R1 R2
SENSEX 15,658 15,840 16,325 16,627 Indian ADRs Chg (%) (Pts) (Close)
NIFTY 4,686 4,747 4,907 5,007 Infosys -0.1% (0.1) $55.6
Wipro -0.0% (0.0) $20.3
News Analysis Satyam 0.6% 0.0 $5.0
Grasim to go ex-Samruddhi today ICICI Bank -0.8% (0.3) $35.1
HDFC Bank -0.6% (0.8) $133.0
Cadila receives milestone payment from Abbott
Marico acquires aesthetic skin care business in Singapore
Advances / Declines BSE NSE
Results Reviews: GIPCL, HUL, JK Tyres, NCC
Advances 433 114
Results Previews: BHEL, Tata Steel Declines 2,396 1,225
Refer detailed news analysis on the following page. Unchanged 52 50
Net Inflows (May 24, 2010)
Rs cr Purch Sales Net MTD YTD Volumes (Rs cr)
FII 2,272 3,183 (911) (9,057) 20,654 BSE 3,606
MFs 1,072 784 288 (498) (7,727) NSE 12,586
FII Derivatives (May 25, 2010)
Open
Rs cr Purch Sales Net
Interest
Index Futures 8,510 9,078 (568) 19,385
Stock Futures 7,774 7,614 159 28,539
Gainers / Losers
Gainers Losers
Price Price
Company Chg (%) Company Chg (%)
(Rs) (Rs)
Godrej Cons 326 4.5 Sesa Goa 310 (8.4)
Sun Pharma 1,589 2.4 IVRCL Infra 145 (8.0)
Piramal Health 500 1.3 WELCORP 215 (7.7)
NHPC 28 0.9 Engineers India 314 (7.1)
Bosch 4,932 0.7 Hindustan Const 102 (7.1)
Please refer to important disclosures at the end of this report Sebi Registration No: INB 0109965391
2. Market Outlook | India Research
Grasim to go ex-Samruddhi today
Grasim had decided to demerge its cement business to its subsidiary, Samruddhi Cement
(Samruddhi), as part of a restructuring plan made in October 2010. As a result of the
demerger, Grasim’s shareholders will directly hold 35% in Samruddhi, while Grasim's
stake would get diluted to 65% in the company. Grasim is set to become ex-Samruddhi
from today, as a result of which every shareholder of Grasim got an additional share
Samruddhi on May 25, 2010. On completion of the demerger, Samruddhi would be listed
on the bourses in June 2010 to provide an exit opportunity to investors, as eventually
Samruddhi would be merged with Ultra Tech, wherein its shareholders will get four shares
of Ultra Tech (face value of Rs10) for every seven shares (face value of Rs5). The merger is
expected to be completed in July 2010. We have valued the company’s 60.3% stake in
Ultra Tech (after the demerger of Samruddhi) at an average EV/tonne of US $105/tonne
and 6.5x FY2012E EV/EBITDA after providing a 20% holding company discount to arrive
at a value of Rs1,569/share. We have valued the VSF business at 4x EV/EBITDA, implying
a P/BV of 1.75x on FY2012E estimates. Our SOTP Target Price for Grasim works out to
Rs2,837, without considering the demerger (Rs2,216 post merger). We maintain an
Accumulate on the stock.
Cadila receives milestone payment from Abbott
Cadila has announced that it has received Rs47.4cr from Abbott as a milestone payment
under the strategic alliance entered between the two companies earlier in May 2010 for
the supply of 24 branded generics products to Abbott for 15 emerging markets. The
agreement also has an option for additional 40 products to be included over the term of
the collaboration. The deal is likely to commercialise in FY2012. We expect the deal to be
positive as it will enable Cadila to leverage its strong product pipeline and manufacturing
capabilities. At Rs605, the stock is trading at 19.7x FY2011E and 15.2x FY2012E earnings.
We recommend Accumulate on the stock with a Target Price of Rs634.
Marico acquires aesthetic skin care business in Singapore
Marico (through Kaya Ltd.) has acquired the aesthetic business of the Singapore-based
Derma Rx Asia Pacific Pte. Ltd. (Derma Rx), through its newly incorporated subsidiary
Derma Rx International Aesthetics Pte. Ltd. The deal includes the acquisition of all IPR’s
relating to Derma Rx’s business and the shares in the wholly owned subsidiaries of Derma
Rx (The DRx Clinic, The DRx Medispa, The DRx Meditech and DRx Research Pte.). Derma
Rx, led by internationally respected Dr. SK Tan, operates three centres in Singapore and
one in Kuala Lumpur. With a customer base of 37,000, Derma Rx has generated a
turnover of Rs50cr in 2009. While the deal size has not been disclosed, the acquisition is
expected to be EPS accretive in the first year of its operations itself. We estimate the deal
size at nearly 1.5-2x sales for Rs75cr-100cr.
We believe the acquisition is in line with Marico’s strategy of growing its Kaya franchise, as
it will provide Kaya with an access to an advanced range of skincare products and strong
sourcing networks, including suppliers of products from developed nations. Moreover,
management has indicated that over time Derma Rx products will be introduced into
Kaya’s range of offerings in India and the Middle East. This will enable Kaya to increase its
revenue share, from sale of products, from the current level of about 13% to over 20%.
Due to lack of financial details, we have not factored this acquisition in our numbers. We
maintain our Neutral rating on the stock
May 26, 2010 2
3. Market Outlook | India Research
Bharti raises Rs8,500cr loan for 3G
Bharti Airtel has raised nearly Rs8,500cr from a consortium of financial institutions,
including SBI, to pay for the 3G mobile spectrum. HDFC and HDFC Bank are the other
banks in the consortium to partly finance the amount that Bharti has to pay to the
government. Bharti won the bids for 13 circles, including Delhi and Mumbai, for
Rs12,295cr. The loan is spread over six years and carries an interest rate in the 8-9%
range, said sources. Increased debt in the books would lead to higher interest outgo in
1QFY2010; however, the full impact would be seen 2QFY2010 onwards. We maintain
Buy with a Target Price of Rs360.
4QFY2010 Result Reviews
GIPCL
GIPCL's net sales declined by 12.4% yoy to Rs254cr, as against our estimates of a 9.8%
yoy increase in top line. The decrease in top line was primarily on account of decreased
fuel prices, which is a pass on. Reduction in fuel prices is attributed to increased gas
availability in the KG Basin. Fuel cost of the company declined by 15.5% yoy to Rs166cr.
However, staff costs and other expenses increased by 16.7% and 22.0%, respectively, on a
yoy basis during the quarter. Operating profits declined by 13.9% on a yoy basis to Rs62cr
on account of increased expenses. The company's bottom line for the quarter stood at
Rs36cr, up 22.8% on a yoy basis and in line with our estimates. We maintain Buy on the
stock with a Target Price of Rs135.
HUL
HUL posted top-line growth of 8.2% yoy to Rs4,316cr (Rs3,988cr) in 4QFY2010, which
was in line with our estimates of 7.3%. Growth was largely driven by volume growth of
11% (low base of 4.5% decline yoy). We note that the price war between P&G and HUL
started only in early February 2010 and the current quarter, hence, it does not reflect the
complete competitive pressure. However, a 4% decline (due to price cuts/promotional
offers largely in the detergents category) dragged topline growth. In terms of segments, the
soaps and detergents (S&D) segment posted a 1.9% yoy decline to Rs1,978cr (Rs2,016cr)
due to price cuts and intense competition in the detergents category. Nevertheless,
management has indicated of positive volume growth in soaps. Amongst other segments,
personal segments posted 18.9% yoy growth, beverages posted 15.3% yoy growth and
foods posted strong yoy growth of 22.7%. Overall FMCG sales grew 7.8%, with 5.5%
growth in HPC and 17.9% growth in the foods business.
At the operating level, HUL posted a weak performance, despite drops in input costs (down
78bp yoy), staff costs (down 36bp yoy) and overheads (down 116bp yoy), largely due to a
significant increase in advertising spends (up 39% yoy in absolute terms, 322bp yoy) due
to intense competitive pressures. Hence, EBITDA for the quarter remained flat at Rs531cr
(Rs527cr).
In terms of reported earnings, HUL posted 47% yoy growth to Rs581cr (Rs395cr), despite
muted top-line growth and margin contraction. This was largely boosted by one-off items
to the tune of Rs196cr, which include profit on sale of long-term investments (Capgemini)
amounting to Rs91cr; reduction in provision for retirement benefits of Rs53cr; and write-
back of provision against advances and diminution in value of investments in Bon Ltd vis-
à-vis loss of Rs107cr yoy due to provision for retirement benefit amounting to Rs60cr and
provision for remediation of site amounting to Rs25cr. However, on a recurring basis, HUL
reported a sharp 23% yoy decline to Rs386cr (Rs502cr) impacted by a 2,035bp yoy spike-
up in tax rate to 32.7% (12.4%) attributed to high extraordinary gains in this quarter and
rise in MAT rate. We maintain our Neutral rating on the stock.
May 26, 2010 3
4. Market Outlook | India Research
JK Tyres
JK Tyres reported its 4QFY2010 results, which were below our expectations. The company
reported net sales of Rs1,044cr, up 22.2%, on back of high base. On the operating profit
margin (OPM) front, the company reported margin of 7.2%, lower than our expectations,
due to higher raw material cost. The company reported net profit of Rs26.8cr, up 96% yoy.
For FY2010, the company recorded net sales of Rs3,678cr, up 3.4% yoy, with OPM of 11%
and net profit of Rs164cr. The stock is under review and the rating would be updated post
the conference call.
Nagarjuna Construction Company
Nagarjuna Construction Company (NCC) posted 4QFY2010 results, which were above
our estimates. The company registered top-line growth of 38.7% to Rs1,523cr against our
expectations of Rs1,355cr. Operating margin for the quarter was reported at 10%, in line
with our estimates. Bottom line reported a 168.6% increase to Rs103cr. The surge in
bottom line came primarily on account of exceptional gains booked by NCC (at Rs49.6cr)
on account of sale of investments in Gautami Power Ltd., excluding which it was in line
with our estimates. The stock is under review.
4QFY2010 Result Previews
BHEL
For 4QFY2010, we expect the company to post sales and net profit of Rs13,367cr and
Rs1,886cr, registering yoy growth of 26.8% and 40.0%, respectively. On the operating
front, the company is expected to register a 491bp expansion in operating margin, which
is expected to be around 21.0%. We remain Neutral on the stock.
Tata Steel
Tata Steel is slated to announce its 4QFY2010 standalone results. The company is
expected to deliver 7.4% yoy growth in its topline to Rs6,976cr. On the operating front, the
company is expected to report a 1,705bp expansion in its operating margin to 39.3%,
primarily on account of higher realisations. Thus, net profit is expected to increase by
113% yoy to Rs1,457cr. We maintain Buy on the stock with a Target Price of Rs697.
Economic and Political News
Finmin rejects DOT’s call to draw landline licence fee
Foreign NBFCs may get back flexibility in setting up arms
Govt. plans to keep deficit targets off FRBM, wants leeway in times of crisis
Corporate News
Hotel Leela plans to raise Rs375cr through FCCB
GMR Infra plans to raise Rs5,000cr to fund its expansion plans
Lupin gets USFDA nod for high blood pressure tablets
Source: Economic Times, Business Standard, Business Line, Financial Express, Mint
May 26, 2010 4
5. Market Outlook | India Research
Events for the day
Asian Hotels Results
Bank of India Results
BHEL Results
Godrej Industries Results
Gujarat Alkalies Results
GMDC Results
GNFC Results
HPCL Results
Indian Hotels Results
Mphasis Results
Oil India Ltd Results
REI Agro Results
Tata Steel Results
May 26, 2010 5
6. Market Outlook | India Research
Research Team Tel: 022-4040 3800 E-mail: research@angeltrade.com Website: www.angeltrade.com
DISCLAIMER
This document is solely for the personal information of the recipient, and must not be singularly used as the basis of any investment decision. Nothing in
this document should be construed as investment or financial advice. Each recipient of this document should make such investigations as they deem
necessary to arrive at an independent evaluation of an investment in the securities of the companies referred to in this document (including the merits and
risks involved), and should consult their own advisors to determine the merits and risks of such an investment.
Angel Securities Limited, its affiliates, directors, its proprietary trading and investment businesses may, from time to time, make investment decisions that
are inconsistent with or contradictory to the recommendations expressed herein. The views contained in this document are those of the analyst, and the
company may or may not subscribe to all the views expressed within.
Reports based on technical and derivative analysis center on studying charts of a stock's price movement, outstanding positions and trading volume, as
opposed to focusing on a company's fundamentals and, as such, may not match with a report on a company's fundamentals.
The information in this document has been printed on the basis of publicly available information, internal data and other reliable sources believed to be
true, and is for general guidance only. Angel Securities Limited has not independently verified all the information contained within this document.
Accordingly, we cannot testify, nor make any representation or warranty, express or implied, to the accuracy, contents or data contained within this
document. While Angel Securities Limited endeavours to update on a reasonable basis the information discussed in this material, there may be
regulatory, compliance, or other reasons that prevent us from doing so.
This document is being supplied to you solely for your information, and its contents, information or data may not be reproduced, redistributed or passed
on, directly or indirectly.
Angel Securities Limited and its affiliates may seek to provide or have engaged in providing corporate finance, investment banking or other advisory
services in a merger or specific transaction to the companies referred to in this report, as on the date of this report or in the past.
Neither Angel Securities Limited, nor its directors, employees or affiliates shall be liable for any loss or damage that may arise from or in connection with
the use of this information.
Note: Please refer to the important `Stock Holding Disclosure' report on the Angel website (Research Section).
Address: Acme Plaza, ‘A’ Wing, 3rd Floor, M.V. Road, Opp. Sangam Cinema, Andheri (E), Mumbai - 400 059.
Tel : (022) 3952 4568 / 4040 3800
Angel Broking Ltd: BSE Sebi Regn No : INB 010996539 / CDSL Regn No: IN - DP - CDSL - 234 - 2004 / PMS Regn Code: PM/INP000001546 Angel Securities Ltd:BSE: INB010994639/INF010994639 NSE:
INB230994635/INF230994635 Membership numbers: BSE 028/NSE:09946
Angel Capital & Debt Market Ltd: INB 231279838 / NSE FNO: INF 231279838 / NSE Member code -12798 Angel Commodities Broking (P) Ltd: MCX Member ID: 12685 / FMC Regn No: MCX / TCM /
CORP / 0037 NCDEX : Member ID 00220 / FMC Regn No: NCDEX / TCM / CORP / 0302
May 26, 2010 6