1. Weekly Review
October 16, 2010
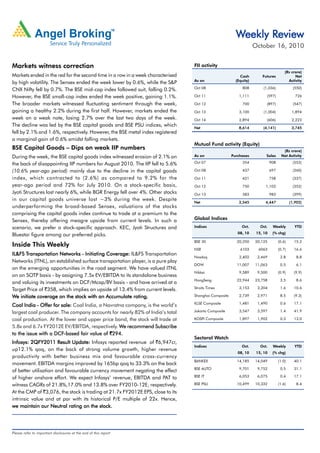
Markets witness correction FII activity
(Rs crore)
Markets ended in the red for the second time in a row in a week characterised Cash Futures Net
As on (Equity) Activity
by high volatility. The Sensex ended the week lower by 0.6%, while the S&P
CNX Nifty fell by 0.7%. The BSE mid-cap index followed suit, falling 0.2%. Oct 08 808 (1,036) (550)
However, the BSE small-cap index ended the week positive, gaining 1.1%. Oct 11 1,111 (597) 726
The broader markets witnessed fluctuating sentiment through the week, Oct 12 700 (897) (547)
gaining a healthy 2.2% during the first half. However, markets ended the Oct 13 3,100 (1,004) 1,894
week on a weak note, losing 2.7% over the last two days of the week. Oct 14 2,894 (606) 2,223
The decline was led by the BSE capital goods and BSE PSU indices, which Net 8,614 (4,141) 3,745
fell by 2.1% and 1.6%, respectively. However, the BSE metal index registered
a marginal gain of 0.6% amidst falling markets.
Mutual Fund activity (Equity)
BSE Capital Goods – Dips on weak IIP numbers (Rs crore)
During the week, the BSE capital goods index witnessed erosion of 2.1% on As on Purchases Sales Net Activity
the back of disappointing IIP numbers for August 2010. The IIP fell to 5.6% Oct 07 354 908 (553)
(10.6% year-ago period) mainly due to the decline in the capital goods Oct 08 437 697 (260)
index, which contracted to (2.6%) as compared to 9.2% for the Oct 11 421 758 (337)
year-ago period and 72% for July 2010. On a stock-specific basis, Oct 12 750 1,102 (352)
Jyoti Structures lost nearly 6%, while BGR Energy fell over 4%. Other stocks Oct 13 583 983 (399)
in our capital goods universe lost ~3% during the week. Despite
Net 2,545 4,447 (1,902)
underperforming the broad-based Sensex, valuations of the stocks
comprising the capital goods index continue to trade at a premium to the
Sensex, thereby offering meagre upside from current levels. In such a Global Indices
scenario, we prefer a stock-specific approach. KEC, Jyoti Structures and Indices Oct. Oct. Weekly YTD
08, 10 15, 10 (% chg)
Bluestar figure among our preferred picks.
BSE 30 20,250 20,125 (0.6) 15.2
Inside This Weekly
NSE 6103 6063 (0.7) 16.6
IL&FS Transportation Networks - Initiating Coverage: IL&FS Transportation
Transportation
Nasdaq 2,402 2,469 2.8 8.8
Networks (ITNL), an established surface transportation player, is a pure play
DOW 11,007 11,063 0.5 6.1
on the emerging opportunities in the road segment. We have valued ITNL
Nikkei 9,589 9,500 (0.9) (9.9)
on an SOTP basis - by assigning 7.5x EV/EBITDA to its standalone business
HangSeng 22,944 23,758 3.5 8.6
and valuing its investments on DCF/Mcap/BV basis - and have arrived at a
Target Price of `358, which implies an upside of 13.4% from current levels. Straits Times 3,153 3,204 1.6 10.6
rating.
We initiate coverage on the stock with an Accumulate rating. Shanghai Composite 2,739 2,971 8.5 (9.3)
KLSE Composite 1,481 1,490 0.6 17.1
Coal India - Offer for sale: Coal India, a Navratna company, is the world’s
largest coal producer. The company accounts for nearly 82% of India’s total Jakarta Composite 3,547 3,597 1.4 41.9
coal production. At the lower and upper price band, the stock will trade at KOSPI Composite 1,897 1,902 0.3 13.0
5.8x and 6.7x FY2012E EV/EBITDA, respectively. We recommend Subscribe
DCF-based
to the issue with a DCF-based fair value of `294.
Sectoral Watch
Infosys: 2QFY2011 Result Update: Infosys reported revenue of `6,947cr,
Indices Oct. Oct. Weekly YTD
up12.1% qoq, on the back of strong volume growth, higher revenue
08, 10 15, 10 (% chg)
productivity with better business mix and favourable cross-currency
BANKEX 14,185 14,049 (1.0) 40.1
movement. EBITDA margins improved by 165bp qoq to 33.3% on the back
BSE AUTO 9,701 9,752 0.5 31.1
of better utilisation and favourable currency movement negating the effect
of higher onshore effort. We expect Infosys’ revenue, EBITDA and PAT to BSE IT 6,053 6,075 0.4 17.1
witness CAGRs of 21.8%,17.0% and 13.8% over FY2010-12E, respectively. BSE PSU 10,499 10,332 (1.6) 8.4
At the CMP of `3,076, the stock is trading at 21.7x FY2012E EPS, close to its
intrinsic value and at par with its historical P/E multiple of 22x. Hence,
we maintain our Neutral rating on the stock.
Please refer to important disclosures at the end of this report
2. Fundamental Focus | October 16, 2010
Focus
IL&FS Transportation Networks - Accumulate Price - `316
Target Price - `358
Initiating Coverage
Numero Uno We have valued ITNL on SOTP basis - by assigning 7.5x
EV/EBITDA to its standalone business and valued its investments
IL&FS Transportation Networks (ITNL), an established surface
on DCF/Mcap/BV basis - and arrived at a target price of `358,
transportation player, is a pure play on the emerging
which implies an upside of 13.4% from current levels.
opportunities in the road segment.
On standalone basis, the company derives its income from
Market leader with diversified presence: ITNL has highest
advisory fees and C&EPC work. We are expecting the company
coverage among peers with ~7,500 lane km (22 projects) with
to post a CAGR of 125.9% and 19.4% on the top-line and
a project capitalisation of ~`14,673cr (adjusted for its share),
bottom-line front over FY2010-12E. We have valued this
which we believe gives it an edge in bidding for new projects in
business on EV/EBITDA basis given the balance sheet is loaded
terms of technical capability and experience. Moreover, these
with debt and have applied a similar multiple for its peers like
projects are geographically spread out and bi-furcated into toll
IVRCL, NCC, HCC etc. We thus arrive at a value of
and annuity, which cushions its revenues due to limited exposure
`159/share for the standalone business. We have valued the
to any one region or project.
existing BOT projects of ITNL at `151/share based on the net
ITNL in sweet spot to capitalise on emerging opportunities: present value (NPV) of the cash flows to equity. We have assumed
ITNL is well poised to leverage on the growing opportunities in cost of equity at 14% for all the projects. Other key assumptions
the road segment owing to its: 1) strong parentage, include interest cost at ~10-11% p.a. and traffic and toll growth
2) experienced management; 3) unique business model; and for toll projects at 5% p.a. It should be noted that we have
4) favourable developments at NHAI. valued Noida Toll Bridge on Mcap basis fetching a value of
Favourable industry dynamics: We expect NHAI to award `6.5/share. We have valued Gurgaon Metro, Vansh Nimay
~33,500km over FY2011-15 in line with its set target of project and Elsamex on P/BV basis fetching values of
constructing 20km/day. The expressways and mega highway `1.1/share, `0.7/share and `24.7/share respectively. Hence,
projects also offer opportunity to the tune of `62,600cr. we initiate coverage on the stock with an Accumulate rating
SOTP Target Price
and a SOTP Target Price of `358/share.
Financial Outlook
We expect ITNL to post CAGR of 59% in consolidated top-line Key Financials (Consolidated)
over FY2010-12E owing to its recent order winning spree and Y/E March (` cr) FY2009 FY2010 FY2011E FY2012E
bidding pipeline. However, given the increasing share of low- Net Sales 1,225 2,403 3,480 6,071
margin C&EPC in consolidated top-line, we expect EBITDA
% chg 238.9 96.1 44.8 74.5
margins to normalise to 19.8% in FY2012E from 33.1% in
FY2010. During the mentioned period, we estimate the Profit
Adj. Net Profit 26.2 344.4 424.3 502.8
company's bottom-line to log a CAGR 21%. % chg (71.9) 1,212.8 23.2 18.5
Outlook and Valuation FDEPS (`) 1.4 17.7 21.8 25.9
EBITDA Margin (%) 15.8 33.1 26.7 19.8
There has been strong focus on re-vitalising the road sector
particularly since the re-election of the UPA government in May P/E (x) 234.0 17.8 14.5 12.2
2009. MORTH has set itself the target of constructing RoAE (%) 2.8 26.2 22.5 22.1
20km/day as well as introduced policy reforms to encourage RoACE (%) 5.6 17.9 12.6 9.6
more private participation in the sector. We believe that all such
P/BV (x) 6.7 3.6 3.0 2.5
changes in the positive direction have encouraged more
participation from the private sector. Therefore, we are bullish EV/Sales (x) 6.4 3.7 3.3 2.9
on the prospects of the road sector and would like to bet on the EV/EBITDA (x) 40.5 11.2 12.4 14.5
market leaders to seize the opportunity. Source: Company, Angel Research; Price as on October 12, 2010
Research Analyst - Shailesh Kanani/Nitin Arora
For Private Circulation Only | Angel Broking Ltd: BSE Sebi Regn No : INB 010996539 / CDSL Regn No: IN - DP - CDSL - 234 - 2004 / PMS Regn Code: PM/INP00000154 6 Angel Securities Ltd:BSE: INB010994639/INF010994639 NSE: INB230994635/INF230994635 Membership numbers: BSE 028/NSE:09946 2
3. Fundamental Focus | October 16, 2010
Focus
Coal India - Subscribe
Offer for sale
Co(a)llateral growth mines, which have significantly lower production cost
(US $11/tonne), accounts for 90% of its total production as
Coal India (CIL), a Navratna company, is the world's largest
compared to underground mines, which have a higher
coal producer. The company accounts for nearly 82% of India's
production cost of US $59/tonne.
total coal production. We recommend Subscribe to the issue
DCF-based
with a DCF-based fair value of `294.
294. Key risks to CIL's earnings and our estimates: 1) Regulatory
hurdles causing a delay in production ramp-up; 2) infrastructure
Enjoys largest reserves and production base: CIL has the world's
bottlenecks; 3) amendments in the mining policy, which require
largest coal reserves, at 19bn tonnes, as per JORC's guidelines.
sharing of profits; and 4) ongoing environmental debate on
The company's proved reserves stand high at 11bn tonnes,
'Go/No Go' regions.
constituting 56.2% of its total reserves. CIL, the biggest coal
producer globally, produced 431mn tonnes of coal in FY2010. Valuation:
Outlook and Valuation:
supply, CIL:
Domestic coal demand outpacing supply, favourable for CIL: At the lower price band, CIL will trade at 8.2x and 5.8x FY2011E
Demand is likely to witness a 10.6% CAGR over FY2010-15E and FY2012E EV/EBITDA; while at the upper band, it will trade
as the power sector, which accounts for nearly 75% of the total at 9.3x and 6.7x its FY2011E and FY2012E EV/EBITDA.
coal demand, is likely to see an exponential growth as ~60MW On the P/E basis, the company will trade at 13.5x and 11.2x
of thermal capacity gets added over FY2010-15E. With FY2011E and FY2012E earnings; while at the upper band,
production expected to post an 8.6% CAGR over the same it will trade at 14.7x and 12.2x its FY2011E and FY2012E
period, lagging demand, India will remain structurally deficient earnings. We have arrived at a fair value of `294 using the
in coal, thus placing CIL in a favourable position. DCF methodology and have assumed a discounting rate of
13.9% and perpetual growth of 3%.
Increasing focus on capacity expansion: In addition to 32
projects that were implemented in FY2010, 25 projects with a
capacity of 47.5mn tonnes are expected to become operational
by the end of FY2012E. Further, 20 projects with a capacity of
Key Financials (Consolidated)
33.3mn tonnes are expected to come on stream during the
Y/E March (` cr) FY2009 FY2010 FY2011E FY2012E
12th Five Year Plan. Moreover, CIL plans to set up additional
20 coal beneficiation facilities with a proposed capacity of Net sales 40,811 46,684 50,183 55,971
111.1mn tonnes. % chg 17.9 14.4 7.5 11.5
Significant leeway to increase prices: CIL sells raw coal at a Net profit 4,063 9,834 10,518 12,712
~63% discount to global prices. We expect blended realisations % chg (5.2) 142.1 7.0 20.9
to increase at a 6.1% CAGR over FY2010-15E on account of EPS (`) 6.4 15.6 16.7 20.1
a) a 5.1% CAGR increase in raw coal's notified price over
EBITDA (%) 6.0 22.0 23.5 26.7
FY2010-15E, b) increased proportion of beneficiated coal sales,
P/E (x) 38.1 15.7 14.7 12.2
which commands a ~120% premium over the notified coal
P/BV (x) 8.1 6.0 4.7 3.7
price and c) gradual increase in e-auction sales volumes from
11.6% of raw coal sales in FY2010 to 12.5% in FY2012E, where RoE (%) 22.4 43.8 35.7 33.8
realised price is likely to be ~60% higher than the notified price. RoCE (%) 3.6 34.5 31.1 32.1
Competitive cost structure: CIL is one of the lowest-cost coal EV/Sales (x) 3.1 2.5 2.2 1.8
producers in the world, with an average blended cost of EV/EBITDA (x) 51.7 11.5 9.3 6.7
US $16/tonne. This is because CIL's production from open cast Source: Company, Angel Research; Ratio calculated at the upper price band
Research Analyst - Paresh Jain/Pooja Jain
For Private Circulation Only | Angel Broking Ltd: BSE Sebi Regn No : INB 010996539 / CDSL Regn No: IN - DP - CDSL - 234 - 2004 / PMS Regn Code: PM/INP00000154 6 Angel Securities Ltd:BSE: INB010994639/INF010994639 NSE: INB230994635/INF230994635 Membership numbers: BSE 028/NSE:09946 3
4. Fundamental Focus | October 16, 2010
Focus
Axis Bank - Accumulate Price - `1,563
Target Price - `1,705
2QFY2011 Result Update
Performance Highlights restructured assets till 2QFY2011, however declined to `2,061cr
(1.7% of gross customer assets) from `2,151cr in 1QFY2011.
Particulars 2QFY11 1QFY11 % chg 2QFY10 % chg
(` cr) (qoq) (yoy) Reasonable non-interest income growth: Fee income registered
NII 1,615 1,514 6.7 1,150 40.5 18% yoy growth to `849cr (`719cr) during 2QFY2011, with
Pre-Prov Profit 1,486 1,450 2.5 1,306 13.8 strong contribution from the corporate segment. Fee income
PAT 735 742 (0.9) 532 38.3 from large and mid-corporate credit (including infrastructure)
Source: Company, Angel Research
grew 54% yoy, followed by capital markets (23% yoy), treasury
Axis Bank has announced its 2QFY2011 results wherein it and debt and capital markets (12% yoy) and retail business
registered net profit growth of 38.3% on a yoy basis to `735cr, (7% yoy).
which was marginally better than our estimate of `706cr mainly Outlook and Valuation
on account of the better-than-estimated other income. Strong
At the CMP the stock is trading at 2.9x FY2012E ABV. Our
,
operating performance and stable asset quality were the key
Target P/ABV multiple of 3.2x on FY2012 estimates, is at a
positives of the result.
20% discount to our Target P/ABV multiple of 4.0x for HDFC
Advances and Deposits growth above industry: Advances Bank, keeping in mind the relatively higher credit and market
increased by a moderate 1.8% sequentially (by a robust 36.5% risks. However, we believe that going ahead as Axis Bank
yoy) to `1,10,593cr, while deposits increased to `1,56,887cr, establishes a longer and more credible track record of pricing
a robust growth of 35.7% yoy and 6.4% sequentially, well above and managing risks, this gap vis-à-vis HDFC Bank could
the industry growth rate. The advances growth was driven by narrow down.
the large and mid-corporate segment (mainly infrastructure, IT
We remain positive on the bank and believe that it deserves
and ITES, cement and metals), which increased by ~59.0%
premium valuations on account of its attractive CASA franchise,
yoy. Consequently, the NII of the bank recorded a growth of
multiple sources of sustainable fee income, strong growth
40.5% yoy and 6.7% sequentially.
outlook and A-list management. We maintain an Accumulate
The deposit growth was driven by the 11.5% qoq growth in recommendation on the stock, with a Target Price of `1,705,
Target Price
current account balances. The CASA ratio of the bank improved implying an upside of 9.1% from current levels.
to 41.5% from 40.2% in 1QFY2011, but it was lower than
Key Financials (Standalone)
42.8% registered in 2QFY2010. On the positive side, the daily
average balances of savings deposits grew 40.9% yoy, while Y/E March (` cr) FY2009 FY2010 FY2011E FY2012E
those of the current account deposits grew by 35.5% yoy. NII 3,686 5,004 6,491 8,174
Reported NIM at 3.68%, registered a marginal decline of 3bp % chg 42.6 35.8 29.7 25.9
on account of increase in cost of funds in the system as a whole. Profit
Net Profit 1,815 2,515 3,158 4,223
Asset quality stable: The gross slippage during the quarter stood % chg 69.5 38.5 25.6 33.7
at `446cr, indicating an annualised slippage ratio of 1.7% NIM (%) 3.0 3.1 3.3 3.3
slightly higher than slippage ratio of 1QFY2011 (1.6%) but
EPS (`) 50.6 62.1 77.9 104.2
lower than that of FY2010, which was at 2.2%. Gross NPAs
P/E (x) 30.9 25.2 20.1 15.0
increased by 1.6% sequentially to `1,362cr, while net NPAs
P/ABV (x) 5.6 4.0 3.4 2.9
declined marginally on a sequential basis by `4cr to `409cr.
Gross and net NPA ratios of the bank were stable at 1.1% and RoA (%) 1.4 1.5 1.5 1.6
0.3%, respectively. The bank restructured loans aggregating RoE (%) 19.1 19.2 18.3 21.1
`60cr during 2QFY2011 (`30cr in 1QFY2011). The cumulative Source: Company, Angel Research; Price as on October 14, 2010
Research Analyst - Vaibhav Agrawal/Amit Rane/Shrinivas Bhutda
For Private Circulation Only | Angel Broking Ltd: BSE Sebi Regn No : INB 010996539 / CDSL Regn No: IN - DP - CDSL - 234 - 2004 / PMS Regn Code: PM/INP00000154 6 Angel Securities Ltd:BSE: INB010994639/INF010994639 NSE: INB230994635/INF230994635 Membership numbers: BSE 028/NSE:09946 4
5. Fundamental Focus | October 16, 2010
Focus
Infotech Enterprises - Accumulate Price - `175
Target Price - `184
2QFY2011 Result Update
Performance Highlights The UTG segment is also back to strong growth after declining
for more than two quarters. Though the 15.8% volume growth
Y/E March 2QFY11 1QFY11 (qoq) 2QFY10 (yoy)
was on the back of 9.4% coming in from Wellsco's acquisition,
(` cr) % chg % chg
Net revenue 295.5 253.0 16.8 237.3 24.5 organically the company grew by 6.3% qoq. This is primarily
EBITDA margin (%) 15.5 16.0 (50)bp 21.7 (620)bp because the company's top two clients grew by over 20% qoq.
PAT 33.1 32.9 0.8 35.2 (5.9) In fact, going forward, IEL expects growth to be persistent in
Source: Company, Angel Research the UTG segment.
Strong volume-led revenue growth: For 2QFY2011, Infotech
volume-led
Outlook and valuation
Enterprises (IEL) reported 16.8% qoq revenue growth to
`295.5cr. Growth was led by qoq volume growth of 15.8% For FY2011, IEL has raised its net hiring target from 1,678
and 13.0% in the utility, telecom and government (UTG) and (end of 1QFY2011) to 2,775 on the back of higher demand
the engineering and mechanical (EMI) segments, respectively. for engineering services by hi-tech and heavy engineering
Growth in the UTG segment was impressive because of the industries. We expect IEL to record a 24.5% revenue CAGR
9.4% qoq volume growth due to Wellsco's acquisition (integrated over FY2010-12E on the back of strong inorganic growth due
since August 9, 2010) and 6.4% organic growth. to Daxon and Wellsco acquisitions aiding growth, while net
profit growth will be subdued at a 4.4% CAGR mainly on account
Disappointing operational performance: IEL's EBITDA margin
of lower orbit for operating margins. Thus, we recommend
dipped by 50bp to 15.5% due to grid-correction exercise to
Target Price
Accumulate on IEL with a Target Price of `184, valuing the
retain talent, which escalated cost, impacting margins by 166bp.
stock at 11x FY2012E EPS of `16.8 i.e., at 50% discount to
16.8
This, in addition to the integration of Wellsco (with EBITDA
Infosys' target multiple of 22x.
margin ~8% lower than IEL's average), took away gains that
came in from strong volume growth as well as cross-currency
benefit.
Key Financials (Consolidated)
Strong growth momentum in EMI continues with UTG back on
Y/E March (` cr) FY2009 FY2010 FY2011E FY2012E
the growth path: IEL is witnessing strong deal discussions in
Net sales 889.8 953.1 1,190.8 1,478.3
North America and Europe. In the EMI segment, IEL along with
% chg 32.0 7.1 24.9 24.1
aerospace (57% to revenue) verticals like heavy engineering
(10% to revenue) and hi-tech (11% to revenue) is gaining strong Net profit 92.4 170.9 151.3 186.4
momentum. Thus, the nature of spend in the EMI segment is % chg 6.5 85.0 (11.4) 23.2
becoming more broad-based, resulting in robust volume EBITDA margin (%) 20.1 21.9 16.4 17.3
growth. Some of the new long-term projects in the EMI segment, (`
FDEPS (`) 8.6 15.4 13.6 16.8
such as the Hamilton Sunstrand, Seawell (engineering support
P/E (x) 20.3 11.4 12.8 10.4
services for its drilling operations) and the recently signed US-
P/BV (x) 2.4 2.1 1.9 1.6
based Westinghouse (for providing nuclear energy-related
network) projects, are expected to witness strong ramp-ups with ROE (%) 12.8 20.4 15.5 16.4
qoq growth of over 30% in the Hamilton Sunstrand project and ROCE (%) 17.5 19.4 15.1 17.3
triple-digit growth in each of the latter two projects. Moreover, EV/Sales (x) 1.8 1.6 1.3 1.0
IEL is witnessing deal discussions, which are larger in size
EV/EBITDA (x) 8.9 7.3 7.7 5.6
typically demanding 100-200 people instead of 30-40 billable Source: Company, Angel Research; Price as on October 14, 2010; Note: *FDEPS
resources few quarters back. for FY2009 and FY2010 adjusted for 1:1 bonus effective June 12, 2010
Research Analyst - Srishti Anand
For Private Circulation Only | Angel Broking Ltd: BSE Sebi Regn No : INB 010996539 / CDSL Regn No: IN - DP - CDSL - 234 - 2004 / PMS Regn Code: PM/INP00000154 6 Angel Securities Ltd:BSE: INB010994639/INF010994639 NSE: INB230994635/INF230994635 Membership numbers: BSE 028/NSE:09946 5
6. Fundamental Focus | October 16, 2010
Focus
Infosys - Neutral Price - `3,076
Target Price - `184
2QFY2011 Result Update
Performance Highlights The company signed off TCV of US $872mn in 1HFY2011.
Also, the early indications got from clients on the budgets for
Y/E March 2QFY11 1QFY11 (qoq) 2QFY10 (yoy)
CY2011 is flat-to-positive. This has resulted in the company
(` cr) % chg % chg
Net Revenue 6,947 6,198 12.1 5,585 24.4
getting aggressive in hiring getting laterals on board for
EBITDA Margins (%) 33.3 31.7 165bp 34.5 (120)bp immediate pent up work and creating capacity by hiring freshers
PAT 1,737 1,488 16.7 1,535 13.2 to meet the increasing deal pipeline. Thus, the company
Source: Company, Angel Research; IFRS financials in rupee term increased its FY2011 hiring target yet again from 30,000 at
Double-digit growth backed by persistent volume growth &
Double- the start of the year and 36,000 at the end of 1QFY2011 to
better business mix: Infosys's reported revenues for 2QFY2011, 40,000 in 2QFY2011.
which was way ahead of street as well as our expectation. Valuation: At a macro level, the indicators point towards bleak
Revenues stood at US $1,496mn with a 10.2% qoq growth outlook, but at the client level the company is witnessing
backed by volume growth of 7.2%, cross-currency benefit of increasing propensity to spend on the change-the-business
0.7% as well as better business mix (higher component of initiatives. We expect the company to record robust 25.6% CAGR
discretionary services like consulting & package implementation, in US$ revenues over FY2010-12. However, margin headwinds
product engineering & system integration) aiding revenue are expected to persist due to necessities like competitive wage
productivity by 2.5% qoq. hikes & promotion, higher onshore component in near-term
Operating margins rebound: EBITDA margins rebounded by with flat pricing situation as well as stronger rupee against the
165bp qoq to 33.3% on strong utilisation absorbing the previous USD. EBIDTA and PAT CAGR are expected to be subdued at
quarter's wage hike effect and favourable currency negating 17.0% and 13.8% over FY2010-12, respectively. At `3,076,
the effect of higher onshore effort. the stock is trading at fair valuations of 21.7x FY2012E earnings
and at par with historical 5-year average PE of 22x. Hence, we
FY2011 guidance revised upwards: Infosys has revised its
remain Neutral on the stock.
FY2011 revenue growth guidance from the earlier growth of
19-21% to 24-25% yoy at US $5.95-6.0bn, and EPS growth
from the earlier 5.2-9.6% to 10.4-12.2% yoy in US dollar terms. Key Financials (Consolidated, IFRS)
This is the first quarter ever when the company had incremental
Y/E March (` cr) FY2009 FY2010 FY2011E FY2012E
revenues of more than US $100mn qoq, whereas in FY2010 it
Net sales 21,693 22,742 27,690 33,728
was only US $141mn, envisaging return of discretionary
spending. % chg 30.0 4.8 21.8 21.8
Return of large quality deals Net profit 5,990 6,219 6,787 8,085
% chg 28.6 3.8 9.1 19.1
The nature of spend has seen a tectonic shift in 1HFY2011
compared to FY2010. In FY2010, when the macro environment EBITDA margin (%) 33.2 34.5 32.4 32.0
was at the trough, the IT spend that was taking place was more FDEPS(`) 104.6 109.5 118.9 141.7
on run-the-business, whereas spend related to P/E(x) 29.4 28.1 25.9 21.7
change-the-business had completely dried up. In 1HFY2011, P/BV(x) 9.2 7.3 6.6 5.3
clients returned to spending on initiatives to drive efficiencies
RoE (%) 34.5 28.7 26.7 27.0
as well as invest for the future, which involves spend on
RoCE (%) 32.1 27.7 27.5 28.3
transformation engagements, client facing applications, R&D
engineering services for earliest go-to-market, and collaborate EV/Sales(x) 7.8 7.2 5.8 4.6
platforms. This has resulted in comeback of large, multi-year EV/EBITDA(x) 23.4 20.9 18.0 14.4
transformational deals with typical size of US $100-300mn. Source: Company, Angel Research; Price as on October 15, 2010;
Research Analyst - Srishti Anand
For Private Circulation Only | Angel Broking Ltd: BSE Sebi Regn No : INB 010996539 / CDSL Regn No: IN - DP - CDSL - 234 - 2004 / PMS Regn Code: PM/INP00000154 6 Angel Securities Ltd:BSE: INB010994639/INF010994639 NSE: INB230994635/INF230994635 Membership numbers: BSE 028/NSE:09946 6
7. Fundamental Focus | October 16, 2010
Focus
Sintex Industries - Accumulate Price - `424
Target Price - `458
2QFY2011 Result Update
Performance Highlights Resetting the FCCB conversion price: Sintex has reset the FCCB
conversion price to `493/share from `580/share, pursuant to
Y/E March 2QFY11 1QFY11 (qoq) 2QFY10 (yoy)
the terms and conditions of the bonds. Due to the resetting of
(` cr) % chg % chg
Net sales 923 911 1.4 715 29.0 the conversion price, on full conversion of FCCBs, the company
EBITDA 172 137 24.9 131 31.4 has to issue 1,84,97,464 equity shares of `2 each instead of
OPM (%) 18.6 15.1 350bp 18.2 34bp 1,57,22,844 equity shares of `2 each as per the original
PA
Adj. PAT 100 79 26.7 65 54.0
conversion price. Post conversion, the dilution will be 12.0%
Source: Company, Angel Research
and promoter's stake would come down to 30%.
For 2QFY2011, Sintex posted strong revenue and profit growth Outlook and valuation
of 29.0% and 54.0%, respectively, significantly above our
We have upgraded our earnings estimates for FY2011E and
estimates. Growth was mainly led by the monolithic segment
FY2012E by 3.4% and 8.0%, respectively. At `424, the stock is
and international subsidiaries. The working capital cycle
trading at 11.1x FY2012E earnings and 2.2x FY2012E BV.
remained stretched during 2QFY2011 due to higher billing
Historically, Sintex has traded at 13.0x its one-year forward
from the monolithic segment and is expected to remain higher.
average P/E, which makes current valuations attractive. Sintex's
Management reiterated its strong outlook for the domestic plastic
fundamentals have also strengthened with strong revenue
segment and has guided for potential acquisition in the
visibility and demand in the domestic plastic segment. We We
monolithic segment in 2HFY2011. Due to the recent run-up in
Target Price
maintain Accumulate on the stock, with a revised Target Price
the stock (28% over the last three months), we recommend
of `458 (12.0x FY2012E EPS).
Accumulate on the stock.
Monolithic segment and international subsidiaries drive
profitability: Sintex's consolidated net sales grew by 29.0% yoy
to `923cr. This was mainly due to strong revenue growth in the
monolithic segment (108% yoy), international subsidiaries
Key Financials (Consolidated)
(27% yoy), Bright Autoplast (50%) and textile segment (24%).
Consolidated operating profit stood at `172cr, up 31.4% yoy. Y/E March (` cr) FY2009 FY2010 FY2011E FY2012E
OPM stood at 18.6%, up 34bp yoy, due to higher contribution Net sales 3,136 3,319 4,099 5,053
from the high-margin monolithic segment. In 2QFY2011, Sintex % chg 35.5 5.9 23.5 23.3
booked one-time MTM profit (on FCCB) of `16cr under other Net profit 325 329 402 517
income and an interest expense of `4cr as one-time settlement
% chg 41.2 1.2 22.3 28.5
with ONGC. Consequently, PAT stood at `100cr.
EBITDA (%) 16.6 16.2 16.9 17.9
Working capital management will be a challenging task: The
EPS (`) 24.0 24.3 29.7 38.2
company's debtor days have gone up from 94 days in FY2009
P/E (x) 17.7 17.5 14.3 11.1
to 111 days in FY2010 in the event of increasing revenue
contribution from the monolithic segment. Further, creditor and P/BV (x) 3.9 3.4 2.8 2.2
other liabilities have gone down from 82 days in FY2009 to 67 RoE (%) 20.3 18.5 19.0 20.3
days in FY2010. This has put pressure on the working capital RoCE (%) 13.9 12.5 14.5 17.3
cycle. We expect revenue contribution from the monolithic EV/Sales (x) 2.1 2.2 1.9 1.4
segment to increase from 21% in FY2010 to 30% in FY2012,
EV/EBITDA (x) 12.8 13.4 11.0 8.1
which will keep high working capital cycles.
Source: Company, Angel Research; Price as on October 12, 2010
Research Analyst - Param Desai/Mihir Salot
For Private Circulation Only | Angel Broking Ltd: BSE Sebi Regn No : INB 010996539 / CDSL Regn No: IN - DP - CDSL - 234 - 2004 / PMS Regn Code: PM/INP00000154 6 Angel Securities Ltd:BSE: INB010994639/INF010994639 NSE: INB230994635/INF230994635 Membership numbers: BSE 028/NSE:09946 7
8. Technical Picks | October 16, 2010
Time / Price-wise correction on the cards
Sensex (20125) / Nifty (6062)
In our previous Weekly report, we had mentioned that as the Exhibit 1: Sensex Daily chart
long as indices manage to hold 19730 / 5920 levels and cross
the high of the Shooting Star - 20707 / 6222 - then there is a
strong possibility of them testing all-time highs in the coming
weeks. The week began on a positive note and momentum on
the upside led the indices to cross the high of the Shooting Star
and register a fresh 52-week high of 20854 / 6284 where
profit booking emerged. The Sensex ended with net loss of
0.6%, whereas the Nifty lost 0.7% vis-à-vis the previous week.
Pattern Formation Source: Falcon
On the Daily chart, we are observing that prices are near
chart
Exhibit 2:Sensex Weekly chart
to the 20-days EMA (20087 / 6045 level). Normally, the said Shooting Star
moving average acts as a decent support. Hence, a bounce
from current levels cannot be ruled out (Refer Exhibit No.1).
On the Weekly chart after a Spinning Top, we are now
chart,
witnessing a "Shooting Star", which is a top reversal pattern.
The high of the Shooting Star 20854 / 6284 now becomes the
initial resistance for the market (Refer Exhibit No.2).
Future Outlook
The coming week is likely to witness a Time or Price-wise Source: Falcon
correction. On the Daily chart, if the prices hold the 20-days
EMA (20087 / 6045), there is a possibility that the high of the
"Shooting Star" (20854 / 6284) could be tested. In this case,
we may witness sideways Time-wise correction/consolidation.
On the other side, if the prices breach and close below the
20-days EMA (20087 / 6045 level) we may witness a
price-wise correction. In such a scenario, the indices may test
the Fibonacci retracement levels of 19693 - 19328 / 5925 -
5814 of the entire up-move which started from 17819 to
20854 / 5348 to 6284 levels.
Traders should keep in mind that the expected
Time/Price -wise correction is a part of an uptrend and is
Time/Price
rice-wise
healthy for the market in the longer run.
For Private Circulation Only | Angel Broking Ltd: BSE Sebi Regn No : INB 010996539 / CDSL Regn No: IN - DP - CDSL - 234 - 2004 / PMS Regn Code: PM/INP00000154 6 Angel Securities Ltd:BSE: INB010994639/INF010994639 NSE: INB230994635/INF230994635 Membership numbers: BSE 028/NSE:09946 8