1. 2QFY2011 Result Update | Automobile
October 21, 2010
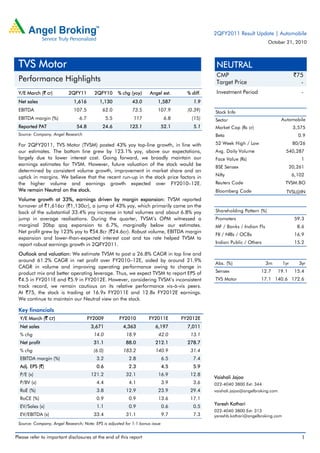
TVS Motor NEUTRAL
CMP `75
Performance Highlights Target Price -
Y/E March (` cr) 2QFY11 2QFY10 % chg (yoy) Angel est. % diff. Investment Period -
Net sales 1,616 1,130 43.0 1,587 1.9
EBITDA 107.5 62.0 73.5 107.9 (0.39) Stock Info
EBITDA margin (%) 6.7 5.5 117 6.8 (15) Sector Automobile
Reported PAT 54.8 24.6 123.1 52.1 5.1 Market Cap (Rs cr) 3,575
Source: Company, Angel Research Beta 0.9
For 2QFY2011, TVS Motor (TVSM) posted 43% yoy top-line growth, in line with 52 Week High / Low 80/26
our estimates. The bottom line grew by 123.1% yoy, above our expectations, Avg. Daily Volume 540,287
largely due to lower interest cost. Going forward, we broadly maintain our Face Value (Rs) 1
earnings estimates for TVSM. However, future valuation of the stock would be
BSE Sensex 20,261
determined by consistent volume growth, improvement in market share and an
uptick in margins. We believe that the recent run-up in the stock price factors in Nifty 6,102
the higher volume and earnings growth expected over FY2010–12E. Reuters Code TVSM.BO
We remain Neutral on the stock. Bloomberg Code TVSL@IN
Volume growth at 33%, earnings driven by margin expansion: TVSM reported
turnover of `1,616cr (`1,130cr), a jump of 43% yoy, which primarily came on the
back of the substantial 33.4% yoy increase in total volumes and about 6.8% yoy Shareholding Pattern (%)
jump in average realisations. During the quarter, TVSM’s OPM witnessed a Promoters 59.3
marginal 20bp qoq expansion to 6.7%, marginally below our estimates. MF / Banks / Indian Fls 8.6
Net profit grew by 123% yoy to `54.8cr (`24.6cr). Robust volume, EBITDA margin
FII / NRIs / OCBs 16.9
expansion and lower-than-expected interest cost and tax rate helped TVSM to
report robust earnings growth in 2QFY2011. Indian Public / Others 15.2
Outlook and valuation: We estimate TVSM to post a 26.8% CAGR in top line and
around 61.2% CAGR in net profit over FY2010–12E, aided by around 21.9%
Abs. (%) 3m 1yr 3yr
CAGR in volume and improving operating performance owing to change in
product mix and better operating leverage. Thus, we expect TVSM to report EPS of Sensex 12.7 19.1 15.4
`4.5 in FY2011E and `5.9 in FY2012E. However, considering TVSM’s inconsistent TVS Motor 17.1 140.6 172.6
track record, we remain cautious on its relative performance vis-à-vis peers.
At `75, the stock is trading at 16.9x FY2011E and 12.8x FY2012E earnings.
We continue to maintain our Neutral view on the stock.
Key financials
Y/E March (` cr) FY2009 FY2010 FY2011E FY2012E
Net sales 3,671 4,363 6,197 7,011
% chg 14.0 18.9 42.0 13.1
Net profit 31.1 88.0 212.1 278.7
% chg (6.0) 183.2 140.9 31.4
EBITDA margin (%) 3.2 2.8 6.5 7.4
Adj. EPS (`) 0.6 2.3 4.5 5.9
P/E (x) 121.2 32.1 16.9 12.8
Vaishali Jajoo
P/BV (x) 4.4 4.1 3.9 3.6 022-4040 3800 Ext: 344
RoE (%) 3.8 12.9 23.9 29.4 vaishali.jajoo@angelbroking.com
RoCE (%) 0.9 0.9 13.6 17.1
Yaresh Kothari
EV/Sales (x) 1.1 0.9 0.6 0.5
022-4040 3800 Ext: 313
EV/EBITDA (x) 33.4 31.1 9.7 7.3 yareshb.kothari@angelbroking.com
Source: Company, Angel Research; Note: EPS is adjusted for 1:1 bonus issue
Please refer to important disclosures at the end of this report 1
3. TVS Motor | 2QFY2011 Result Update
Top-line growth slightly above estimates, volume growth at 33.4%: For
2QFY2011, TVSM reported turnover of `1,616cr (`1,130cr), a jump of 43% yoy.
Growth was primarily on the back of the substantial 33.4% yoy increase in total
volumes and about 6.8% yoy jump in average realisations. During the quarter,
TVSM’s motorcycle, scooter and moped sales grew by 35%, 44.2% and 21.7% yoy,
respectively. Further, higher sales registered by the three-wheeler segment at
9,956 units (3,238 units) and the motorcycle segment at 209,006 units
(154,843 units) supported healthy revenue growth. During 2QFY2011, TVSM
exported 58,460 vehicles (35,080 vehicles), up 66.6% yoy.
Exhibit 3: Strong volume momentum across categories Exhibit 4: Realisation improves on better product mix
(units) Total volume yoy growth (RHS) (%) (` ) Net average realisation yoy growth (RHS) (%)
600,000 40 30,500 8
33.4
32.8 35 30,000 6.8 7
500,000
29.8 30 29,500 6
5.7
400,000
25 29,000 5
21.9 3.3
300,000 20 28,500 4
3.2
15 28,000 3.0 3
200,000
6.3 10 27,500 2
100,000 5.3 1.7
5 27,000 1
0 0 26,500 0
1QFY10 2QFY10 3QFY10 4QFY10 1QFY11 2QFY11 1QFY10 2QFY10 3QFY10 4QFY10 1QFY11 2QFY11
Source: Company, Angel Research Source: Company, Angel Research
In terms of volume market share, TVSM improved its position in the domestic
three-wheeler passenger carrier segment by 280bp yoy to 5.9% (3.1%) in
1HFY2011. In the two-wheeler segment, the company’s market share increased by
50bp to 15.7% (15.2%) in 1HFY2011.
Exhibit 5: Net sales growth momentum continues Exhibit 6: TVSM’s market share across categories
(` cr) (%) (%) Scooters Motor Cycles
Net sales (LHS) Net sales growth (RHS)
1,800 45 Three Wheelers Total Two Wheelers
42.5
1,600 40 25 23.5 23.6
40.4 20.5 20.8
1,400 35 19.6
33.7 17.7
20
1,200 30 15.2 15.7
14.8 14.2 14.8
1,000 25.8 25 13.8
15
800 20
600 15 10 7.3 6.8 6.6 7.3 7.1
6.2
400 9.9 10
5
200 7.1 5 5.6
2.3 2.6 4.5 4.5
0 2.5
0 0
1QFY10 2QFY10 3QFY10 4QFY10 1QFY11 2QFY11 1QFY10 2QFY10 3QFY10 4QFY10 1QFY11 2QFY11
Source: Company, Angel Research; Note: Net sales excludes other Source: Company, SIAM, Angel Research
operating income
EBITDA margin expands slightly by 20bp qoq, below estimates: For 2QFY2011,
TVSM’s EBITDA margin expanded marginally by 20bp qoq and 117bp yoy to
6.7%, which was marginally below our estimates. The increase in EBITDA margin
was on account of a 286bp decline in other expenditure, which balanced out the
~170bp increase in raw-material costs witnessed by the company. Raw-material
cost accounted for 70.7% (69%) of TVSM’s net sales during the quarter.
October 21, 2010 3
4. TVS Motor | 2QFY2011 Result Update
Exhibit 7: Improved operating leverage sustains OPM Exhibit 8: Net profit up 123.1% yoy
(%) EBITDA margin Raw material cost/sales (` cr) Net profit (LHS) Net profit margin (RHS) (%)
80 73.3 74.0 73.7 60 4
71.8 71.6 70.0 3.4
70 4
50 2.9
60 3
40 2.2 2.2
50 3
1.9
40 30 1.7 2
30 2
20
20 1
6.3 5.5 6.4 6.6 6.5 6.7 10
10 1
0 0 0
1QFY10 2QFY10 3QFY10 4QFY10 1QFY11 2QFY11 1QFY10 2QFY10 3QFY10 4QFY10 1QFY11 2QFY11
Source: Company, Angel Research Source: Company, Angel Research
Bottom line at `54.8cr, above estimates: For 2QFY2011, TVSM recorded net profit
growth of 123% yoy to `54.8cr (`24.6cr), which was better than our expectation of
about `52cr. This was primarily due to lower-than-expected interest cost and tax.
Net profit margin for the quarter improved primarily due to higher improved
operating leverage and richer product mix, which helped the company to post
robust earnings growth in 2QFY2011.
Key highlights
Management maintains its volume guidance at 2mn units for FY2011.
The company’s growth will be secular across segments. Management has
indicated average growth of 20% for the industry. Going forward, the
company’s flagship brands such as Wego and Jive will constitute over 15% of
its total volumes, with Apache and Star City constituting the balance. TVSM is
targeting FY2011 sales of 1.4 lakh units of Jive alone (double from current
levels of about 7,000 units per month).
TVSM is targeting exports of over `800cr or 2.5lakh two-wheelers in FY2011.
Management has stated that it plans to increase capacity from 2.4mn to
2.8mn by March 2011 at a cost of `150cr.
TVSM’s three-wheeler sales continue to remain strong. The company has
entered the three-wheeler market in Nigeria and Peru. In July 2010, the
company launched MAX 4R, which will be catering to rural masses.
The company’s current market share in the two-wheeler segment stands at
15.7%. TVSM is set to gain 1–2% share, despite aggressive competition, if the
industry’s growth is robust at around 20%.
In September 2010, TVSM took a price hike of up to 1.5% on various models
and plans to take another price hike during 3QFY2011.
TVS Motor Company Indonesia registered total two-wheeler sales of about
11,000 units during 1HFY2011 as compared to 7,300 units recorded in
1HFY2010. Exports accounted for 2,300 units. During the quarter, the
company’s product portfolio continued to receive good response from
consumers in the region. Presently, TVSM has around 130 dealerships across
Indonesia and plans to expand its network to around 220 by March 2011.
October 21, 2010 4
6. TVS Motor | 2QFY2011 Result Update
Investment arguments
Higher earnings growth on success of new launches: TVSM displayed healthy
performance in FY2010, aided by overall volume recovery, improved product
mix and the benefits of operating leverage. In FY2011, new launches of Jive,
Wego and Max4R would help the company to register higher earnings growth.
We expect the new launches to enable TVSM to ramp up its monthly run rate
of two-wheelers and post annual volumes of 2mn and 2.2mn units in
FY2011E and FY2012E, respectively, from 1.3mn units in FY2010.
Overall, we expect domestic two-wheeler volumes to register a 21.6% CAGR
over FY2010–12E.
Improved product mix and three-wheeler support to increase margins: Higher
contribution from three-wheeler volumes to total volumes would help the
company expand its margins during FY2010–12E, implying a higher earnings
CAGR over the period. However, we believe the overall scenario will remain
challenging for the company in terms of intensifying competition.
Consolidated earnings back in black: TVSM’s consolidated performance was
impacted by poor performance of its Indonesian subsidiary. The facility in
Indonesia started in FY2007 with an initial investment of around `200cr. On a
cumulative basis, TVSM invested around `270cr until FY2010. After the facility
started, the economic meltdown extended the gestation period for TVSM in the
Indonesian market. However, the recent recovery in the overseas market
helped the company to improve its consolidated performance. TVSM recorded
a 21.3% yoy jump in consolidated net sales to `4,544cr (`3,747cr) for
FY2010 and net profit of `33.5cr as against a loss of `63.2cr for FY2009.
Outlook and valuation
Going ahead, TVSM will have to counter intensive competitive pressures,
particularly from Bajaj Auto, Hero Honda and HMSI, which are launching new
bikes and reducing prices in their bid to boost volumes. However, launch of the
125cc Flame, Jive, Wego, Max4R and three-wheelers would provide some respite
to TVSM on the margin front going ahead, which is also reflected in the company’s
FY2010 performance. Hence, we broadly maintain our estimates for the company.
We estimate TVSM to post a 26.8% CAGR in its top line and around 61.2% CAGR
in net profit over FY2010–12E, aided by around 21.9% CAGR in volume and
improving operating performance owing to the change in product mix and better
operating leverage. Thus, we expect TVSM to register EPS of `4.5 in FY2011E and
`5.9 in FY2012E. Nonetheless, considering the company’s inconsistent track
record, we remain cautious on its relative performance vis-à-vis peers. At `75, the
stock is trading at 16.9x FY2011E and 12.8x FY2012E earnings. We believe that
the recent run-up in the stock price factors in the higher volume and earnings
growth expected over FY2010–12E. Thus, future valuation of the stock would be
determined by consistent growth in volumes, improvement in market share and
uptick in margins. We continue to maintain our Neutral view on the stock.
October 21, 2010 6
12. TVS Motor | 2QFY2011 Result Update
Research Team Tel: 022 - 4040 3800 E-mail: research@angeltrade.com Website: www.angeltrade.com
DISCLAIMER
This document is solely for the personal information of the recipient, and must not be singularly used as the basis of any investment
decision. Nothing in this document should be construed as investment or financial advice. Each recipient of this document should make
such investigations as they deem necessary to arrive at an independent evaluation of an investment in the securities of the companies
referred to in this document (including the merits and risks involved), and should consult their own advisors to determine the merits and
risks of such an investment.
Angel Broking Limited, its affiliates, directors, its proprietary trading and investment businesses may, from time to time, make
investment decisions that are inconsistent with or contradictory to the recommendations expressed herein. The views contained in this
document are those of the analyst, and the company may or may not subscribe to all the views expressed within.
Reports based on technical and derivative analysis center on studying charts of a stock's price movement, outstanding positions and
trading volume, as opposed to focusing on a company's fundamentals and, as such, may not match with a report on a company's
fundamentals.
The information in this document has been printed on the basis of publicly available information, internal data and other reliable
sources believed to be true, but we do not represent that it is accurate or complete and it should not be relied on as such, as this
document is for general guidance only. Angel Broking Limited or any of its affiliates/ group companies shall not be in any way
responsible for any loss or damage that may arise to any person from any inadvertent error in the information contained in this report.
Angel Broking Limited has not independently verified all the information contained within this document. Accordingly, we cannot testify,
nor make any representation or warranty, express or implied, to the accuracy, contents or data contained within this document. While
Angel Broking Limited endeavours to update on a reasonable basis the information discussed in this material, there may be regulatory,
compliance, or other reasons that prevent us from doing so.
This document is being supplied to you solely for your information, and its contents, information or data may not be reproduced,
redistributed or passed on, directly or indirectly.
Angel Broking Limited and its affiliates may seek to provide or have engaged in providing corporate finance, investment banking or
other advisory services in a merger or specific transaction to the companies referred to in this report, as on the date of this report or in
the past.
Neither Angel Broking Limited, nor its directors, employees or affiliates shall be liable for any loss or damage that may arise from or in
connection with the use of this information.
Note: Please refer to the important `Stock Holding Disclosure' report on the Angel website (Research Section). Also, please
refer to the latest update on respective stocks for the disclosure status in respect of those stocks. Angel Broking Limited and
its affiliates may have investment positions in the stocks recommended in this report.
Disclosure of Interest Statement TVS Motor
1. Analyst ownership of the stock No
2. Angel and its Group companies ownership of the stock No
3. Angel and its Group companies' Directors ownership of the stock No
4. Broking relationship with company covered No
Note: We have not considered any Exposure below ` 1 lakh for Angel, its Group companies and Directors.
Ratings (Returns) : Buy (> 15%) Accumulate (5% to 15%) Neutral (-5 to 5%)
Reduce (-5% to 15%) Sell (< -15%)
October 21, 2010 12