(8264348440) 🔝 Call Girls In Hauz Khas 🔝 Delhi NCR
Derivatives Report 21 May 2010
1. Derivative Report
India Research
May 21, 2010
Comments
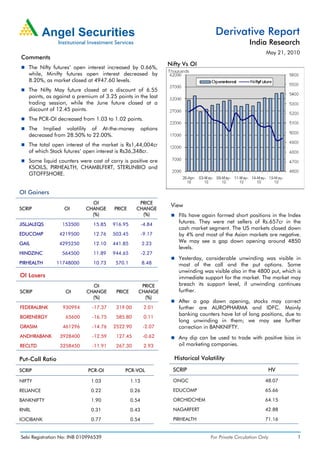
Nifty Vs OI
The Nifty futures’ open interest increased by 0.66%,
while, Minifty futures open interest decreased by
8.20%, as market closed at 4947.60 levels.
The Nifty May future closed at a discount of 6.55
points, as against a premium of 3.25 points in the last
trading session, while the June future closed at a
discount of 12.45 points.
The PCR-OI decreased from 1.03 to 1.02 points.
The Implied volatility of At-the-money options
decreased from 28.50% to 22.00%.
The total open interest of the market is Rs1,44,004cr
of which Stock futures’ open interest is Rs36,348cr.
Some liquid counters were cost of carry is positive are
KSOILS, PIRHEALTH, CHAMBLFERT, STERLINBIO and
GTOFFSHORE.
OI Gainers
OI PRICE
View
SCRIP OI CHANGE PRICE CHANGE
(%) (%) FIIs have again formed short positions in the Index
JISLJALEQS 153500 15.85 916.95 -4.84
futures. They were net sellers of Rs.657cr in the
cash market segment. The US markets closed down
EDUCOMP 4219500 12.76 503.45 -9.17 by 4% and most of the Asian markets are negative.
GAIL 4295250 12.10 441.85 2.23
We may see a gap down opening around 4850
levels.
HINDZINC 564500 11.89 944.65 -2.27
Yesterday, considerable unwinding was visible in
PIRHEALTH 11748000 10.73 570.1 8.48 most of the call and the put options. Some
unwinding was visible also in the 4800 put, which is
OI Losers immediate support for the market. The market may
OI PRICE breach its support level, if unwinding continues
SCRIP OI CHANGE PRICE CHANGE further.
(%) (%)
After a gap down opening, stocks may correct
FEDERALBNK 930994 -17.37 319.00 2.01 further are AUROPHARMA and IDFC. Mainly
banking counters have lot of long positions, due to
BGRENERGY 65600 -16.75 585.80 0.11
long unwinding in them; we may see further
GRASIM 461296 -14.76 2522.90 -2.07 correction in BANKNIFTY.
ANDHRABANK 3928400 -12.59 127.45 -0.62 Any dip can be used to trade with positive bias in
RECLTD 3258450 -11.91 267.30 2.93 oil marketing companies.
Put-Call Ratio Historical Volatility
SCRIP PCR-OI PCR-VOL SCRIP HV
NIFTY 1.03 1.13 ONGC 48.07
RELIANCE 0.22 0.26 EDUCOMP 65.66
BANKNIFTY 1.90 0.54 ORCHIDCHEM 64.15
RNRL 0.31 0.43 NAGARFERT 42.88
ICICIBANK 0.77 0.54 PIRHEALTH 71.16
Sebi Registration No: INB 010996539 For Private Circulation Only 1
2. Derivative Report | India Research
FII Statistics for 20-May-2010 Turnover on 20-May-2010
Open Interest
No. of Turnover Change
Detail Buy Sell Net Instrument
Contracts (Rs. in cr.) (%)
Contracts Value Change
(Rs. in cr.) (%)
INDEX Index Futures 831432 19366.93 -24.71
3514.41 4295.47 (781.06) 587029 14464.33 2.55
FUTURES
INDEX Stock Futures 635452 19823.99 -9.38
5448.42 5798.38 (349.96) 1937832 47908.62 -0.34
OPTIONS
STOCK Index Options 2378247 59867.88 -29.16
3552.03 2664.26 887.77 1045752 29196.29 -0.59
FUTURES
STOCK Stock Options 107924 3675.28 -17.61
283.58 261.94 21.64 49974 1495.38 6.80
OPTIONS
TOTAL 12798.44 13020.05 (221.61) 3620587 93064.61 0.14 Total 3953055 102734.08 -24.78
Nifty Spot = 4947.60 Lot Size = 50
Bull-Call Spreads Bear-Put Spreads
Action Strike Price Risk Reward BEP Action Strike Price Risk Reward BEP
Buy 5000 43.20 Buy 4900 55.30
28.85 71.15 5028.85 28.55 71.45 4871.45
Sell 5100 14.35 Sell 4800 26.75
Buy 5000 43.20 Buy 4900 55.30
39.90 160.10 5039.90 43.55 156.45 4856.45
Sell 5200 3.30 Sell 4700 11.75
Buy 5100 14.35 Buy 4800 26.75
11.05 88.95 5111.05 15.00 85.00 4785.00
Sell 5200 3.30 Sell 4700 11.75
Note: Above mentioned Bullish or Bearish Spreads in Nifty (May Series) are given as an information and not as a recommendation
Nifty Put-Call Analysis
For Private Circulation Only Sebi Registration No: INB 010996539 2
3. Derivative Report | India Research
Strategy Date Scrip Strategy Status
30-04-2010 RELCAPITAL Long Call Ladder Continue
30-04-2010 NAGARFERT Long Call Continue
08-05-2010 HINDUNILVR Short Strangle Continue
17-05-2010 CAIRN Long Put Profit booked on 20-05-2010
DISCLAIMER:
This document is not for public distribution and has been furnished to you solely for your information and must not be reproduced or redistributed to any other person.
Persons into whose possession this document may come are required to observe these restrictions.
Opinion expressed is our current opinion as of the date appearing on this material only. While we endeavor to update on a reasonable basis the information discussed in
this material, there may be regulatory, compliance, or other reasons that prevent us from doing so. Prospective investors and others are cautioned that any forward-
looking statements are not predictions and may be subject to change without notice. Our proprietary trading and investment businesses may make investment decisions
that are inconsistent with the recommendations expressed herein.
The information in this document has been printed on the basis of publicly available information, internal data and other reliable sources believed to be true and are for
general guidance only. While every effort is made to ensure the accuracy and completeness of information contained, the company takes no guarantee and assumes no
liability for any errors or omissions of the information. No one can use the information as the basis for any claim, demand or cause of action.
Recipients of this material should rely on their own investigations and take their own professional advice. Each recipient of this document should make such investigations
as it deems necessary to arrive at an independent evaluation of an investment in the securities of companies referred to in this document (including the merits and risks
involved), and should consult their own advisors to determine the merits and risks of such an investment. Price and value of the investments referred to in this material may
go up or down. Past performance is not a guide for future performance.
Certain transactions - futures, options and other derivatives as well as non-investment grade securities - involve substantial risks and are not suitable for all investors.
Reports based on technical analysis centers on studying charts of a stock's price movement and trading volume, as opposed to focusing on a company's fundamentals and
as such, may not match with a report on a company's fundamentals.
We do not undertake to advise you as to any change of our views expressed in this document. While we would endeavor to update the information herein on a reasonable
basis, Angel Broking, its subsidiaries and associated companies, their directors and employees are under no obligation to update or keep the information current. Also
there may be regulatory, compliance, or other reasons that may prevent Angel Broking and affiliates from doing so. Prospective investors and others are cautioned that
any forward-looking statements are not predictions and may be subject to change without notice.
Angel Broking Limited and affiliates, including the analyst who has issued this report, may, on the date of this report, and from time to time, have long or short positions
in, and buy or sell the securities of the companies mentioned herein or engage in any other transaction involving such securities and earn brokerage or compensation or
act as advisor or have other potential conflict of interest with respect to company/ies mentioned herein or inconsistent with any recommendation and related information
and opinions.
Angel Broking Limited and affiliates may seek to provide or have engaged in providing corporate finance, investment banking or other advisory services in a merger or
specific transaction to the companies referred to in this report, as on the date of this report or in the past.
Sebi Registration No.: INB 010996539
Derivative Research Team derivatives.desk@angeltrade.com
For Private Circulation Only Sebi Registration No: INB 010996539 3