(8264348440) 🔝 Call Girls In Keshav Puram 🔝 Delhi NCR
Derivatives report 15 june-2010
1. Derivative Report
India Research
June 15, 2010
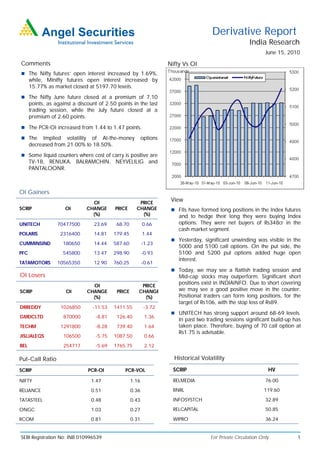
Comments Nifty Vs OI
The Nifty futures’ open interest increased by 1.69%,
while, Minifty futures open interest increased by
15.77% as market closed at 5197.70 levels.
The Nifty June future closed at a premium of 7.10
points, as against a discount of 2.50 points in the last
trading session, while the July future closed at a
premium of 2.60 points.
The PCR-OI increased from 1.44 to 1.47 points.
The Implied volatility of At-the-money options
decreased from 21.00% to 18.50%.
Some liquid counters where cost of carry is positive are
TV-18, RENUKA, BALRAMCHIN, NEYVELILIG and
PANTALOONR.
OI Gainers
OI PRICE
View
SCRIP OI CHANGE PRICE CHANGE FIIs have formed long positions in the Index futures
(%) (%) and to hedge their long they were buying Index
UNITECH 70477500 23.69 68.70 0.66 options. They were net buyers of Rs348cr in the
cash market segment.
POLARIS 2316400 14.81 179.45 1.44
Yesterday, significant unwinding was visible in the
CUMMINSIND 180650 14.44 587.60 -1.23
5000 and 5100 call options. On the put side, the
PFC 545800 13.47 298.90 -0.93 5100 and 5200 put options added huge open
interest.
TATAMOTORS 10565350 12.90 760.25 -0.61
Today, we may see a flattish trading session and
OI Losers Mid-cap stocks may outperform. Significant short
positions exist in INDIAINFO. Due to short covering
OI PRICE
SCRIP OI CHANGE PRICE CHANGE we may see a good positive move in the counter.
(%) (%) Positional traders can form long positions, for the
target of Rs106, with the stop loss of Rs89.
DRREDDY 1026850 -11.53 1411.55 -3.72
UNITECH has strong support around 68-69 levels.
GMDCLTD 870000 -8.81 126.40 1.36
In past two trading sessions significant build-up has
TECHM 1291800 -8.28 739.40 1.64 taken place. Therefore, buying of 70 call option at
Rs1.75 is advisable.
JISLJALEQS 106500 -5.75 1087.50 0.66
BEL 254717 -5.69 1765.75 2.12
Put-Call Ratio Historical Volatility
SCRIP PCR-OI PCR-VOL SCRIP HV
NIFTY 1.47 1.16 RELMEDIA 76.00
RELIANCE 0.51 0.36 RNRL 119.60
TATASTEEL 0.48 0.43 INFOSYSTCH 32.89
ONGC 1.03 0.27 RELCAPITAL 50.85
RCOM 0.81 0.31 WIPRO 36.24
SEBI Registration No: INB 010996539 For Private Circulation Only 1
2. Derivative Report | India Research
FII Statistics for 14-June-2010 Turnover on 14-June-2010
Open Interest
No. of Turnover Change
Detail Buy Sell Net Instrument
Contracts (Rs. in cr.) (%)
Contracts Value Change
(Rs. in cr.) (%)
INDEX Index Futures 638430 15282.70 8.54
2810.68 1494.61 1,316.07 543220 14062.80 1.54
FUTURES
INDEX Stock Futures 516464 15486.25 3.14
6109.95 5609.19 500.76 1960767 50924.69 0.92
OPTIONS
STOCK Index Options 2588941 66102.68 18.48
1905.15 1924.33 (19.19) 984280 28486.95 2.26
FUTURES
STOCK Stock Options 103617 3268.75 -1.84
292.89 276.54 16.36 43189 1366.12 0.40
OPTIONS
TOTAL 11118.67 9304.67 1,814.00 3531456 94840.55 1.38 Total 3847452 100140.39 13.52
Nifty Spot = 5197.70 Lot Size = 50
Bull-Call Spreads Bear-Put Spreads
Action Strike Price Risk Reward BEP Action Strike Price Risk Reward BEP
Buy 5200 64.60 Buy 5100 33.50
41.95 58.05 5241.95 14.75 85.25 5085.25
Sell 5300 22.65 Sell 5000 18.75
Buy 5200 64.60 Buy 5100 33.50
58.50 141.50 5258.50 22.30 177.70 5077.70
Sell 5400 6.10 Sell 4900 11.20
Buy 5300 22.65 Buy 5000 18.75
16.55 83.45 5316.55 7.55 92.45 4992.45
Sell 5400 6.10 Sell 4900 11.20
Note: Above mentioned Bullish or Bearish Spreads in Nifty (June Series) are given as an information and not as a recommendation
Nifty Put-Call Analysis
For Private Circulation Only SEBI Registration No: INB 010996539 2
3. Derivative Report | India Research
Strategy Date Scrip Strategy Status
31-May-2010 Nifty Long Put Ladder Continue
07-Jun-2010 HINDUNILVR Ratio Put Spread Continue
07-Jun-2010 RCOM Ratio Put Spread Continue
14-Jun-2010 HINDALCO Ratio Call Spread Continue
14-Jun-2010 LT Short Straddle Continue
DISCLAIMER:
This document is not for public distribution and has been furnished to you solely for your information and must not be reproduced or redistributed to any other person.
Persons into whose possession this document may come are required to observe these restrictions.
Opinion expressed is our current opinion as of the date appearing on this material only. While we endeavor to update on a reasonable basis the information discussed in
this material, there may be regulatory, compliance, or other reasons that prevent us from doing so. Prospective investors and others are cautioned that any forward-
looking statements are not predictions and may be subject to change without notice. Our proprietary trading and investment businesses may make investment decisions
that are inconsistent with the recommendations expressed herein.
The information in this document has been printed on the basis of publicly available information, internal data and other reliable sources believed to be true and are for
general guidance only. While every effort is made to ensure the accuracy and completeness of information contained, the company takes no guarantee and assumes no
liability for any errors or omissions of the information. No one can use the information as the basis for any claim, demand or cause of action.
Recipients of this material should rely on their own investigations and take their own professional advice. Each recipient of this document should make such investigations
as it deems necessary to arrive at an independent evaluation of an investment in the securities of companies referred to in this document (including the merits and risks
involved), and should consult their own advisors to determine the merits and risks of such an investment. Price and value of the investments referred to in this material may
go up or down. Past performance is not a guide for future performance.
Certain transactions - futures, options and other derivatives as well as non-investment grade securities - involve substantial risks and are not suitable for all investors.
Reports based on technical analysis centers on studying charts of a stock's price movement and trading volume, as opposed to focusing on a company's fundamentals and
as such, may not match with a report on a company's fundamentals.
We do not undertake to advise you as to any change of our views expressed in this document. While we would endeavor to update the information herein on a reasonable
basis, Angel Broking, its subsidiaries and associated companies, their directors and employees are under no obligation to update or keep the information current. Also
there may be regulatory, compliance, or other reasons that may prevent Angel Broking and affiliates from doing so. Prospective investors and others are cautioned that
any forward-looking statements are not predictions and may be subject to change without notice.
Angel Broking Limited and affiliates, including the analyst who has issued this report, may, on the date of this report, and from time to time, have long or short positions
in, and buy or sell the securities of the companies mentioned herein or engage in any other transaction involving such securities and earn brokerage or compensation or
act as advisor or have other potential conflict of interest with respect to company/ies mentioned herein or inconsistent with any recommendation and related information
and opinions.
Angel Broking Limited and affiliates may seek to provide or have engaged in providing corporate finance, investment banking or other advisory services in a merger or
specific transaction to the companies referred to in this report, as on the date of this report or in the past.
Sebi Registration No.: INB 010996539
Derivative Research Team derivatives.desk@angeltrade.com
For Private Circulation Only SEBI Registration No: INB 010996539 3