VIP Kolkata Call Girl Serampore 👉 8250192130 Available With Room
Battery Industry
1. Auto Ancillary
September 2010
Volume ‘Lead’ growth Battery
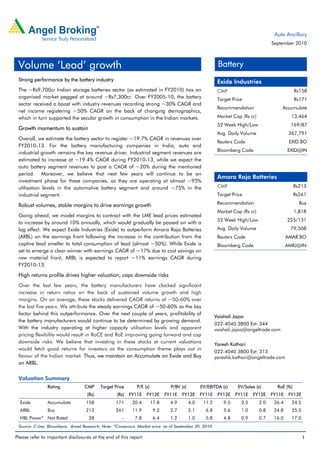
Strong performance by the battery industry Exide Industries
The ~Rs9,700cr Indian storage batteries sector (as estimated in FY2010) has an CMP Rs158
organised market pegged at around ~Rs7,300cr. Over FY2005-10, the battery Target Price Rs171
sector received a boost with industry revenues recording strong ~30% CAGR and
Recommendation Accumulate
net income registering ~50% CAGR on the back of changing demographics,
which in turn supported the secular growth in consumption in the Indian markets. Market Cap (Rs cr) 13,464
52 Week High/Low 169/87
Growth momentum to sustain
Avg. Daily Volume 367,791
Overall, we estimate the battery sector to register ~19.7% CAGR in revenues over
Reuters Code EXID.BO
FY2010-13. For the battery manufacturing companies in India, auto and
Bloomberg Code EXID@IN
industrial growth remains the key revenue driver. Industrial segment revenues are
estimated to increase at ~19.4% CAGR during FY2010-13, while we expect the
auto battery segment revenues to post a CAGR of ~20% during the mentioned
period. Moreover, we believe that next few years will continue to be an
Amara Raja Batteries
investment phase for these companies, as they are operating at almost ~95%
utilisation levels in the automotive battery segment and around ~75% in the CMP Rs213
industrial segment. Target Price Rs261
Robust volumes, stable margins to drive earnings growth Recommendation Buy
Market Cap (Rs cr) 1,818
Going ahead, we model margins to contract with the LME lead prices estimated
52 Week High/Low 225/131
to increase by around 10% annually, which would gradually be passed on with a
lag effect. We expect Exide Industries (Exide) to outperform Amara Raja Batteries Avg. Daily Volume 79,508
(ARBL) on the earnings front following the increase in the contribution from the Reuters Code AMAR.BO
captive lead smelter to total consumption of lead (almost ~50%). While Exide is Bloomberg Code AMRJ@IN
set to emerge a clear winner with earnings CAGR of ~17% due to cost savings on
raw material front, ARBL is expected to report ~11% earnings CAGR during
FY2010-13.
High returns profile drives higher valuation, caps downside risks
Over the last few years, the battery manufacturers have clocked significant
increase in return ratios on the back of sustained volume growth and high
margins. On an average, these stocks delivered CAGR returns of ~50-60% over
the last five years. We attribute the steady earnings CAGR of ~50-60% as the key
factor behind this outperformance. Over the next couple of years, profitability of
Vaishali Jajoo
the battery manufacturers would continue to be determined by growing demand.
022-4040 3800 Ext: 344
With the industry operating at higher capacity utilisation levels and apparent vaishali.jajoo@angeltrade.com
pricing flexibility would result in RoCE and RoE improving going forward and cap
downside risks. We believe that investing in these stocks at current valuations Yaresh Kothari
would fetch good returns for investors as the consumption theme plays out in
022-4040 3800 Ext: 313
favour of the Indian market. Thus, we maintain an Accumulate on Exide and Buy yareshb.kothari@angeltrade.com
on ARBL.
Valuation Summary
Rating CMP Target Price P/E (x) P/BV (x) EV/EBITDA (x) EV/Sales (x) RoE (%)
(Rs) (Rs) FY11E FY12E FY11E FY12E FY11E FY12E FY11E FY12E FY11E FY12E
Exide Accumulate 158 171 20.4 17.8 4.9 4.0 11.2 9.5 2.5 2.0 26.4 24.5
ARBL Buy 213 261 11.9 9.2 2.7 2.1 6.8 5.6 1.0 0.8 24.8 25.5
HBL Power* Not Rated 28 - 7.8 6.4 1.2 1.0 5.8 4.8 0.9 0.7 16.0 17.0
Source: C-line, Bloomberg, Angel Research; Note: *Consensus, Market price as of September 20, 2010
Please refer to important disclosures at the end of this report 1
2. Auto Ancillary
Table of Contents
Industry 3
Strong performance by battery industry 4
Growth momentum to sustain 4
Stable lead price, backward integration helped margin expansion 6
Robust volumes to drive earnings growth 7
Expansion to capture volume growth 7
High returns profile drives higher valuation, caps downside risks 8
Stocks outperform on fundamental grounds – Exide excels 9
Exide re-rates on superior performance 10
Exide - ARBL valuation gap contracts 11
Companies 13
Exide Industries - Defensive appeal 14
Amara Raja Batteries - Catching up 30
Annexure 47
Battery Industry - Overview 48
Automotive batteries – Riding secular growth in auto sector 48
Industrial batteries – Growing with economy 53
Key risks 55
September 2010 2
4. Auto Ancillary
Strong performance by the battery industry
The ~Rs9,700cr Indian storage batteries sector (as estimated in FY2010) has an
organised market pegged at around ~Rs7,300cr. Over FY2005-10, the battery
sector received a boost with industry revenues recording strong ~30% CAGR and
net income registering ~50% CAGR on the back of changing demographics,
which in turn supported the secular growth in consumption in the Indian markets.
Exhibit 1: Indian battery market – Growth trend Exhibit 2: Battery industry’s revenue break-up
(%) Revenue growth (%) Net income growth (%) Automobile Industrial
Operating margin (RHS) 100%
80 76 25
70 65
57 20 80% 41 40
60 50
50 15
40 29 30 60%
29
30 21 24 22 10
18 16 18 19 20
14 16
20 40%
7 5
10 60
59
0 0
20%
FY08
FY09
FY10
FY11E
FY12E
FY13E
FY01-10*
FY05-10*
FY10-13E*
0%
FY09 FY10
Source: Industry, Company, Angel Research; Note : * CAGR Source: Industry, Company, Angel Research
Growth momentum to sustain
The organised battery sector recorded a CAGR of ~14.1% during FY2008-10
aided by the ~10.2% and ~18.8% CAGR registered by the automotive and
industrial batteries segments respectively, during the mentioned period. For the
battery manufacturing companies in India, auto and industrial growth remains the
key revenue driver. Going ahead, the industrial segment revenues are estimated to
increase at ~19.4% CAGR over FY2010-13, while the auto battery segment
revenue is estimated to post a CAGR of ~20% during the period. Overall, we
estimate the battery sector to register ~19.7% CAGR in revenues over the
mentioned period.
Exhibit 3: New vehicle sales, increasing vehicle population and healthy industrial growth drives battery demand
CAGR CAGR
Particular FY08 FY09 FY10P FY11E FY12E FY13E
FY2008-10 FY2010-13E
New OEM vehicle volume ('000 units) 10,370 10,732 13,155 15,008 16,603 18,258 12.6 11.5
yoy growth (%) 3.5 22.6 14.1 10.6 10.0
Vehicle population* ('000 units) 99,626 106,888 115,759 125,704 136,860 149,549 7.8 8.9
yoy growth (%) 7.3 8.3 8.6 8.9 9.3
Batteries Volume
Automotive volume (mn units) 30.7 35.0 40.6 47.9 54.7 60.4 15.0 14.1
yoy growth (%) 14.0 16.1 18.0 14.0 10.5
OEM volume (mn units) 10.1 11.1 13.4 15.8 17.5 19.0 15.1 12.5
yoy growth (%) 9.9 20.4 18.4 10.5 8.8
Replacement volume (mn units) 20.6 23.9 27.3 32.1 37.2 41.4 15.0 14.9
yoy growth (%) 16.0 14.1 17.8 15.7 11.3
Industrial volume (mnAH) 2,220 3,071 3,625 4,119 4,782 5,517 27.8 15.0
yoy growth (%) 38.3 18.0 13.6 16.1 15.4
Source: Industry, SIAM, Company, Angel Research; Note: *Projected
September 2010 4
5. Auto Ancillary
We expect the auto original equipment (OE) battery volume to register 13-14%
CAGR over FY2010-13 aided by healthy ~12% CAGR in automobile volumes.
Auto replacement demand is expected to post 14-15% CAGR in volumes during
FY2010-13. We believe that sustained auto volume growth has resulted in a large
base for the replacement market. Thus, with a sharp increase in vehicle
population, we see a corresponding pick up in replacement demand. Further,
positive industry (IIP) cycle, increasing demand from railways and UPS segment
would support healthy growth of industrial battery segment.
Exhibit 4: Strong auto, industrial growth to boost battery industry’s revenue
(%) yoy growth ind. battery revenue yoy growth auto battery revenue
45
40
40
35
30
25
25 22
18 18 19 19 20
20 18 17
14
15
10
10 6
5 1
0
FY2009 FY2010 FY2011E FY2012E FY2013E FY08-10* FY10-13E*
Source: Industry, Company, Angel Research; Note : * CAGR
We believe that the Indian battery sector offers an excellent opportunity for
investors to cash in on the strong economic growth and emerging consumerism
theme in India. We expect Exide and ARBL to register robust ~21% and ~23%
CAGR in net sales and ~17% and ~11% CAGR in net profit respectively, during
FY2010-13.
Exhibit 5: Angel’s Battery Universe – Financial Projections
Exide ARBL CAGR FY2010-13E (%)
(Rs cr)
FY2010 FY2011E FY2012E FY2013E FY2010 FY2011E FY2012E FY2013E Exide Amara Raja
Revenue 3,794 4,788 5,682 6,691 1,465 1,871 2,267 2,727 20.8 23.0
EBITDA 892 1,065 1,218 1,388 281 273 327 385 15.9 11.0
PAT 537 659 757 859 167 152 197 227 16.9 10.7
Source: Company, Angel Research
Exhibit 6: Revenue growth trend
(%) Exide ARBL
100
82
80
64
60 54 52
44
34 36
40
26 28 26
22 19 21 19 21 18 20 21 23
17 16
20 12 12 9
0
FY10-13E*
FY11E
FY12E
FY13E
FY00-05*
FY05-10*
FY05
FY06
FY07
FY08
FY09
FY10
Source: Company, Angel Research; Note * CAGR
September 2010 5
6. Auto Ancillary
Stable lead price, backward integration helped margin
expansion
Stable lead prices and smelter acquisition by industry leader, Exide, helped the
industry clock higher margins in the last couple of years. As a result, the impact of
the fluctuations in the lead prices on margins has reduced in recent quarters
particularly for majors like Exide. The lead smelter acquisition has reduced Exide’s
dependence on imports and purchase of pure lead from the market owing to
which we model it EBITDA margins in the range of 20-22% going ahead. ARBL is
expected to operate at margins of around 14-15% going forward.
Exhibit 7: Sensitivity to Exide’s FY12E EBITDA margin Exhibit 8: Sensitivity to ARBL’s FY12E EBITDA margin
LME Lead prices ($/kg) LME Lead prices ($/kg)
1.9 2.2 2.4 2.6 2.9 1.9 2.2 2.4 2.6 2.9
41.5 34.7 31.6 28.7 26.6 24.7 41.5 23.3 19.9 16.8 14.6 12.9
Rupee-Dollar rate
Rupee-Dollar rate
43.7 32.3 29.3 26.6 25.0 23.0 43.7 21.6 18.3 15.5 13.6 12.4
46.0 26.7 23.9 21.4 20.0 18.8 46.0 20.0 16.9 14.4 12.9 12.1
48.3 28.4 25.7 23.4 22.2 21.6 48.3 18.5 15.7 13.5 12.3 12.0
50.7 24.2 21.7 19.7 18.9 18.6 50.7 17.1 14.6 12.8 12.1 12.2
Source: Bloomberg, Company, Angel Research Source: Bloomberg, Company, Angel Research
Exide procures ~50% of its lead requirement from captive smelters and produces
recycled lead, which gives it 10-15% of cost advantage. Imports constitute ~30%
of its lead consumption. In comparison, ARBL imports around ~60% of its lead
requirements on account of which it operates at lower margins to Exide and is
more sensitive to the changes in the LME lead prices.
Exhibit 9: High inventory levels to stabilise lead prices Exhibit 10: EBITDA margin trend
(USD/tonne) Lead inventory (RHS) Lead prices (LHS) (tonne) (%) Exide ARBL
25 24
5,000 250,000 22 21 21
19
4,000 200,000 20
16 16 17 16
15 15 15 14
3,000 150,000 14 14
15 13
11
2,000 100,000
9
10
1,000 50,000
5
0 0
Aug-01
Aug-02
Aug-03
Aug-04
Aug-05
Aug-06
Aug-07
Aug-08
Aug-09
Aug-10
0
FY05 FY06 FY07 FY08 FY09 FY10 FY11E FY12E FY13E
Source: Bloomberg, Company, Angel Research Source: Company, Angel Research
Going ahead, we model margins to contract with the LME lead prices estimated to
increase by around 10% annually, which would gradually be passed on with lag
effect.
September 2010 6
7. Auto Ancillary
Robust volumes to drive earnings growth
We expect Exide to outperform ARBL on the earnings front following the increase in
the contribution from the in-house lead smelter to total consumption of lead
(almost ~50%). While Exide emerges a clear winner in terms of earnings CAGR of
~17% due to cost savings at raw material front, ARBL is expected to report ~11%
earnings CAGR during FY2010-13.
Exhibit 11: Earnings growth trend
(%) Exide ARBL
600 535
500
400
300
174
200
97 101 89 108 81
100 54 61 47
28 14 (15) 23 (9) 15 29 14 15 9 17 11
(15)
0
(0)
(100)
FY10-13E*
FY11E
FY12E
FY13E
FY00-05*
FY05-10*
FY05
FY06
FY07
FY08
FY09
Source: Company, Angel Research, Note * CAGR growth FY10
Expansion to capture volume growth
We believe FY2011 will continue to be an investment phase for these companies,
as they are operating at almost 90-95% utilisation levels in the automotive battery
segment and around 70-75% in the industrial segment. With lower growth in the
telecom battery segment, and sustained momentum in auto battery segment, the
players are building up their auto battery capacities to cash in on the higher
growth in the segment. Over the long run, volume growth opportunity in the auto
battery segment is higher for ARBL, which has 24-27% market share than Exide,
which has 60-65% market share.
Exhibit 12: Exide – Capex and capacity utilisation trend Exhibit 13: ARBL – Capex and capacity utilisation trend
(Rs cr) Capex Capacity utilisation (RHS) (%) (Rs cr) Capex Capacity utilisation (RHS) (%)
400 100 200 100
353
164 161
300 274 75 150 75
252 116
112
90
200 167 50 100 50
130 68
88 100 47
100 25 50 27 25
53
27 9
0 0 0 0
FY05
FY06
FY07
FY08
FY09
FY10
FY11E
FY12E
FY13E
FY05
FY06
FY07
FY08
FY09
FY10
FY11E
FY12E
FY13E
Source: Company, Angel Research Source: Company, Angel Research
September 2010 7
8. Auto Ancillary
Exhibit 14: Exide – Capex v/s FCF Exhibit 15: ARBL – Capex v/s FCF
(Rs cr) Capex FCF (Rs cr) Capex FCF
800 200 169 164 161
150 112 116
617
90 94
600 100 68
490 47
459 50 27 27 22
9
400 353 370 0
313
274 (5) (2)
252 (50)
194
167 (100)
200 130
88107 100 (93)
53 42 (150) (112)
27 33
(149)
0 (200)
FY05 FY06 FY07 FY08 FY09 FY10 FY11E FY12E FY13E FY05 FY06 FY07 FY08 FY09 FY10 FY11E FY12E FY13E
Source: Company, Angel Research Source: Company, Angel Research
We believe that both the companies are well placed in terms of funding their
expansion plans owing to strong operating cash flow and low debt/equity ratio.
The capacity expansions would broadly be funded through internal accruals.
Exhibit 16: Debt/Equity trend Exhibit 17: Asset turnover trend
(%) Exide ARBL (%) Exide ARBL
1.0 3.5
0.9 3.1 3.1 3.2
2.9 2.9 2.8 2.8
3.0 2.8 2.8
0.8 2.5
2.5 2.3 2.2
0.7 2.0 2.1
1.9
0.6 0.6 2.0 1.7
0.6 1.5
0.5 1.4
0.5 1.5
0.4 1.0
0.3 0.2
0.3 0.2 0.5
0.2 0.2 0.1
0.1 0.0
0.1
0.0 0.0 0.0 0.0
FY05
FY06
FY07
FY08
FY09
FY10
FY11E
FY12E
FY13E
0.0
FY05 FY06 FY07 FY08 FY09 FY10 FY11E FY12E FY13E
Source: Company, Angel Research Source: Company, Angel Research
High returns profile drives higher valuation, caps downside risks
Over the last few years, the battery manufacturers have clocked significant
increase in return ratios on the back of sustained volume growth and high
margins. Going ahead, over the next couple of years, profitability of the battery
manufacturers would continue to be determined largely by growing demand.
Further, on the back of higher capacity utilisation levels and apparent pricing
flexibility the high levels of RoCE and RoE would be maintained going forward in
turn capping downside risks.
September 2010 8
9. Auto Ancillary
Exhibit 18: RoE Exhibit 19: RoCE
(%) Exide ARBL (%) Exide ARBL
40 35 50
33 41
30 31
40 35 37
30 26 33 34
25 25 25 24 25 32 32
22 23 23 28 29 29
20 21 30 26 26
18
20 20 20
12 20 16 17
13
10 5 10
3
0 0
FY05
FY06
FY07
FY08
FY09
FY10
FY11E
FY12E
FY13E
FY05
FY06
FY07
FY08
FY09
FY10
FY11E
FY12E
FY13E
Source: Company, Angel Research Source: Company, Angel Research
Strong auto and industrial volumes and higher contribution from backward
integration coupled with a significant correction in input costs led to consistent
earnings upgrades driving the outperformance of the stocks. Going ahead too,
with the long-term consumption story of India intact, we expect the companies
(Exide and ARBL) to continue to outperform the benchmark indices.
Stocks outperform on fundamental grounds – Exide excels
On the bourses, over the past ten years, most battery stocks broadly outperformed
the benchmark indices reflecting sustained volume growth, significant margin
expansion and steady earnings growth. Exide in particular registered superior
performance during the period.
Exhibit 20: Exide, ARBL outperform benchmark Exhibit 21: ARBL outperforms on higher earnings growth
Sensex ARBL Exide Sensex ARBL Exide
6,000 2,000
5,000
1,500
4,000
3,000 1,000
2,000
500
1,000
0 0
Dec-06
Jun-09
Jan-09
Aug-08
Apr-05
Mar-08
Apr-10
Oct-07
Nov-09
Sep-05
Feb-06
Sep-10
Jul-06
May-07
Dec-01
Dec-03
Dec-05
Dec-07
Dec-09
Aug-02
Aug-04
Aug-06
Aug-08
Aug-10
Apr-01
Apr-03
Apr-05
Apr-07
Apr-09
Source: Bloomberg, Angel Research Source: Bloomberg, Angel Research
In the recent past, most battery players witnessed a sharp rally and touched their
life-time highs. Leader Exide is perceived as a defensive play (low beta) due to
consistent growth performance, strong cash-flow and prudent execution track
record. Thus, during the economic downturn it not only exhibited significant
strength, but also outperformed the benchmark indices over the last five years.
ARBL followed suit with strong growth in the industrial battery segment (telecom).
Nonetheless, the ARBL stock fluctuated and reflected the growth contraction during
the period due to contraction in demand of telecom batteries.
Over FY2005-10, ARBL has shown relative outperformance to Exide largely owing
to higher contribution from the telecom battery segment. However, the recent
structural shift in the telecom industry has impacted the industrial telecom battery
September 2010 9
10. Auto Ancillary
business of these companies, wherein the demand for telecom batteries has seen a
sharp correction in the growth rate. This in turn resulted in loss of bargaining
power and lower realisation from the telecom battery segment. As a result,
companies generating higher revenues from the telecom battery segment (ARBL
and HBL) relatively underperformed the market leader, Exide, in the recent past.
Exhibit 22: Absolute and relative performance
CMP (Rs) 1 Month 3 Month 6 Month 1 Year 3 Year 5 Year
Absolute Returns (%)
Exide 158 7.5 23.7 37.0 73.6 163.7 681.1
Amara Raja 213 12.9 21.5 27.5 54.1 121.2 896.0
HBL 28 14.1 (12.2) (19.9) (17.3) (17.2) 7.8
BSE Auto 9,397 5.9 15.5 23.2 42.3 82.9 162.5
BSE Sensex 19,906 8.2 13.3 13.2 18.9 21.8 134.2
Relative Returns v/s Sensex (%)
Exide 158 (0.7) 10.4 23.8 54.7 142.0 546.9
Amara Raja 213 4.7 8.2 14.3 35.2 99.4 761.8
HBL 28 5.9 (25.5) (33.1) (36.2) (38.9) (126.4)
BSE Auto 9,397 (2.3) 2.2 9.9 23.4 61.2 28.3
Source: Bloomberg, Angel Research; Note: Market price as of September 20, 2010
On an average, these stocks delivered CAGR returns of ~50-60% over the last five
years. We attribute the steady earnings CAGR of ~50-60% as the key factor
behind this outperformance.
Exide re-rates on superior performance
In terms of their one-year forward P/Es, most companies are trading in line with
their three-year averages, but at a ~20-30% discount to their peak valuations of
FY2007-08. The P/E of Exide has sharply expanded in the past five years on the
back of growth in domestic volumes. We note that, Exide’s multiple expansion and
investment strategies along with backward integration accelerated in FY2008.
Moreover, the company is immune to the fiscal pressures in the developed markets
owing to which there has been high appetite for such defensives during the global
downturn. On the other hand, companies generating higher revenues from
industrial battery segment like ARBL have relatively underperformed due to
reduced demand in telecom segment batteries in the last couple of years.
Exhibit 23: Exide – P/E multiple expands Exhibit 24: ARBL – P/E tracked industry cycle
(x) One-yr forward P/E Three-yr average P/E (x) One-yr forward P/E Three-yr average P/E
Long term average P/E Long term average P/E
30
30
25
25
20 20
15 15
10 10
5 5
0 0
Dec-01
Dec-03
Dec-05
Dec-07
Dec-09
Aug-02
Aug-04
Aug-06
Aug-08
Aug-10
Apr-01
Apr-03
Apr-05
Apr-07
Apr-09
Dec-01
Dec-03
Dec-05
Dec-07
Dec-09
Aug-02
Aug-04
Aug-06
Aug-08
Aug-10
Apr-01
Apr-03
Apr-05
Apr-07
Apr-09
Source: Bloomberg, Company, Angel Research Source: Bloomberg, Company, Angel Research
September 2010 10