1. Event Update I FMCG
May 12, 2010
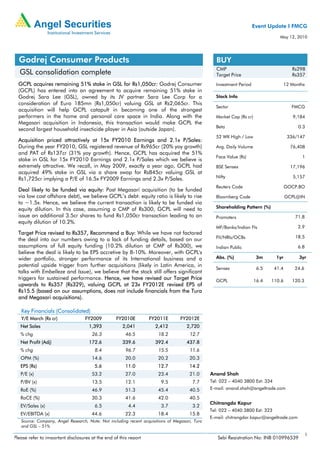
Godrej Consumer Products BUY
CMP Rs298
GSL consolidation complete Target Price Rs357
GCPL acquires remaining 51% stake in GSL for Rs1,050cr: Godrej Consumer Investment Period 12 Months
(GCPL) has entered into an agreement to acquire remaining 51% stake in
Godrej Sara Lee (GSL), owned by its JV partner Sara Lee Corp for a Stock Info
consideration of Euro 185mn (Rs1,050cr) valuing GSL at Rs2,065cr. This
Sector FMCG
acquisition will help GCPL catapult in becoming one of the strongest
performers in the home and personal care space in India. Along with the Market Cap (Rs cr) 9,184
Megasari acquisition in Indonesia, this transaction would make GCPL the
Beta 0.3
second largest household insecticide player in Asia (outside Japan).
52 WK High / Low 336/147
Acquisition priced attractively at 15x FY2010 Earnings and 2.1x P/Sales:
During the year FY2010, GSL registered revenue of Rs965cr (20% yoy growth) Avg. Daily Volume 76,408
and PAT of Rs137cr (31% yoy growth). Hence, GCPL has acquired the 51%
Face Value (Rs) 1
stake in GSL for 15x FY2010 Earnings and 2.1x P/Sales which we believe is
extremely attractive. We recall, in May 2009, exactly a year ago, GCPL had BSE Sensex 17,196
acquired 49% stake in GSL via a share swap for Rs845cr valuing GSL at
Rs1,725cr implying a P/E of 16.5x FY2009 Earnings and 2.3x P/Sales. Nifty 5,157
Reuters Code GOCP.BO
Deal likely to be funded via equity: Post Megasari acquisition (to be funded
via low cost offshore debt), we believe GCPL’s debt: equity ratio is likely to rise Bloomberg Code GCPL@IN
to ~1.5x. Hence, we believe the current transaction is likely to be funded via
equity dilution. In this case, assuming a CMP of Rs300, GCPL will need to Shareholding Pattern (%)
issue an additional 3.5cr shares to fund Rs1,050cr transaction leading to an Promoters 71.8
equity dilution of 10.2%.
MF/Banks/Indian FIs 2.9
Target Price revised to Rs357, Recommend a Buy: While we have not factored
FII/NRIs/OCBs 18.5
the deal into our numbers owing to a lack of funding details, based on our
assumptions of full equity funding (10.2% dilution at CMP of Rs300), we Indian Public 6.8
believe the deal is likely to be EPS accretive by 8-10%. Moreover, with GCPL's
wider portfolio, stronger performance of its International business and a Abs. (%) 3m 1yr 3yr
potential upside trigger from further acquisitions (likely in Latin America, in
Sensex 6.5 41.4 24.6
talks with Embelleze and Issue), we believe that the stock still offers significant
triggers for sustained performance. Hence, we have revised our Target Price GCPL 16.4 110.6 120.3
upwards to Rs357 (Rs329), valuing GCPL at 23x FY2012E revised EPS of
Rs15.5 (based on our assumptions, does not include financials from the Tura
and Megasari acquisitions).
Key Financials (Consolidated)
Y/E March (Rs cr) FY2009 FY2010E FY2011E FY2012E
Net Sales 1,393 2,041 2,412 2,720
% chg 26.3 46.5 18.2 12.7
Net Profit (Adj) 172.6 339.6 392.4 437.8
% chg 8.4 96.7 15.5 11.6
OPM (%) 14.6 20.0 20.2 20.3
EPS (Rs) 5.6 11.0 12.7 14.2
P/E (x) 53.2 27.0 23.4 21.0 Anand Shah
P/BV (x) 13.5 12.1 9.5 7.7 Tel: 022 – 4040 3800 Ext: 334
RoE (%) 46.9 51.3 45.4 40.5 E-mail: anand.shah@angeltrade.com
RoCE (%) 30.3 41.6 42.0 40.5
Chitrangda Kapur
EV/Sales (x) 6.5 4.4 3.7 3.2
Tel: 022 – 4040 3800 Ext: 323
EV/EBITDA (x) 44.6 22.3 18.4 15.8
E-mail: chitrangdar.kapur@angeltrade.com
Source: Company, Angel Research, Note: Not including recent acquisitions of Megasari, Tura
and GSL – 51%
1
Please refer to important disclosures at the end of this report Sebi Registration No: INB 010996539
2. GCPL I Event Update
Financial Implications of the deal
We have modeled in a 21% and 15% yoy growth in Top-line for GSL during
FY2011E and FY2012E respectively. Assuming a 14% Net Margin for GSL in
respective years, we believe the additional 51% stake of GSL is likely to add Rs83cr
and Rs96cr Bottom-line to GCPL in FY2011E and FY2012E respectively. Based on
our assumption of full funding via equity dilution (10.2% at CMP of Rs300), we
believe the deal is likely to be EPS accretive by 8-10%.
Exhibit1: Acquisition attractively priced, likely to be EPS accretive by 8-10%
(Rs cr) FY2010 FY2011 FY2012
Top-line
GCPL + GSL (49%) 2,041.2 2,412.3 2,719.5 Current Estimates for GCPL (Including 49% GSL Stake)
GSL Revenues 965.0 1,163.3 1,337.8 Total GSL Revenues
% chg 20.5 15.0 Modeling in 15-20% yoy growth in Top-line for GSL
GSL (Additional 51%) 593.3 682.3 Contribution to Top-line from acquisition of additional 51% of GSL
GCPL (100% GSL) 3,005.6 3,401.8 New Top-line estimates for GCPL (including 100% GSL)
Top-line Accretion 24.6 25.1 51% GSL to add ~25% to Top-line of GCPL
Bottom-line
GCPL + GSL (49% stake) 339.6 392.4 437.8 Current Estimates for GCPL (Including 49% GSL Stake)
GSL PAT 137.0 162.9 187.3 Total GSL Profit
NPM % 14.2 14.0 14.0 Maintaining 14% Net Margin for GSL
% chg 18.9 15.0
GSL (Additional 51%) 83.1 95.5 Contribution to Earnings from acquisition of additional 51% of GSL
GCPL (100% GSL) 475.5 533.3 New Earnings estimates for GCPL (including 100% GSL)
No of Shares (Post dilution) 34.32 34.32 Assuming deal funded via 100% equity dilution at CMP of Rs300
EPS (Including GSL 100%) 13.9 15.5 EPS (Post-dilution, including 100% of GSL's Earnings)
Old EPS Estimate 12.7 14.2
EPS Accretion 8.8 9.4 Deal to be EPS accretive by 8-10%
Source: Company, Angel Research
May 12, 2010 2
6. GCPL I Event Update
Research Team Tel: 022- 4040 3800 E-mail: research@angeltrade.com Website: www.angeltrade.com
DISCLAIMER
This document is solely for the personal information of the recipient, and must not be singularly used as the basis of any investment decision. Nothing in this
document should be construed as investment or financial advice. Each recipient of this document should make such investigations as they deem necessary to
arrive at an independent evaluation of an investment in the securities of the companies referred to in this document (including the merits and risks involved),
and should consult their own advisors to determine the merits and risks of such an investment.
Angel Securities Limited, its affiliates, directors, its proprietary trading and investment businesses may, from time to time, make investment decisions that are
inconsistent with or contradictory to the recommendations expressed herein. The views contained in this document are those of the analyst, and the company
may or may not subscribe to all the views expressed within.
Reports based on technical and derivative analysis center on studying charts of a stock's price movement, outstanding positions and trading volume, as
opposed to focusing on a company's fundamentals and, as such, may not match with a report on a company's fundamentals.
The information in this document has been printed on the basis of publicly available information, internal data and other reliable source believed to be true,
and is for general guidance only. Angel Securities Limited has not independently verified all the information contained within this document. Accordingly, we
cannot testify, nor make any representation or warranty, express or implied, to the accuracy, contents or data contained within this document. While Angel
Securities Limited endeavours to update on a reasonable basis the information discussed in this material, there may be regulatory, compliance, or other
reasons that prevent us from doing so.
This document is being supplied to you solely for your information, and its contents, information or data may not be reproduced, redistributed or passed on,
directly or indirectly.
Angel Securities Limited and its affiliates may seek to provide or have engaged in providing corporate finance, investment banking or other advisory services
in a merger or specific transaction to the companies referred to in this report, as on the date of this report or in the past.
Neither Angel Securities Limited, nor its directors, employees or affiliates shall be liable for any loss or damage that may arise from or in connection with the
use of this information.
Note: Please refer to the important `Stock Holding Disclosure' report on the Angel website (Research Section).
Disclosure of Interest Statement GCPL
1. Analyst ownership of the stock No
2. Angel and its Group companies ownership of the stock No
3. Angel and its Group companies’ Directors ownership of the stock No
4. Broking relationship with company covered No
Note: We have not considered any Exposure below Rs 1 lakh for Angel and its Group companies.
Address: Acme Plaza, ‘A’ Wing, 3rd Floor, M.V. Road, Opp. Sangam Cinema, Andheri (E), Mumbai - 400 059.
Tel : (022) 3952 4568 / 4040 3800
Angel Broking Ltd: BSE Sebi Regn No : INB 010996539 / CDSL Regn No: IN - DP - CDSL - 234 - 2004 / PMS Regn Code: PM/INP000001546 Angel Securities Ltd:BSE: INB010994639/INF010994639 NSE:
INB230994635/INF230994635 Membership numbers: BSE 028/NSE:09946
Angel Capital & Debt Market Ltd: INB 231279838 / NSE FNO: INF 231279838 / NSE Member code -12798 Angel Commodities Broking (P) Ltd: MCX Member ID: 12685 / FMC Regn No: MCX / TCM /
CORP / 0037 NCDEX : Member ID 00220 / FMC Regn No: NCDEX / TCM / CORP / 0302
May 12, 2010 6