1. 4QFY2010 Result Update I Capital Goods
May 18, 2010
Crompton Greaves BUY
CMP Rs243
Performance Highlights Target Price Rs307
Crompton Greaves reported another strong quarterly performance, with an Investment Period 12 Months
impressive 39.9% yoy growth in its adjusted bottom-line to Rs271cr, which was
better than our estimates. Although the company had a muted top-line Stock Info
performance, clocking a mere 1.9% yoy growth, it made up for this with a
Sector Capital Goods
wider-than-expected expansion in operating margins. Currently, the stock
trades at 17.7x FY2011E EPS and at 15.8x FY2012E EPS. We maintain our Buy Market Cap (Rs cr) 15,592
recommendation on the stock.
Beta 0.8
Strong operating performance – consolidated PAT surges by ~40%, beats
expectations: On the consolidated level, Crompton Greaves posted a muted 52 WK High / Low 280/111
top-line growth of 1.9% yoy to Rs2,508cr (Rs2,460cr) for 4QFY2010. Although Avg. Daily Volume 279,080
the standalone business posted a healthy top-line growth of 18.8% yoy,
international operations negated the effect, with a 19.0% yoy de-growth in its Face Value (Rs) 2
revenues (of which ~9% due to currency movement). For FY2010, the BSE Sensex 16,876
consolidated top-line grew by 4.6% yoy to Rs9,141cr (Rs8,737cr).
The consolidated EBITDA margin, however, expanded by 269bp to 16.1% Nifty 5,066
(13.4%), driven by higher operating margins for both the standalone and Reuters Code CROM.BO
international operations. Though the raw material cost increased 204bp as a %
of net sales, it was more than made up for by the combination of lower other Bloomberg Code CRG@IN
expenses and employee costs. Notably, as the margin improvement during the
Shareholding Pattern (%)
year was majorly led by operational efficiencies, the management seemed
confident of maintaining its margins at a consolidated level for FY2011E. Promoters 40.9
Higher operating margins, coupled with a lower tax rate (due to the lower tax
burden on international operations), led to an impressive 39.9% yoy growth in MF/Banks/Indian FIs 31.8
the adjusted net profit to Rs271cr (Rs194cr). For the full year FY2010, the FII/NRIs/OCBs 18.4
consolidated adjusted net profit grew 47.3% yoy to Rs825cr (Rs560cr).
Indian Public 8.9
Outlook and Valuation
Abs. (%) 3m 1yr 3yr
Crompton Greaves is one of the leading players in the power transmission and
distribution space in the country. During FY2010-12E, we expect the company Sensex 3.4 18.1 18.0
to register a Top-line and Bottom-line CAGR of 11.5% and 7.1%, respectively.
At the current price, the stock is quoting at 17.7x and 15.8x FY2011E and Crompton 4.6 108.3 88.9
FY2012E EPS, respectively, which we believe is attractive as compared to its
peers, ABB and Areva T&D. We maintain our Buy recommendation, with a
Target Price of Rs307.
Key Financials (Consolidated)
Y/E March (Rs cr) FY2009 FY2010 FY2011E FY2012E
Net Sales 8,737 9,141 10,068 11,354
% chg 27.9 4.6 10.1 12.8
Adj. Net Profit 560 860 882 986
% chg 37.7 53.6 2.5 11.8
EBITDA (%) 11.4 14.0 13.7 13.3
EPS (Rs) 8.7 13.4 13.7 15.4
P/E (x) 27.8 18.1 17.7 15.8
P/BV (x) 8.6 6.3 4.9 3.9
RoE (%) 36.1 39.9 30.9 27.3
RoCE (%) 27.5 31.5 29.0 27.1
Puneet Bambha
EV/Sales (x) 1.8 1.7 1.5 1.3
Tel: 022 – 4040 3800 Ext: 347
EV/EBITDA (x) 15.7 12.0 10.8 9.5 E-mail: puneet.bambha@angeltrade.com
Source: Company, Angel Research
1
Please refer to important disclosures at the end of this report Sebi Registration No: INB 010996539
2. Crompton Greaves I 4QFY2010 Result Update
Exhibit 1: 4QFY2010 Performance (Consolidated)
Y/E March (Rs cr) 4QFY10 4QFY09 % chg FY10 FY09 % chg
Net Sales 2,508 2,460 1.9 9,141 8,737 4.6
Raw Material 1,578 1,498 5.4 5,592 5,492 1.8
(% of Net Sales) 62.9 60.9 61.2 62.9
Employee Cost 262 291 (9.9) 1,113 1,065 4.6
(% of Net Sales) 10.5 11.8 12.2 12.2
Other Expenses 265 343 (22.7) 1,158 1,185 (2.2)
(% of Net Sales) 10.6 13.9 12.7 13.6
Total Expenditure 2,105 2,131 (1.2) 7,864 7,742 1.6
EBITDA 403 329 22.5 1,277 996 28.3
EBITDA (%) 16.1 13.4 14.0 11.4
Interest 12 13 (7.2) 26 66 (59.6)
Depreciation 40 30 32.9 155 122 27.5
Other Income 33 21 53.3 94 59 59.6
Profit before Tax 384 307 24.9 1,189 867 37.1
(% of Net Sales) 15.3 12.5 13.0 9.9
Total Tax 114 114 0.3 365 305 19.8
(% of PBT) 29.6 36.9 30.7 35.1
PAT before Minority Interest 270 194 39.3 824 563 46.5
Minority Interest (1) 0 (1) 3
Adjusted PAT 271 194 39.9 825 560 47.3
(% of Net Sales) 10.8 7.9 9.0 6.4
Extraordinary Items (35) 0 (35) 0
Reported PAT 307 194 58.0 860 560 53.6
Source: Company, Angel Research
Strong standalone performance: Crompton Greaves posted a 18.8% yoy growth in
its standalone top-line to Rs1,618cr (Rs1,362cr) for 4QFY2010, primarily driven by
the strong performance across all the three business segments. The EBITDA margin
expanded by 82bp to 16.7% (15.9%), on the back of lower other expenses.
Consequently, the standalone adjusted net profit for the quarter grew by 45.7% yoy
to Rs191cr (Rs131cr). For FY2010, the adjusted net profit grew by 45.3% yoy to
Rs577cr (Rs397cr).
International business – sales under pressure, but margins improve by 463bp: The
international business continues to face pressure, with the top-line falling sharply by
19.0% yoy to Rs890cr (Rs1,098cr) for 4QFY2010, which was primarily driven by the
18.5% yoy de-growth in the revenues of the international power systems segment.
Nonetheless, the EBITDA margin for the international business witnessed an
expansion of 463bp to 14.8% (10.2%), due to lower raw material costs along with
lower other expenses. Higher margins, coupled with a lower tax rate, resulted in a
net profit growth of 27.8% yoy to Rs81cr (Rs63cr). For FY2010, the net profit grew
by 52.1% yoy to Rs248cr (Rs163cr).
May 18, 2010 2
3. Crompton Greaves I 4QFY2010 Result Update
Exhibit 2: 4QFY2010 Performance (Standalone)
Y/E March (Rs cr) 4QFY10 4QFY09 % chg FY10 FY09 % chg
Net Sales 1,618 1,362 18.8 5,284 4,611 14.6
Raw Material 1,104 886 24.6 3,525 3,111 13.3
(% of Net Sales) 68.2 65.0 66.7 67.5
Employee Cost 65 63 3.1 256 229 11.6
(% of Net Sales) 4.0 4.6 4.8 5.0
Other Expenses 179 197 (8.9) 646 632 2.1
(% of Net Sales) 11.1 14.4 12.2 13.7
Total Expenditure 1,348 1,145 17.7 4,426 3,973 11.4
EBITDA 271 217 24.9 858 638 34.4
EBITDA (%) 16.7 15.9 16.2 13.8
Interest 4 4 4 15 (70.2)
Depreciation 13 13 (0.8) 52 45 14.8
Other Income 34 10 224.7 69 36 90.7
Profit before Tax 288 210 36.9 870 614 41.7
(% of Net Sales) 17.8 15.4 16.5 13.3
Total Tax 97 79 22.2 293 217 35.0
(% of PBT) 33.7 37.7 33.7 35.4
PAT before Minority Interest 191 131 45.7 577 397 45.3
Minority Interest
Adjusted PAT 191 131 45.7 577 397 45.3
(% of Net Sales) 11.8 9.6 10.9 8.6
Extraordinary Items (40) 0 (40) 0
Reported PAT 231 131 76.6 617 397 55.5
Source: Company, Angel Research
Segment-wise Performance
During the quarter, on the consolidated basis, the company’s consumer products
and industrial systems segments led its revenue growth, registering a robust 24.3%
and 16.8% growth, respectively. However, despite a strong growth of 14.7% in the
standalone power systems segment, the consolidated power systems segment de-
grew 4.9%, dragged down by the 18.5% yoy fall in the revenues of the international
power systems business.
On the margin front too, all the segments registered margin expansion. The
consolidated EBIT margin of the power systems segment increased by 216bp to
14.8% (12.7%), that of the consumer products segment by 244bp to 14.6% (12.1%),
while that of the industrial systems segment increased by 479bp to 25.6% (20.8%).
May 18, 2010 3
4. Crompton Greaves I 4QFY2010 Result Update
Exhibit 3: Segment-wise Performance (Consolidated)
Y/E March (Rs cr) 4QFY10 4QFY09 % chg FY10 FY09 % chg
Revenues
Power Systems 1,684 1,771 (4.9) 6,204 6,174 0.5
Consumer Products 460 370 24.3 1,612 1,322 21.9
Industrial Systems 348 298 16.8 1,259 1,150 9.5
Others 29 29 1.6 103 122 (15.5)
EBIT
Power Systems 249 224 11.3 769 625 23.1
Consumer Products 67 45 49.3 230 146 57.1
Industrial Systems 89 62 43.7 276 213 29.4
Others 2 5 (56.9) 15 19 (22.3)
EBIT Margin (%)
Power Systems 14.8 12.7 12.4 10.1
Consumer Products 14.6 12.1 14.3 11.1
Industrial Systems 25.6 20.8 21.9 18.5
Others 6.7 15.7 14.6 15.9
Source: Company, Angel Research
Exhibit 4: Segment-wise Performance (Standalone)
Y/E March (Rs cr) 4QFY10 4QFY09 % chg FY10 FY09 % chg
Revenues
Power Systems 829 722 14.7 2,510 2,224 12.9
Consumer Products 460 370 24.3 1,612 1,322 21.9
Industrial Systems 337 270 24.8 1,174 1,055 11.3
Others 6 7 (25.2) 25 40 (38.2)
EBIT
Power Systems 161 128 25.5 462 349 32.3
Consumer Products 67 45 49.3 230 146 57.1
Industrial Systems 78 55 41.8 260 204 27.5
Others 0 1 (57.5) 1 1 34.7
EBIT Margin (%)
Power Systems 19.5 17.8 18.4 15.7
Consumer Products 14.6 12.1 14.3 11.1
Industrial Systems 23.2 20.4 22.1 19.3
Others 5.6 9.9 4.0 1.9
May 18, 2010 4
5. Crompton Greaves I 4QFY2010 Result Update
Outlook and Valuation
Crompton Greaves is one of the leading players in the power transmission and
distribution space in the country. The company has a diversified business presence,
with revenues accruing from multiple streams that are spread across geographies.
Besides, over the past few years, the company has made several strategic overseas
acquisitions, which, in addition to plugging in technology gaps, have provided the
necessary scale to its operations.
During FY2010-12E, we expect the company to register a Top-line and Bottom-line
CAGR of 11.5% and 7.1%, respectively. At the current price, the stock is quoting at
17.7x and 15.8x FY2011E and FY2012E EPS, respectively, which we believe is
attractive as compared to its peers, ABB and Areva T&D. We maintain our Buy
recommendation, with a Target Price of Rs307
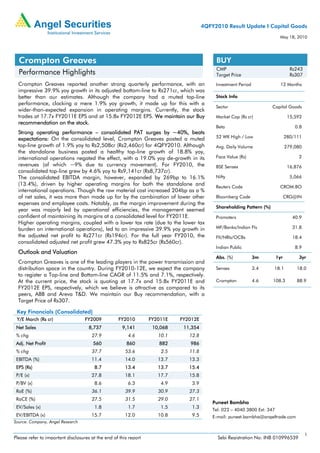
Exhibit 5: 12-month Forward Rolling P/E Band
400
26x
350
300
20x
Share Price (Rs)
250
200 14x
150
8x
100
50
2x
0
Apr-02
Apr-03
Apr-04
Apr-05
Apr-06
Apr-07
Apr-08
Apr-09
Apr-10
Oct-02
Oct-03
Oct-04
Oct-05
Oct-06
Oct-07
Oct-08
Oct-09
Source: C-line, Angel Research
May 18, 2010 5
9. Crompton Greaves I 4QFY2010 Result Update
Research Team Tel: 4040 3800 E-mail: research@angeltrade.com Website: www.angeltrade.com
DISCLAIMER
This document is solely for the personal information of the recipient, and must not be singularly used as the basis of any investment decision. Nothing in this
document should be construed as investment or financial advice. Each recipient of this document should make such investigations as they deem necessary to
arrive at an independent evaluation of an investment in the securities of the companies referred to in this document (including the merits and risks involved),
and should consult their own advisors to determine the merits and risks of such an investment.
Angel Securities Limited, its affiliates, directors, its proprietary trading and investment businesses may, from time to time, make investment decisions that are
inconsistent with or contradictory to the recommendations expressed herein. The views contained in this document are those of the analyst, and the company
may or may not subscribe to all the views expressed within.
Reports based on technical and derivative analysis center on studying charts of a stock's price movement, outstanding positions and trading volume, as
opposed to focusing on a company's fundamentals and, as such, may not match with a report on a company's fundamentals.
The information in this document has been printed on the basis of publicly available information, internal data and other reliable sources believed to be true,
and are for general guidance only. Angel Securities Limited has not independently verified all the information contained within this document. Accordingly,
we cannot testify, nor make any representation or warranty, express or implied, to the accuracy, contents or data contained within this document. While
Angel Securities Limited endeavours to update on a reasonable basis the information discussed in this material, there may be regulatory, compliance, or
other reasons that prevent us from doing so.
This document is being supplied to you solely for your information, and its contents, information or data may not be reproduced, redistributed or passed on,
directly or indirectly.
Angel Securities Limited and its affiliates may seek to provide or have engaged in providing corporate finance, investment banking or other advisory services
in a merger or specific transaction to the companies referred to in this report, as on the date of this report or in the past.
Neither Angel Securities Limited nor its directors, employees and affiliates shall be liable for any loss or damage that may arise from or in connection with the
use of this information.
Note: Please refer to the important `Stock Holding Disclosure' report on the Angel website (Research Section).
Disclosure of Interest Statement Crompton Greaves
1. Analyst ownership of the stock No
2. Angel and its Group companies ownership of the stock No
3. Angel and its Group companies’ Directors ownership of the stock No
4. Broking relationship with company covered No
Note: We have not considered any Exposure below Rs 1 lakh for Angel and its Group companies.
Address: Acme Plaza, ‘A’ Wing, 3rd Floor, M.V. Road, Opp. Sangam Cinema, Andheri (E), Mumbai - 400 059.
Tel : (022) 3952 4568 / 4040 3800
Angel Broking Ltd: BSE Sebi Regn No : INB 010996539 / CDSL Regn No: IN - DP - CDSL - 234 - 2004 / PMS Regn Code: PM/INP000001546 Angel Securities Ltd:BSE: INB010994639/INF010994639 NSE:
INB230994635/INF230994635 Membership numbers: BSE 028/NSE:09946
Angel Capital & Debt Market Ltd: INB 231279838 / NSE FNO: INF 231279838 / NSE Member code -12798 Angel Commodities Broking (P) Ltd: MCX Member ID: 12685 / FMC Regn No: MCX / TCM /
CORP / 0037 NCDEX : Member ID 00220 / FMC Regn No: NCDEX / TCM / CORP / 0302
May 18, 2010 9