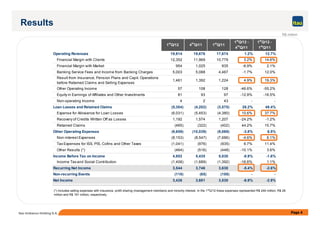
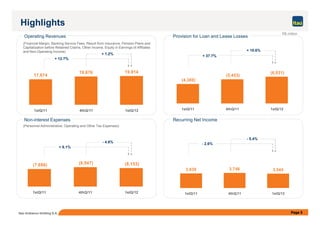
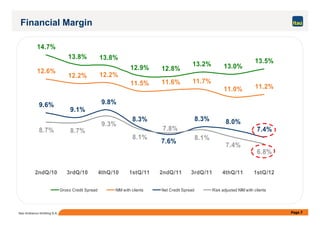
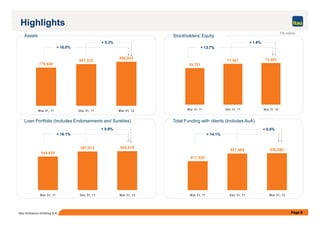
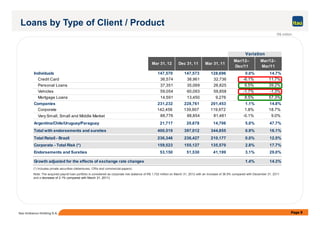
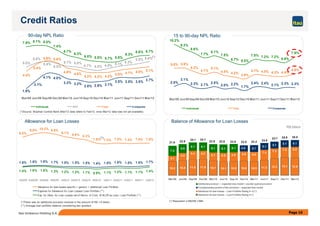
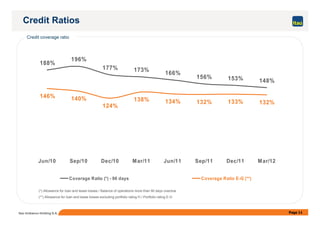
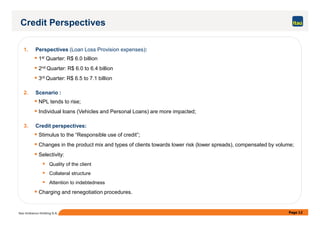
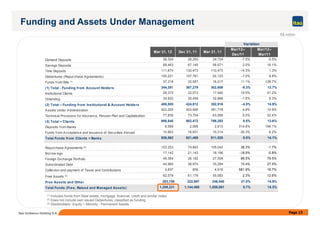
2. 1. Results:
Recurring net income reached R$ 3.5 billion in the 1stQ/12 (20.0% ROE).
2. Loan Portfolio Growth:
The loan portfolio exceeded R$ 400 billion on March 31, 2012, a 0.9% growth from December 31, 2011 and 16.1% from March 31, 2011.
Highlights
Mar 31, 12 Dec 31, 11 Mar 31, 11
Mar/12–
Dec/11
Mar/12–
Mar/11
Individuals 147,570 147,573 128,696 0.0% 14.7%
Companies 231,232 228,761 201,453 1.1% 14.8%
Argentina/Chile/Uruguay/Paraguay 21,717 20,678 14,706 5.0% 47.7%
Total w ith endorsem ents and sureties
Variation
Page 2Itaú Unibanco Holding S.A.
3. Financial Margin with Clients:
Financial Margin with Clients grew 3.2% in the quarter, to reach R$ 12.4 billion and 14.6% compared to the 1stQ/11;
Net Interest Margin with Clients increased 20 basis points in the 1stQ/12 to 11.2%. The Credit Spread increased 50 basis points in the quarter
to 13.5%, while the Risk adjusted Credit Spread (Net Spread) presented a 60 basis point decrease in the 1stQ/12.
Total w ith endorsem ents and sureties 400,519 397,012 344,855 0.9% 16.1%
Private Securities (*) 17,067 15,220 15,598 12.1% 9.4%
Adjusted Total Risk 417,586 412,233 360,453 1.3% 15.9%
Grow th adjusted for the effects of exchange rate changes 1.4% 14.3%
(*) Includes Debentures, CRI and Commercial Paper
3. 4. Banking Service Fees and Result from Insurance, Pension Plans and Capitalization:
Banking service fees plus result from insurance, pension plans and capitalization operations grew 14.1% in the 1stQ/12 compared to the
same period of 2011, totaling R$ 5.8 billion, but decreased 2.6% compared to the prior quarter due to seasonal reasons.
5. Non-Performing Loans Ratio and Loan Losses:
Expense for allowance for loan and lease losses, net of recovery of credits, totaled R$ 4.8 billion in the 1stQ/12. The expense for allowance
for loan and lease losses increased 10.6% compared to the 4thQ/11 and reached R$ 6.0 billion;
The 90-day NPL ratio reached 5.1% in the 1stQ/12, a 20 basis point growth compared to the previous quarter and a 90 basis point increase
compared to March 2011 and it continues to show an increasing trend.
Highlights
Page 3Itaú Unibanco Holding S.A.
6. Non-Interest Expenses:
Non-interest expenses decreased 4.6% compared to last quarter, totaling R$ 8.2 billion in the 1stQ/12. Annualized growth at 6.1% is in line
with our expectations.
7. Efficiency Ratio:
Efficiency ratio in the 1stQ/12 reached 44.5%, decreasing 250 basis points compared to the previous quarter and 290 basis points compared
to the same period of 2011;
During the past 12 months the efficiency ratio reached 46.6%, decreasing by 260 basis points from the same period of 2011.
8. Subsequent Events:
The Brazilian Central Bank approved on April 23rd the acquisition of 49% of Banco Carrefour by Itaú Unibanco;
Sell of Itaú Unibanco’s stake in Banco Português de Investimento (BPI) to La Caixa Group.
4. 1st
Q/12 4th
Q/11 1st
Q/11
1st
Q/12 -
4th
Q/11
1st
Q/12 -
1st
Q/11
Operating Revenues 19,914 19,676 17,674 1.2% 12.7%
Financial Margin with Clients 12,352 11,969 10,779 3.2% 14.6%
Financial Margin with Market 954 1,025 935 -6.9% 2.1%
Banking Service Fees and Income from Banking Charges 5,003 5,088 4,467 -1.7% 12.0%
Result from Insurance, Pension Plans and Capit. Operations
before Retained Claims and Selling Expenses
1,461 1,392 1,224 4.9% 19.3%
Other Operating Income 57 108 128 -46.6% -55.2%
Equity in Earnings of Affiliates and Other Investments 81 93 97 -12.9% -16.5%
Non-operating Income 4 2 43 - -
Loan Losses and Retained Claims (5,304) (4,202) (3,575) 26.2% 48.4%
Expense for Allowance for Loan Losses (6,031) (5,453) (4,380) 10.6% 37.7%
Results
R$ million
Page 4Itaú Unibanco Holding S.A.
Expense for Allowance for Loan Losses (6,031) (5,453) (4,380) 10.6% 37.7%
Recovery of Credits Written Off as Losses 1,192 1,574 1,207 -24.2% -1.2%
Retained Claims (465) (322) (402) 44.2% 15.7%
Other Operating Expenses (9,659) (10,039) (9,069) -3.8% 6.5%
Non-interest Expenses (8,153) (8,547) (7,686) -4.6% 6.1%
Tax Expenses for ISS, PIS, Cofins and Other Taxes (1,041) (976) (935) 6.7% 11.4%
Other Results (*) (464) (516) (448) -10.1% 3.6%
Income Before Tax on Income 4,952 5,435 5,030 -8.9% -1.6%
Income Tax and Social Contribution (1,408) (1,689) (1,392) -16.6% 1.1%
Recurring Net Income 3,544 3,746 3,638 -5.4% -2.6%
Non-recurring Events (118) (65) (108) - -
Net Income 3,426 3,681 3,530 -6.9% -2.9%
(*) Includes selling expenses with insurance, profit sharing (management members) and minority interest. In the 1stQ/12 these expenses represented R$ 246 million, R$ 28
million and R$ 191 million, respectively.
5. Highlights
17,674
19,676 19,914
1stQ/11 4thQ/11 1stQ/12
(4,380)
(5,453)
(6,031)
1stQ/11 4thQ/11 1stQ/12
Operating Revenues Provision for Loan and Lease Losses
(Financial Margin, Banking Service Fees, Result from Insurance, Pension Plans and
Capitalization before Retained Claims, Other Income, Equity in Earnings of Affiliates
and Non-Operating Income)
+ 12.7%
+ 1.2%
+ 37.7%
+ 10.6%
R$ million
Page 5Itaú Unibanco Holding S.A.
3,638 3,746 3,544
1stQ/11 4thQ/11 1stQ/12
(7,686) (8,547) (8,153)
1stQ/11 4thQ/11 1stQ/12
Non-interest Expenses Recurring Net Income
(Personnel Administrative, Operating and Other Tax Expenses)
+ 6.1%
- 4.6% - 2.6%
- 5.4%
6. 5,045
5,906 5,754
1stQ/11 4thQ/11 1stQ/12
Highlights
11.5% 11.0% 11.2%
1stQ/11 4thQ/11 1stQ/12
Net Interest Margin (with Clients) Banking Service Fees and Result from Insurance
- 30 bps
+ 20 bps
+ 14.1%
- 2.6%
( Banking Service Fees and Result from Insurance, Pension Plans and
Capitalization after Retained Claims and selling expenses)
28.9%30.0%28.5%
Participation over Operating Revenues
R$ million
Page 6Itaú Unibanco Holding S.A.
0.73 0.70
0.75
0.80
0.73
0.87
0.83 0.78
0.70
0.67
0.86
0.78
0.79
0.84 0.82
0.76
2ndQ/10 3rdQ/10 4thQ/10 1stQ/11 2ndQ/11 3rdQ/11 4thQ/11 1stQ/12
Recurring Net Income per share Net Income per share
23.4%
21.8%
20.0%
1stQ/11 4thQ/11 1stQ/12
Recurring ROE (average) Earnings per Share
- 340 bps
- 180 bps
R$
8. Highlights
779,640
851,332
896,842
Mar 31, 11 Dec 31, 11 Mar 31, 12
63,731
71,347 72,484
Mar 31, 11 Dec 31, 11 Mar 31, 12
Assets Stockholders' Equity
R$ million
+ 15.0%
+ 5.3%
+ 13.7%
+ 1.6%
Page 8Itaú Unibanco Holding S.A.
811,520
921,469 926,062
Mar 31, 11 Dec 31, 11 Mar 31, 12
344,855
397,012 400,519
Mar 31, 11 Dec 31, 11 Mar 31, 12
+ 16.1%
+ 0.9%
+ 14.1%
+ 0.5%
Loan Portfolio (Includes Endorsements and Sureties) Total Funding with clients (Includes AuA)
9. Loans by Type of Client / Product
R$ million
Mar 31, 12 Dec 31, 11 Mar 31, 11
Mar/12–
Dec/11
Mar/12–
Mar/11
Individuals 147,570 147,573 128,696 0.0% 14.7%
Credit Card 36,574 38,961 32,736 -6.1% 11.7%
Personal Loans 37,351 35,069 26,825 6.5% 39.2%
Vehicles 59,054 60,093 59,858 -1.7% -1.3%
Mortgage Loans 14,591 13,450 9,276 8.5% 57.3%
Companies 231,232 228,761 201,453 1.1% 14.8%
Corporate 142,456 139,907 119,972 1.8% 18.7%
Variation
Page 9Itaú Unibanco Holding S.A.
(*) Includes private securities (debentures, CRIs and commercial papers).
Note: The acquired payroll loan portfolio is considered as corporate risk (balance of R$ 1,732 million on March 31, 2012 with an increase of 36.9% compared with December 31, 2011
and a decrease of 2.1% compared with March 31, 2011).
Very Small, Small and Middle Market 88,776 88,854 81,481 -0.1% 9.0%
Argentina/Chile/Uruguay/Paraguay 21,717 20,678 14,706 5.0% 47.7%
Total with endorsements and sureties 400,519 397,012 344,855 0.9% 16.1%
Total Retail - Brazil 236,346 236,427 210,177 0.0% 12.5%
-
Corporate - Total Risk (*) 159,523 155,127 135,570 2.8% 17.7%
Endorsements and Sureties 53,150 51,530 41,199 3.1% 29.0%
1.4% 14.3%Growth adjusted for the effects of exchange rate changes
10. Credit Ratios
90-day NPL Ratio 15 to 90-day NPL Ratio
7.9% 8.1% 8.0%
7.4%
6.7%
6.3%
6.0% 5.8% 5.7% 5.8%
6.3%
6.6% 6.7%
5.0%
5.6%
5.1% 5.0%
4.5%
5.5%
4.4%
4.8%
4.6%
4.2% 4.2% 4.2%
4.5% 4.7% 4.9% 5.1%
3.5% 3.5% 3.5%
3.7%
5.3%
5.8%
5.5%
5.8% 5.1%4.8%4.7%
5.4%
5.9% 5.6%
1.9%
3.1%
4.1% 4.0%
3.3% 3.2%
2.8% 2.9% 3.1%
Mar/09 Jun/09 Sep/09 Dec/09 Mar/10 Jun/10 Sep/10 Dec/10 Mar/11 Jun/11 Sep/11 Dec/11 Mar/12
Individuals SFN Total Companies
7.2% 7.2%
6.9%
7.9%
5.8% 5.9%
5.2%
4.7%
5.1%
4.5% 4.2%
3.9%
4.7% 4.5% 4.3% 4.4%
4.8%
2.5%
3.1%
2.3% 2.1%
2.5%
2.0% 2.2%
1.7%
2.4% 2.4%
2.1% 2.3% 2.3%
7.5%
6.5%6.7%
7.5%
8.1%
7.7%
8.6%
9.3%
10.2%
Mar/09 Jun/09 Sep/09 Dec/09 Mar/10 Jun/10 Sep/10 Dec/10 Mar/11 Jun/11 Sep/11 Dec/11 Mar/12
Individuals Total Companies
(*)Source: Brazilian Central Bank (Mar/12 data refers to Feb/12, once Mar/12 data was not yet available).
(*)
Page 10Itaú Unibanco Holding S.A.
10.2 10.9 11.6 11.8 10.7 10.1 10.2 10.6 10.3 11.3 12.3 13.1 12.9
4.1
5.5
6.4 6.2
6.1 6.5 6.8 6.9 6.8
7.4 7.3 7.6 8.05.1
5.1 5.1 5.1 5.1
7.3
6.5
6.1 6.1
6.1 6.1 6.1 4.5
25.824.7
23.822.222.023.022.622.9
24.124.1
22.921.6
26.0
Mar/09 Jun/09 Sep/09 Dec/09 Mar/10 Jun/10 Sep/10 Dec/10 Mar/11 Jun/11 Sep/11 Dec/11 Mar/12
Additional provision — expected loss model + counter-cyclical provision
Complementary portion of the provision— expected loss model
Allowance for loan losses – Loan Portfolio Rating A–G (*)
Allowance for loan losses – Loan Portfolio Rating H (*)
Balance of Allowance for Loan LossesAllowance for Loan Losses
R$ billion
(*)There was an additional provision reversal in the amount of R$ 1.6 billion.
(**) Average loan portfolio balance considering two quarters.
(*) Resolution 2.682/99 CMN
(*)
9.0%
9.8% 10.2% 9.8%
9.1%
8.6% 8.3%
7.5% 7.3% 7.5% 7.4% 7.5% 7.5%
1.6% 1.8% 1.8% 1.7% 1.5% 1.5% 1.5% 1.4% 1.5% 1.6% 1.5% 1.6% 1.7%
1.4% 1.6% 1.6% 1.3% 1.2% 1.2% 1.1% 0.9% 1.1% 1.2% 1.1% 1.1% 1.4%
1stQ/09 2ndQ/09 3rdQ/09 4thQ/09 1stQ/10 2ndQ/10 3rdQ/10 4thQ/10 1stQ/11 2ndQ/11 3rdQ/11 4thQ/11 1stQ/12
Allowance for loan losses specific + generic + additional/ Loan Portfolio
Expense for Allowance for Loan Losses/ Loan Portfolio (**)
Exp. for Allow. for Loan Losses net of Recov. of Cred. Writt.Off as Loss / Loan Portfolio (**)
(*)Source: Brazilian Central Bank (Mar/12 data refers to Feb/12, once Mar/12 data was not yet available).
11. Credit Ratios
Credit coverage ratio
188%
196%
177% 173%
166%
156% 153% 148%
146% 140%
124%
138% 134% 132% 133% 132%
Page 11Itaú Unibanco Holding S.A.
(*) Allowance for loan and lease losses / Balance of operations more than 90 days overdue
(**) Allowance for loan and lease losses excluding portfolio rating H / Portfolio rating E-G
Jun/10 Sep/10 Dec/10 Mar/11 Jun/11 Sep/11 Dec/11 Mar/12
Coverage Ratio (*) - 90 days Coverage Ratio E-G (**)
12. 1. Perspectives (Loan Loss Provision expenses):
1st Quarter: R$ 6.0 billion
2nd Quarter: R$ 6.0 to 6.4 billion
3rd Quarter: R$ 6.5 to 7.1 billion
2. Scenario :
NPL tends to rise;
Individual loans (Vehicles and Personal Loans) are more impacted;
Credit Perspectives
Page 12Itaú Unibanco Holding S.A.
Individual loans (Vehicles and Personal Loans) are more impacted;
3. Credit perspectives:
Stimulus to the “Responsible use of credit”;
Changes in the product mix and types of clients towards lower risk (lower spreads), compensated by volume;
Selectivity:
Quality of the client
Collateral structure
Attention to indebtedness
Charging and renegotiation procedures.
13. Mar 31, 12 Dec 31, 11 Mar 31, 11
Mar/12–
Dec/11
Mar/12–
Mar/11
Demand Deposits 26,324 28,293 24,724 -7.0% 6.5%
Savings Deposits 68,463 67,145 58,971 2.0% 16.1%
Time Deposits 111,874 130,473 110,473 -14.3% 1.3%
Debentures (Repurchase Agreements) 100,221 107,781 92,123 -7.0% 8.8%
Funds from Bills (1) 37,318 33,587 16,317 11.1% 128.7%
(1) Total - Funding from Account Holders 344,201 367,279 302,608 -6.3% 13.7%
Institutional Clients 26,373 22,073 17,440 19.5% 51.2%
Onlending 34,932 35,459 32,868 -1.5% 6.3%
(2) Total – Funding from Institutional & Account Holders 405,505 424,812 352,916 -4.5% 14.9%
Assets Under Administration 423,205 403,906 381,778 4.8% 10.9%
Variation
R$ million
Funding and Assets Under Management
Page 13Itaú Unibanco Holding S.A.
Technical Provisions for Insurance, Pension Plan and Capitalization 77,830 73,754 63,599 5.5% 22.4%
(3) Total – Clients 906,540 902,472 798,293 0.5% 13.6%
Deposits from Banks 8,569 2,066 2,913 314.8% 194.1%
Funds from Acceptance and Issuance of Securities Abroad 10,953 16,931 10,314 -35.3% 6.2%
Total Funds from Clients + Banks 926,062 921,469 811,520 0.5% 14.1%
Repurchase Agreements (2) 103,253 74,663 105,042 38.3% -1.7%
Borrow ings 17,142 21,143 18,196 -18.9% -5.8%
Foreign Exchange Portfolio 49,364 26,182 27,508 88.5% 79.5%
Subordinated Debt 44,984 38,974 35,294 15.4% 27.5%
Collection and payment of Taxes and Contributions 5,837 856 4,918 581.9% 18.7%
Free Assets (3) 62,579 61,179 55,583 2.3% 12.6%
Free Assets and Other 283,159 222,997 246,540 27.0% 14.9%
Total Funds (Free, Raised and Managed Assets) 1,209,221 1,144,466 1,058,061 5.7% 14.3%
(1) Includes funds from Real estate, mortgage, financial, credit and similar notes.
(2) Does not include own issued Debentures, classified as funding.
(3) Stockholders´ Equity + Minority - Permanent Assets.
14. 98.1% 95.1%
101.1% 102.9%
97.8% 100.5%
95.5% 96.7%
76.8% 75.6% 75.5% 75.9% 73.2% 75.2% 71.9% 75.9%
400
433 446
481 458 500
600
700
800
Ratio between Loan Portfolio and Funding
R$ billion
+0.5%
- 0.8%
Page 14Itaú Unibanco Holding S.A.
267 292 292 295 334 362
74 75 99 105
109 112
119 99341 367 391 400
433 446 458
324 359
335 345
262 277 295 304 317
347
Jun/10 Sep/10 Dec/10 Mar/11 Jun/11 Sep/11 Dec/11 Mar/12
-
100
200
300
400
500
Loan Portfolio / Funding (%) Loan Portfolio / Gross Funding(**) (%)
(*) Includes resources obtained from account holders and institutional clients, onlending, foreign borrowings and securities, borrowings and subordinated debts that are not
included in Tier II Reference Equity. Considers the deductions of compulsory deposits and cash and cash equivalents;
(**) Considers gross funding (disregarding the deductions of compulsory deposits and cash and cash equivalents)
Funding (*) Compulsory Deposits and Cash Loan Portfolio
15. 1st
Q/12 4th
Q/11 1st
Q/11
1st
Q/12 -
4th
Q/11
1st
Q/12 -
1st
Q/11
Asset Management 707 662 636 6.7% 11.0%
Current Account Services 750 680 576 10.3% 30.3%
Loan Operations and Guarantees Provided 687 859 778 -20.1% -11.8%
Collection Services 345 345 330 0.1% 4.5%
Credit Cards 2,031 2,110 1,691 -3.7% 20.1%
Other 484 432 455 12.1% 6.3%
Banking Service Fees Incom e 5,003 5,088 4,467 -1.7% 12.0%
Result from Insurance, Pension Plans and Capitalization(*) 750 819 577 -8.4% 30.0%
Total 5,754 5,906 5,045 -2.6% 14.1%
Banking Service Fees and Result from Insurance, Pension Plans and
Capitalization
R$ million
(*) Income from insurance, pension plan and capitalization operations (-) Expenses for claims (-) Selling expenses with insurance, pension plan and capitalization
Page 15Itaú Unibanco Holding S.A.
4,784 4,911 4,950 5,045 5,309 5,502
5,906 5,754
29.2% 29.3% 27.6% 28.5% 29.3% 28.4% 30.0% 28.9%
2ndQ/10 3rdQ/10 4thQ/10 1stQ/11 2ndQ/11 3rdQ/11 4thQ/11 1stQ/12
Banking Service Fees and Income from Banking Charges + Result from Insur., Pens. Plans and Capit.
(Banking Service Fees and Income from Banking Charges + Result from Insur., Pens. Plans and Capit.)/Operating Revenues
16. 1st
Q/12 4th
Q/11 1st
Q/11
1st
Q/12 -
4th
Q/11
1st
Q/12 -
1st
Q/11
Personnel Expenses (3,392) (3,308) (3,243) 2.5% 4.6%
Administrative Expenses (3,428) (3,833) (3,260) -10.6% 5.1%
Personnel Expenses and Adm inistrative (6,820) (7,141) (6,503) -4.5% 4.9%
Operating Expenses (*) (1,234) (1,284) (1,105) -3.9% 11.6%
Other Tax Expenses (**) (99) (122) (78) -18.2% 28.1%
Non–Interest Expenses (8,153) (8,547) (7,686) -4.6% 6.1%
(*) Considers expenses for provision for contingencies, credit card selling, claims and other.
(**) Includes IPTU, IPVA, IOF and other. Does not include PIS, Cofins and ISS
Non–Interest Expenses and Efficiency Ratio
R$ million
Efficiency Ratio and Risk-Adjusted Efficiency Ratio
Page 16Itaú Unibanco Holding S.A.
47.8 50.2 51.5 47.4 47.8 47.0 47.0 44.5
69.7 70.9 69.2 68.7 71.8 69.0 69.5 72.6
71.5 70.7 69.5 69.6 70.1 69.7 69.8 70.7
46.8 48.0 48.8 49.2 49.2 48.4 47.3 46.6
2ndQ/10 3rdQ/10 4thQ/10 1stQ/11 2ndQ/11 3rdQ/11 4thQ/11 1stQ/12
Quarter E.R. (%) Quarter R.A.E.R. (%)
E.R. Cumulative figure of the last 12 months (%) R.A.E.R. Cumulative figure of the last 12 months (%)
Efficiency Ratio and Risk-Adjusted Efficiency Ratio
17. 31%
15%
34%
16%
Itaú Unibanco’s Recurring Net Income Composition
1stQ/20124thQ/2011
Page 17Itaú Unibanco Holding S.A.
10%
21%
23%
10%
19%
21%
Consumer Credit
Activities with the Market + Corporation
Commercial Bank
Itaú BBA
Insurance, Pension Plans and Capitalization
18. BIS Ratio
Evolution of BIS Ratio, Tier I and Tangible Capital (*)
(Economic Financial Consolidated)
16.1% 16.4% 16.1%
12.5%12.6%12.7%
11.8%11.9%11.9%
Page 18Itaú Unibanco Holding S.A.
(*)The Tangible Common Equity – TCE is defined internationally as equity less intangible assets, goodwill and non-voting shares. In Brazil, non-voting shares essentially fulfill the role of capital and,
therefore, were not excluded. We point out that the tax credits were not excluded for this calculation and, therefore, do not represent the concept of core capital introduced by the Basel Pillar III.
Note: Based on the financial conglomerate concept (“consolidado operacional”), the BIS ratio reached 15.6% on March 31, 2012.
Mar/11 Dec/11 Mar/12
BIS Tier I Tangible Capital
Considers the Stockholder’s Equity decrease of R$ 1,847 million due to the supplementary payment of interest on capital that occurred on March 13, 2012 and
the new method of calculating the portion required for Market Risk.
On April 13, 2012, the Brazilian Central Bank approved R$ 711 million of subordinated debt to compose our Tier II, and together with other issuances amounting
to R$ 860 million that are still pending approval, totaling R$ 1,571 million, would lead our BIS ratio to 16.4% (30 bps increase).
19. 242
641
874
650
735 743
23.8
41.2
54.5
80.8
115.3
140.5
107.9
175.1 179.6
152.8 158.2
Market Capitalization and Average Daily Trading Volume
R$ million
Average Daily Trading Volume
(1)
Page 19Itaú Unibanco Holding S.A.
Market Capitalization (R$ billion)
106
224
452
632
368
443 458 461
189
191
207
277 282
32 36 51
185
319
641
559
650
9 13 19
23 23 32
79
95
2002 2003 2004 2005 2006 2007 2008 2009 2010 2011 1stQ/12
(1) As of March 31, 2012, we were the 10th largest bank in the world in terms of market capitalization (Source: Bloomberg)
NYSE (ADR) BM&FBOVESPA (Non-voting + Common)
20. Subsequent Event – Banco BPI
Sell of our total stake in Banco BPI, representing 18.87% of the capital stock, to La Caixa Group;
La Caixa Group has a strong presence in the Iberian Peninsula and is the largest stockholder of
Banco BPI;
The intended sale is conditional to the prior authorization of the Banco de Portugal;
As a consequence of this operation, La Caixa will pay approximately € 93 million;
Page 20Itaú Unibanco Holding S.A.
The transaction will have a positive impact of about R$ 100 million on the consolidated stockholders´
equity and a negative non-recurring effect of approximately R$ 200 million in the income statement;
These impacts will be booked in the second quarter 2012 results.