Union bank result update 4 qfy2010 100510
•
0 likes•118 views

Union Bank of India reported a 27.6% year-over-year increase in net profit for the fourth quarter of fiscal year 2010, beating expectations. Loan growth was 23.4% and deposit growth was 22.6% for the quarter. While asset quality pressures rose with an increase in the gross NPA ratio, the bank's net interest income grew 50.7% due to strong growth in current and savings deposits. The analyst recommends accumulating the stock due to the bank's profitable operations and competitive position, setting a target price of Rs318, an 8% upside from current levels.

Recommended
More Related Content
What's hot
What's hot (17)
Viewers also liked
Viewers also liked (16)
Similar to Union bank result update 4 qfy2010 100510
Similar to Union bank result update 4 qfy2010 100510 (20)
More from Angel Broking
More from Angel Broking (20)
Union bank result update 4 qfy2010 100510
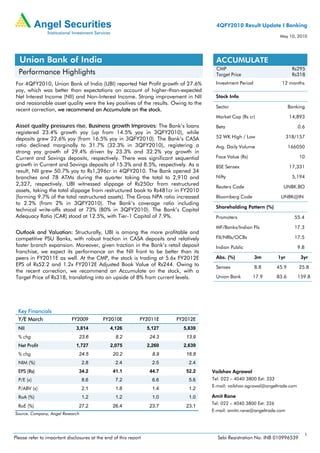
- 1. 4QFY2010 Result Update I Banking May 10, 2010 Union Bank of India ACCUMULATE CMP Rs295 Performance Highlights Target Price Rs318 For 4QFY2010, Union Bank of India (UBI) reported Net Profit growth of 27.6% Investment Period 12 months yoy, which was better than expectations on account of higher-than-expected Net Interest Income (NII) and Non-Interest Income. Strong improvement in NII Stock Info and reasonable asset quality were the key positives of the results. Owing to the Sector Banking recent correction, we recommend an Accumulate on the stock. Market Cap (Rs cr) 14,893 Asset quality pressures rise, Business growth Improves: The Bank’s loans Beta 0.6 registered 23.4% growth yoy (up from 14.5% yoy in 3QFY2010), while deposits grew 22.6% yoy (from 16.5% yoy in 3QFY2010). The Bank’s CASA 52 WK High / Low 318/157 ratio declined marginally to 31.7% (32.3% in 3QFY2010), registering a Avg. Daily Volume 166050 strong yoy growth of 29.4% driven by 23.3% and 32.2% yoy growth in Current and Savings deposits, respectively. There was significant sequential Face Value (Rs) 10 growth in Current and Savings deposits of 15.3% and 8.5%, respectively. As a BSE Sensex 17,331 result, NII grew 50.7% yoy to Rs1,396cr in 4QFY2010. The Bank opened 34 branches and 78 ATMs during the quarter taking the total to 2,910 and Nifty 5,194 2,327, respectively. UBI witnessed slippage of Rs250cr from restructured Reuters Code UNBK.BO assets, taking the total slippage from restructured book to Rs481cr in FY2010 (forming 9.7% of the total restructured assets). The Gross NPA ratio increased Bloomberg Code UNBK@IN to 2.2% (from 2% in 3QFY2010). The Bank’s coverage ratio including Shareholding Pattern (%) technical write-offs stood at 73% (80% in 3QFY2010). The Bank’s Capital Adequacy Ratio (CAR) stood at 12.5%, with Tier-1 Capital of 7.9%. Promoters 55.4 MF/Banks/Indian FIs 17.3 Outlook and Valuation: Structurally, UBI is among the more profitable and competitive PSU Banks, with robust traction in CASA deposits and relatively FII/NRIs/OCBs 17.5 faster branch expansion. Moreover, given traction in the Bank’s retail deposit Indian Public 9.8 franchise, we expect its performance on the NII front to be better than its peers in FY2011E as well. At the CMP, the stock is trading at 5.6x FY2012E Abs. (%) 3m 1yr 3yr EPS of Rs52.2 and 1.2x FY2012E Adjusted Book Value of Rs244. Owing to Sensex 8.8 45.9 25.8 the recent correction, we recommend an Accumulate on the stock, with a Target Price of Rs318, translating into an upside of 8% from current levels. Union Bank 17.9 83.6 159.8 Key Financials Y/E March FY2009 FY2010E FY2011E FY2012E NII 3,814 4,126 5,127 5,839 % chg 23.6 8.2 24.3 13.9 Net Profit 1,727 2,075 2,260 2,639 % chg 24.5 20.2 8.9 16.8 NIM (%) 2.8 2.4 2.5 2.4 EPS (Rs) 34.2 41.1 44.7 52.2 Vaibhav Agrawal P/E (x) 8.6 7.2 6.6 5.6 Tel: 022 – 4040 3800 Ext: 333 E-mail: vaibhav.agrawal@angeltrade.com P/ABV (x) 2.1 1.8 1.4 1.2 RoA (%) 1.2 1.2 1.0 1.0 Amit Rane Tel: 022 – 4040 3800 Ext: 326 RoE (%) 27.2 26.4 23.7 23.1 E-mail: amitn.rane@angeltrade.com Source: Company, Angel Research 1 Please refer to important disclosures at the end of this report Sebi Registration No: INB 010996539
- 2. Union Bank of India I 4QFY2010 Result Update Exhibit 1: 4QFY2010 Performance Y/E March (Rs cr) 4QFY10 3QFY10 % chg (qoq) 4QFY09 % chg (yoy) FY10 FY09 % chg Interest Earned 3,562 3,294 8.1 3290 8.3 13,236 11,916 11.1 Interest Expenses 2,166 2,229 (2.8) 2363 (8.4) 9,110 8,076 12.8 Net Interest Income 1,396 1,065 31.1 926 50.7 4,126 3,840 7.4 Non-Interest Income 493 465 6.0 559 (11.9) 2,041 1,456 40.2 Total Income 1,889 1,529 23.5 1485 27.1 6,167 5,296 16.4 Operating Expenses 741 615 20.5 574 29.1 2,508 2,214 13.3 Pre-Prov. Profit 1,148 914 25.5 911 25.9 3,659 3,082 18.7 Provisions & Cont. 340 161 111.1 283 20.0 826 737 12.1 PBT 808 753 7.2 628 28.6 2,833 2,345 20.8 Prov. for Taxes 214 219 (2.3) 163 31.3 758 618 22.7 PAT 594 534 11.1 465 27.6 2,075 1,727 20.2 EPS (Rs) 11.7 10.6 11.1 9.2 27.6 41.1 34.2 20.2 Cost to Income (%) 39.2 40.2 38.6 40.7 41.8 Effective Tax Rate (%) 26.5 29.1 26.0 26.8 26.4 Net NPAs (%) 0.8 0.6 0.3 0.8 0.3 Source: Company, Angel Research Improvement in Business Growth The Bank’s loans registered 23.4% yoy growth (up from 14.5% yoy in 3QFY2010), while deposits grew 22.6% yoy (from 16.5% yoy in 3QFY2010). The credit deposit ratio stood at 71.3% in 4QFY2010 (from 70.5% in 3QFY2010). Management has given guidance of advances and deposit growth of 25% and 22% respectively, in FY2011E. We are presently factoring in 20% loan growth for FY2011E. The Bank’s CASA ratio declined marginally to 31.7% (32.3% in 3QFY2010), registering a strong yoy growth of 29.4% driven by 23.3% and 32.2% yoy growth in Current and Savings deposits, respectively. There was significant sequential growth in Current and Savings deposits of 15.3% and 8.5%, respectively. As a result, the Bank’s NII increased 50.7% yoy to Rs1,396cr in 4QFY2010. May 10, 2010 2
- 3. Union Bank of India I 4QFY2010 Result Update Exhibit 2: Advances & Deposits Trend (%) 40.0 35.0 30.0 25.0 20.0 15.0 10.0 5.0 0.0 4QFY08 1QFY09 2QFY09 3QFY09 4QFY09 1QFY10 2QFY10 3QFY10 4QFY10 Advances Growth (% yoy) Deposit Growth (% yoy) Source: Company, Angel Research Non-Interest Income driven by Treasury Gains Non-Interest Income grew 6% qoq to Rs492cr in 4QFY2010, with core Fee Income and Treasury gains constituting 70% and 3%, respectively. Profit on forex transactions improved 65.7% yoy to Rs58cr. For the whole of FY2010, the bank delivered a strong 32.7% yoy growth in Fee income to Rs896cr. We expect the Bank’s core Fee Income to be largely in line with the Balance Sheet growth over FY2010-12E. Exhibit 3: Strong Performance in Core Fee Income CAGR Period (Rs cr) FY2007 FY2008 FY2009 FY2010 % yoy FY07-10 Core Fee Income 279 505 675 896 32.7 46.8 Treasury Income 199 510 517 730 41.2 53.5 Profit from Forex Transactions 108 128 143 166 16.1 15.9 Recovery from W/o Accounts 101 177 148 183 23.6 21.0 Total Non-Interest Income 687 1320 1483 1975 33.2 41.6 Source: Company, Angel Research Operating costs increase on higher Employee expenses During 4QFY2010, the Cost-to-Income Ratio stood at 39.2% as against 40.2% in 3QFY2010 and 38.6% in 4QFY2009 following strong Operating performance of the Bank. Total Operating Expenses increased 20.5% on a sequential basis driven by 30.5% growth in Employee costs to Rs424cr in 4QFY2010. The Bank opened 34 branches and 78 ATMs during 4QFY2010 taking the total to 2,910 and 2,327, respectively. The Bank aims to maintain the long-term Cost-to-Income ratio of 42%. May 10, 2010 3
- 4. Union Bank of India I 4QFY2010 Result Update Exhibit 4: Productivity Trend 45.0 44.4 43.8 44.0 42.9 43.0 42.0 40.8 41.0 40.3 40.2 40.0 39.2 38.6 39.0 38.0 37.0 36.0 35.0 1QFY09 2QFY09 3QFY09 4QFY09 1QFY10 2QFY10 3QFY10 4QFY10 Cost-to-income Ratio Source: Company, Angel Research Asset Quality under Pressure, but reasonable coverage During 4QFY2010, the Bank registered Rs250cr from restructured assets, taking total slippage from restructured book to Rs481cr in FY2010 (accounts for 9.7% of the total restructured assets). As a result, Gross NPAs increased 27.6% sequentially to Rs2,671cr and Gross NPAs to Advances ratio stood at 2.2% (from 2% in 3QFY2010). Gross slippage in FY2010 stood at Rs1,785cr taking the slippage ratio to 1.8% from 1.6% in FY2009. Net NPA Ratio of the Bank deteriorated to 0.8% in 4QFY2010 from 0.6% in 3QFY2010. The Bank’s coverage ratio including technical write-offs stood at 73% (from 80% in 3QFY2010). During 4QFY2010, the Bank restructured another Rs215cr of Advances, taking the total restructured advances to Rs4,955cr (4.1% of Total Advances and 48% of Net Worth). Exhibit 5: Asset Quality Trend 2.50 2.00 1.50 1.00 0.50 - 1QFY2009 2QFY2010 3QFY2009 4QFY2009 1QFY2010 2QFY2010 3QFY2010 4QFY2010 Gross NPA % Net NPA % Source: Company, Angel Research May 10, 2010 4
- 5. Union Bank of India I 4QFY2010 Result Update Higher Provisions for Investments Due to the pressure on Asset quality, the Bank had to provide Rs313cr towards NPAs, a sharp increase from Rs43cr in 3QFY2010. There was write-back of Rs18cr on account of depreciation on investments. The Bank’s AFS portfolio constituted 31% of its Investment Book, with a moderate modified duration of 1.7 years (down from 2.6 years at the end of 2QFY2010). The overall modified duration was also relatively moderate at 4.4 years. Capital Adequacy The Capital Adequacy Ratio (CAR) of the Bank stood at 12.5%, with Tier-1 Capital of 7.9%. The Bank has also approached the government to infuse Rs1,800cr to meet its expansion plans. Outlook and Valuation In our view, structurally UBI is among the more profitable and competitive PSU Banks in India. We have a positive outlook on the Bank due to its robust traction in CASA deposits, consistency in core Fee Income growth and relatively faster branch expansion. Moreover, given the traction in the Bank’s retail deposit franchise driven by branch expansion, we expect its performance on the NII front to be better than its peers in FY2011E as well. At the CMP, the stock is trading at 5.6x FY2012E EPS of Rs52.2 and 1.2x FY2012E Adjusted Book Value of Rs239. Owing to the recent correction, we recommend an Accumulate on the stock, with a Target Price of Rs318, translating into an upside of 8% from current levels. Exhibit 6: P/ABV Band Rs 450 400 350 300 250 200 150 100 50 0 Sep-02 Mar-03 Sep-03 Mar-04 Sep-04 Mar-05 Sep-05 Mar-06 Sep-06 Mar-07 Sep-07 Mar-08 Sep-08 Mar-09 Sep-09 Mar-10 Sep-10 Price 0.6x 0.9x 1.2x 1.5x 1.8x Source: Company, Angel Research May 10, 2010 5
- 6. Union Bank of India I 4QFY2010 Result Update Income Statement (Rs cr) Ratio Analysis Y/E March FY2009 FY2010E FY2011E FY2012E Y/E March FY2009 FY2010E FY2011E FY2012E Net Interest Income 3,814 4,126 5,127 5,839 Profitability Ratios (%) YoY Growth (%) 23.6 8.2 24.3 13.9 NIMs 2.8 2.4 2.5 2.4 Other Income 1,483 2,042 1,843 2,152 Cost to Income ratio 41.8 40.7 41.0 42.2 YoY Growth (%) 20.3 37.7 (9.7) 16.8 RoA 1.2 1.2 1.0 1.0 Operating Income 5,296 6,168 6,970 7,991 RoE 27.2 26.4 23.7 23.1 YoY Growth (%) 22.6 16.5 13.0 14.6 B/S Ratios (%) Operating Expenses 2,214 2,508 2,859 3,373 CASA ratio 30.1 31.7 31.4 31.2 YoY Growth (%) 39.0 13.3 14.0 18.0 Credit/Deposit ratio 69.6 71.3 71.9 72.5 Pre - Provision Profit 3,082 3,660 4,111 4,618 CAR 11.2 12.5 11.7 11.8 YoY Growth (%) 13.1 18.7 12.3 12.3 - Tier I 6.9 7.6 7.1 7.2 Prov. & Cont. 725 827 1,026 1,016 Asset Quality (%) YoY Growth (%) (16.2) 13.9 24.2 (1.0) Gross NPAs 2.0 2.2 1.8 1.6 Profit Before Tax 2,357 2,833 3,085 3,602 Net NPAs 0.3 0.8 0.5 0.5 YoY Growth (%) 26.7 20.2 8.9 16.7 Slippages 1.6 1.8 1.7 1.5 Prov. for Taxation 630 758 826 964 NPA prov. / avg. assets 0.4 0.4 0.3 0.3 Provision coverage 83.1 63.7 70.9 70.4 as a % of PBT 26.7 26.8 26.8 26.8 Per Share Data (Rs) PAT 1,727 2,075 2,260 2,638 EPS 34.2 41.1 44.7 52.2 YoY Growth (%) 24.5 20.2 8.9 16.7 ABVPS (75% Cover) 139.7 165.4 204.0 244.2 DPS 5.0 8.0 8.5 10.0 Valuation Ratios Balance Sheet (Rs cr) P/E (x) Y/E March FY2009 FY2010E FY2011E FY2012E 8.6 7.2 6.6 5.6 Share Capital 505 505 505 505 P/ABVPS (x) 2.1 1.8 1.4 1.2 Reserve & Surplus 8,235 9,838 11,595 13,642 Dividend Yield 1.7 2.7 2.9 3.4 Deposits 138,703 170,040 202,348 236,747 DuPont Analysis Growth (%) 33.5 22.6 19.0 17.0 NII 2.7 2.3 2.4 2.3 Borrowings 3,885 3,776 4,493 5,257 (-) Prov. Exp. 0.5 0.5 0.5 0.4 Tier 2 Capital 4,890 6,005 7,205 8,502 Adj. NII 2.2 1.8 1.9 1.9 Other Liab. & Prov. 4,757 7,182 8,694 10,110 Treasury 0.2 0.3 0.1 0.0 Total Liabilities 160,976 197,345 234,840 274,763 Int. Sens. Inc. 2.4 2.2 1.9 1.9 Cash balances 8,992 8,502 14,164 17,756 Other Inc. 0.8 0.8 0.8 0.8 Bank balances 6,993 7,894 9,394 10,991 Op. Inc. 3.2 3.0 2.8 2.7 Investments 42,997 52,483 57,294 64,508 Advances 96,534 121,249 145,499 171,689 Opex 1.6 1.4 1.3 1.3 Growth (%) 29.8 25.6 20.0 18.0 PBT 1.7 1.6 1.4 1.4 Fixed Assets 2,335 2,777 3,205 3,638 Taxes 0.4 0.4 0.4 0.4 Other Assets 3,124 4,440 5,284 6,182 RoA 1.2 1.2 1.0 1.0 Total Assets 160,976 197,345 234,840 274,763 Leverage 22.5 22.8 22.7 22.3 Growth (%) 29.7 22.6 19.0 17.0 RoE 27.2 26.4 23.7 23.1 May 10, 2010 6
- 7. Union Bank of India I 4QFY2010 Result Update Research Team Tel: 022 - 4040 3800 E-mail: research@angeltrade.com Website: www.angeltrade.com DISCLAIMER This document is solely for the personal information of the recipient, and must not be singularly used as the basis of any investment decision. Nothing in this document should be construed as investment or financial advice. Each recipient of this document should make such investigations as they deem necessary to arrive at an independent evaluation of an investment in the securities of the companies referred to in this document (including the merits and risks involved), and should consult their own advisors to determine the merits and risks of such an investment. Angel Securities Limited, its affiliates, directors, its proprietary trading and investment businesses may, from time to time, make investment decisions that are inconsistent with or contradictory to the recommendations expressed herein. The views contained in this document are those of the analyst, and the company may or may not subscribe to all the views expressed within. Reports based on technical and derivative analysis center on studying charts of a stock's price movement, outstanding positions and trading volume, as opposed to focusing on a company's fundamentals and, as such, may not match with a report on a company's fundamentals. The information in this document has been printed on the basis of publicly available information, internal data and other reliable sources believed to be true, and is for general guidance only. Angel Securities Limited has not independently verified all the information contained within this document. Accordingly, we cannot testify, nor make any representation or warranty, express or implied, to the accuracy, contents or data contained within this document. While Angel Securities Limited endeavours to update on a reasonable basis the information discussed in this material, there may be regulatory, compliance, or other reasons that prevent us from doing so. This document is being supplied to you solely for your information, and its contents, information or data may not be reproduced, redistributed or passed on, directly or indirectly. Angel Securities Limited and its affiliates may seek to provide or have engaged in providing corporate finance, investment banking or other advisory services in a merger or specific transaction to the companies referred to in this report, as on the date of this report or in the past. Neither Angel Securities Limited, nor its directors, employees or affiliates shall be liable for any loss or damage that may arise from or in connection with the use of this information. Note: Please refer to the important `Stock Holding Disclosure' report on the Angel website (Research Section). Disclosure of Interest Statement Union Bank of India 1. Analyst ownership of the stock No 2. Angel and its Group companies ownership of the stock No 3. Angel and its Group companies’ Directors ownership of the stock No 4. Broking relationship with company covered No Note: We have not considered any Exposure below Rs 1 lakh for Angel and its Group companies. Address: Acme Plaza, ‘A’ Wing, 3rd Floor, M.V. Road, Opp. Sangam Cinema, Andheri (E), Mumbai - 400 059. Tel : (022) 3952 4568 / 4040 3800 Angel Broking Ltd: BSE Sebi Regn No : INB 010996539 / CDSL Regn No: IN - DP - CDSL - 234 - 2004 / PMS Regn Code: PM/INP000001546 Angel Securities Ltd:BSE: INB010994639/INF010994639 NSE: INB230994635/INF230994635 Membership numbers: BSE 028/NSE:09946 Angel Capital & Debt Market Ltd: INB 231279838 / NSE FNO: INF 231279838 / NSE Member code -12798 Angel Commodities Broking (P) Ltd: MCX Member ID: 12685 / FMC Regn No: MCX / TCM / CORP / 0037 NCDEX : Member ID 00220 / FMC Regn No: NCDEX / TCM / CORP / 0302 May 10, 2010 7