Solution Manual for Financial Accounting, 11th Edition by Robert Libby, Patri...
Dena bank ru2 qfy2011
1. Please refer to important disclosures at the end of this report 1
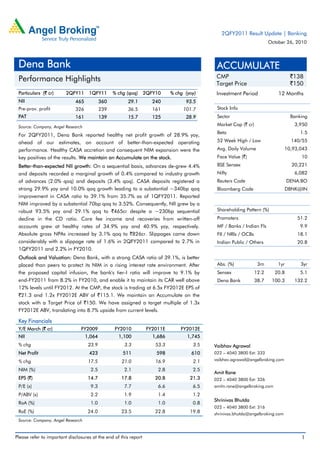
Particulars (` cr) 2QFY11 1QFY11 % chg (qoq) 2QFY10 % chg (yoy)
NII 465 360 29.1 240 93.5
Pre-prov. profit 326 239 36.5 161 101.7
PAT 161 139 15.7 125 28.9
Source: Company, Angel Research
For 2QFY2011, Dena Bank reported healthy net profit growth of 28.9% yoy,
ahead of our estimates, on account of better-than-expected operating
performance. Healthy CASA accretion and consequent NIM expansion were the
key positives of the results. We maintain an Accumulate on the stock.
Better-than-expected NII growth: On a sequential basis, advances de-grew 4.4%
and deposits recorded a marginal growth of 0.4% compared to industry growth
of advances (2.0% qoq) and deposits (3.4% qoq). CASA deposits registered a
strong 29.9% yoy and 10.0% qoq growth leading to a substantial ~340bp qoq
improvement in CASA ratio to 39.1% from 35.7% as of 1QFY2011. Reported
NIM improved by a substantial 70bp qoq to 3.52%. Consequently, NII grew by a
robust 93.5% yoy and 29.1% qoq to `465cr despite a ~230bp sequential
decline in the CD ratio. Core fee income and recoveries from written-off
accounts grew at healthy rates of 34.9% yoy and 40.9% yoy, respectively.
Absolute gross NPAs increased by 3.1% qoq to `826cr. Slippages came down
considerably with a slippage rate of 1.6% in 2QFY2011 compared to 2.7% in
1QFY2011 and 2.2% in FY2010.
Outlook and Valuation: Dena Bank, with a strong CASA ratio of 39.1%, is better
placed than peers to protect its NIM in a rising interest rate environment. After
the proposed capital infusion, the bank's tier-I ratio will improve to 9.1% by
end-FY2011 from 8.2% in FY2010, and enable it to maintain its CAR well above
12% levels until FY2012. At the CMP, the stock is trading at 6.5x FY2012E EPS of
`21.3 and 1.2x FY2012E ABV of `115.1. We maintain an Accumulate on the
stock with a Target Price of `150. We have assigned a target multiple of 1.3x
FY2012E ABV, translating into 8.7% upside from current levels.
Key Financials
Y/E March (` cr) FY2009 FY2010 FY2011E FY2012E
NII 1,064 1,100 1,686 1,745
% chg 23.9 3.3 53.3 3.5
Net Profit 423 511 598 610
% chg 17.5 21.0 16.9 2.1
NIM (%) 2.5 2.1 2.8 2.5
EPS (`) 14.7 17.8 20.8 21.3
P/E (x) 9.3 7.7 6.6 6.5
P/ABV (x) 2.2 1.9 1.4 1.2
RoA (%) 1.0 1.0 1.0 0.8
RoE (%) 24.0 23.5 22.8 19.8
Source: Company, Angel Research
ACCUMULATE
CMP `138
Target Price `150
Investment Period 12 Months
Stock Info
Sector Banking
Market Cap (` cr) 3,950
Beta 1.5
52 Week High / Low 140/55
Avg. Daily Volume 10,93,043
Face Value (`) 10
BSE Sensex 20,221
Nifty 6,082
Reuters Code DENA.BO
Bloomberg Code DBNK@IN
Shareholding Pattern (%)
Promoters 51.2
MF / Banks / Indian Fls 9.9
FII / NRIs / OCBs 18.1
Indian Public / Others 20.8
Abs. (%) 3m 1yr 3yr
Sensex 12.2 20.8 5.1
Dena Bank 38.7 100.3 132.2
Vaibhav Agrawal
022 – 4040 3800 Ext: 333
vaibhav.agrawal@angelbroking.com
Amit Rane
022 – 4040 3800 Ext: 326
amitn.rane@angelbroking.com
Shrinivas Bhutda
022 – 4040 3800 Ext: 316
shrinivas.bhutda@angelbroking.com
2QFY2011 Result Update | Banking
October 26, 2010
Dena Bank
Performance Highlights
2. Dena Bank | 2QFY2011 Result Update
October 26, 2010 2
Exhibit 1: 2QFY2011 performance
Particulars (` cr) 2QFY11 1QFY11 % chg (qoq) 2QFY10 % chg (yoy)
Interest earned 1,221 1,115 9.6 963 26.9
Interest expenses 756 754 0.3 722 4.7
NII 465 360 29.1 240 93.5
Non-interest income 119 107 11.0 125 (5.1)
Operating income 584 468 24.9 366 59.7
Operating expenses 259 229 12.9 204 26.6
Pre-prov. profit 326 239 36.5 161 101.7
Provisions & cont. 73 43 70.1 1 4,889.7
PBT 253 196 29.1 160 58.0
Prov. for taxes 92 57 61.7 35 160.7
PAT 161 139 15.7 125 28.9
EPS (`) 5.6 4.8 15.7 4.3 28.9
Cost-to-income ratio (%) 44.3 49.0 55.9
Effective tax rate (%) 36.5 29.1 22.1
Net NPA (%) 1.5 1.5 1.2
Source: Company, Angel Research
Exhibit 2: 2QFY2011 actual v/s Angel estimates
Particulars (` cr) Actual Estimates Var. (%)
NII 465 377 23.5
Non-interest income 119 90 32.1
Operating income 584 467 25.2
Operating expenses 259 224 15.3
Pre-prov. profit 326 242 34.3
Provisions & cont. 73 46 58.5
PBT 253 196 28.7
Prov. for taxes 92 59 56.4
PAT 161 138 16.8
Source: Company, Angel Research
Advances and deposits growth sluggish on a sequential basis
In 2QFY2011, on a sequential basis advances de-grew by 4.4% and deposits
recorded a marginal growth of 0.4% compared to industry growth of advances
(2.0% qoq) and deposits growth (3.4% qoq). On a yoy basis, advances growth
(21.0%) and deposits growth (18.2%) was in line with industry growth. On account
of growth in deposits compared to de-growth in advances on a sequential basis,
credit-to-deposit (CD) ratio fell to 67.7% in 2QFY2011 from 71.1% in 1QFY2011.
Growth in advances was driven by agricultural loans (25.5% yoy) and retail loans
(18.0% yoy).
On the deposits side, CASA deposits registered a strong 29.9% yoy and 10.0%
qoq growth leading to a substantial ~340bp qoq improvement in CASA ratio to
39.1% from 35.7% as of 1QFY2011.
3. Dena Bank | 2QFY2011 Result Update
October 26, 2010 3
Exhibit 3: Advances and deposits growth sluggish qoq
Source: Company, Angel Research
Exhibit 4: Strong traction in CASA deposits
Source: Company, Angel Research
On the back of improvement in CASA ratio, re-pricing of bulk deposits and higher
focus on retail and SME lending, reported NIM improved by a substantial 70bp
qoq to 3.52% in 2QFY2011 from 2.82% in 1QFY2011. Consequently, the bank’s
NII grew by a robust 93.5% yoy and 29.1% qoq to `465cr despite a ~230bp
sequential decline in CD ratio.
Management expects to sustain NIM above 3%+ levels for FY2011 on the back of
higher focus on CASA deposits accretion and retail and SME lending.
Exhibit 5: NIMs surprise on the upside
Source: Company, Angel Research
Lower treasury, but healthy core fee and recoveries
Core fee income and recoveries from written-off accounts grew at healthy rates of
34.9% yoy and 40.9% yoy, respectively. However, total non-interest income
declined by 5.1% yoy to `119cr because of minor losses in treasury compared to
profit of `38cr in 2QFY2010.
Management is expecting recoveries from written-off accounts to the tune of
`100cr+ in FY2011 out of which `45cr has been achieved during 1HFY2011.
Also, the bank is planning to extend depository services in 57 additional branches
compared to a total of 49 branches offering the facility as of now. The bank also
has plans to launch on-line trading facility shortly. These initiatives are likely to
help the bank in sustaining the traction in non-interest income.
29,925
30,924
35,462
37,884
36,210
45,251
47,844
51,344
53,311
53,498
66.1
64.6
69.1
71.1
67.7
60.0
63.0
66.0
69.0
72.0
-
15,000
30,000
45,000
60,000
2QFY10 3QFY10 4QFY10 1QFY11 2QFY11
Advances (` cr) Deposits (` cr) CD ratio (%, RHS)
35.2
35.6 35.5
36.0 35.7
39.1
32.0
34.0
36.0
38.0
40.0
1QFY10 2QFY10 3QFY10 4QFY10 1QFY11 2QFY11
2.3
2.5
2.8 2.8
3.5
-
1.0
2.0
3.0
4.0
2QFY10 3QFY10 4QFY10 1QFY11 2QFY11
4. Dena Bank | 2QFY2011 Result Update
October 26, 2010 4
Exhibit 6: Strong traction in other income despite minor loss in treasury
Particulars (` cr) 2QFY11 1QFY11 % chg (qoq) 2QFY10 % chg (yoy)
CEB 92 79 15.8 68 34.9
Treasury (0) 10 NA 38 NA
Recoveries 27 18 51.5 19 40.9
Total 119 107 11.0 125 (5.1)
Source: Company, Angel Research
Slippages come down
The bank’s absolute gross NPAs increased marginally by 3.1% sequentially to
`826cr in 2QFY2011. The annualised gross slippage ratio came down to 1.6%
during the quarter from 2.7% in 1QFY2011 and from 2.2% in FY2010. Fresh
slippages amounted to `143cr out of which majority belonged to the corporate
advances. Recoveries were up from `37cr in 1QFY2011 to `53cr in
2QFY2011.Consequently, gross NPA ratio deteriorated to 2.3% (from 2.1% in
1QFY2011).
On account of aggressive provisioning charges, net NPAs reduced by 4.2%
sequentially to `538cr. Net NPA ratio was stable sequentially at 1.5%. The NPA
provision coverage ratio including technical write-offs improved to 75.4% (from
74.1% as of 1QFY2011). The bank’s cumulative restructured advances stood at
`1,306cr and formed 3.6% of advances and 45.1% of net worth. During the
quarter, there were slippages of `67cr from restructured accounts, taking the total
slippages from restructured accounts to 7.7% of restructured advances.
Exhibit 7: Trend in asset quality
Source: Company, Angel Research Note: Coverage ratio for excluding write-offs till 3QFY2010
Improved productivity
During the quarter, total operating expenses increased by 12.9% qoq and 26.6%
yoy to `259cr, driven by 34.2% increase in employee costs and 15.4% rise in other
operating expenses. However, the cost-to-income ratio improved substantially both
on a yoy and qoq basis to 44.3% in 2QFY2011 (from 49.0% in 1QFY2011 and
55.9% in 2QFY2010). The bank added 20 more branches increasing its branch
network to 1,257 during the quarter. Currently, the bank has 46 branch licenses
pending and aims to utilise all of them during 3QFY2011. The bank also opened
20 new ATMs during the quarter taking its ATM network to 441.
568
585
621
629
598
586
642
801
826
248
266
313
353
372
365
428
561
53856.3 54.6
49.5
43.9
37.8 37.7
78.6
74.1 75.4
10.0
30.0
50.0
70.0
90.0
-
300
600
900
2QFY09
3QFY09
4QFY09
1QFY10
2QFY10
3QFY10
4QFY10
1QFY11
2QFY11
Gross NPAs (` cr) Net NPAs (` cr) Provision coverage (%, RHS)
5. Dena Bank | 2QFY2011 Result Update
October 26, 2010 5
Exhibit 8: Trend in productivity
Source: Company, Angel Research
Capital infusion expected in 3QFY2011
During the quarter, Dena Bank’s CAR stood at 12.3%, with tier-I capital of 8.0%
(forming 65% of the total CAR). The bank’s CAR is expected to increase with the
likely capital infusion of `600cr in the form of preference capital by the
government in FY2011. Over FY2012–13, management expects to receive further
`700cr from the government by way of preference capital. The cost of this capital
is expected to be linked to the repo rate as per management indications.
Accordingly, we have assumed the cost of preference capital to be 7%. After the
proposed capital infusion, the bank's tier-I ratio will improve to 9.1% by
end-FY2011 from 8.2% in FY2010.
91
116
144
117
130
121
132
128
145
163
70
75
81
75
74
83
87
92
84
96
56.6 56.0
45.9
50.5 50.4
55.9
52.5
44.1 49.0
44.3
36.0
44.0
52.0
60.0
-
50
100
150
200
250
300
1QFY09
2QFY09
3QFY09
4QFY09
1QFY10
2QFY10
3QFY10
4QFY10
1QFY11
2QFY11
Staff expenses (` cr) Other opex (` cr) Cost-to-income ratio (%, RHS)
6. Dena Bank | 2QFY2011 Result Update
October 26, 2010 6
Investment Arguments
Structurally strong CASA
Dena Bank has maintained its CASA ratio at healthy 35%+ levels (FY2010) on
account of having higher concentration of its branches in rural and semi-urban
areas (mainly in Gujarat and Maharashtra), where the prosperity levels are
relatively high. Further, during 2QFY2011, the bank was able to increase the
CASA ratio to 39.1%. In the last two years, the bank has maintained a CASA
market share of 1.1% despite intense competition from the private banks. This
structural advantage is reflected in the bank's cost of funds at 5.9% in FY2010,
which is one of the lowest amongst its peers.
Capital infusion to enable further growth
Dena Bank's CAR at 12.3% comprising only 8.0% of tier-I capital is below optimum
levels (reflected in 22x leverage of the bank for FY2010). Moreover, the
government’s holding at 51% had prevented the bank from further diluting the
government stake. This constraint on raising equity for growth was an overhang on
the stock. However, the government has been reiterating its intention to infuse
capital in PSU banks. Consequently, Dena Bank is expected to receive `600cr over
the next three months. Post the capital infusion, the bank's tier-I will improve to
9.1% in FY2011 from 8.2% in FY2010, enabling it to grow its advances more-or-
less in line with peers in the medium term.
Lower provisioning to aid bottom-line growth
Dena Bank's gross and net NPAs stood at 2.3% and 1.5% respectively, in
2QFY2011, with cumulative restructured advances at `1,306cr (3.6% of loans). As
per a recent RBI circular, the bank's effective provision coverage, including
technically written-off portfolio, is 75.4% as against the mandatory 70%, due to
which an adjustment to book value for NPAs is not required. Further, this portfolio
is expected to yield outsized income from recoveries relative to peers. Given the
improving economic outlook, we believe lower incremental provisioning costs will
aid the bank in maintaining its profitability levels.
Outlook and Valuation
Dena Bank, with a strong CASA ratio of 39.1%, is better placed than peers to
protect its NIM in a rising interest rate environment. After the proposed capital
infusion, the bank's tier-I ratio will improve to 9.1% by end-FY2011 from 8.2% in
FY2010, and enable it to maintain its CAR well above 12% levels until FY2012. At
the CMP, the stock is trading at 6.5x FY2012E EPS of `21.3 and 1.2x FY2012E
ABV of `115.1. We maintain an Accumulate on the stock with a Target Price of
`150. We have assigned a target multiple of 1.3x FY2012E ABV, translating into
8.7% upside from current levels.
11. Dena Bank | 2QFY2011 Result Update
October 26, 2010 11
Research Team Tel: 022 - 4040 3800 E-mail: research@angeltrade.com Website: www.angeltrade.com
DISCLAIMER
This document is solely for the personal information of the recipient, and must not be singularly used as the basis of any investment
decision. Nothing in this document should be construed as investment or financial advice. Each recipient of this document should make
such investigations as they deem necessary to arrive at an independent evaluation of an investment in the securities of the companies
referred to in this document (including the merits and risks involved), and should consult their own advisors to determine the merits and
risks of such an investment.
Angel Broking Limited, its affiliates, directors, its proprietary trading and investment businesses may, from time to time, make
investment decisions that are inconsistent with or contradictory to the recommendations expressed herein. The views contained in this
document are those of the analyst, and the company may or may not subscribe to all the views expressed within.
Reports based on technical and derivative analysis center on studying charts of a stock's price movement, outstanding positions and
trading volume, as opposed to focusing on a company's fundamentals and, as such, may not match with a report on a company's
fundamentals.
The information in this document has been printed on the basis of publicly available information, internal data and other reliable
sources believed to be true, but we do not represent that it is accurate or complete and it should not be relied on as such, as this
document is for general guidance only. Angel Broking Limited or any of its affiliates/ group companies shall not be in any way
responsible for any loss or damage that may arise to any person from any inadvertent error in the information contained in this report.
Angel Broking Limited has not independently verified all the information contained within this document. Accordingly, we cannot testify,
nor make any representation or warranty, express or implied, to the accuracy, contents or data contained within this document. While
Angel Broking Limited endeavours to update on a reasonable basis the information discussed in this material, there may be regulatory,
compliance, or other reasons that prevent us from doing so.
This document is being supplied to you solely for your information, and its contents, information or data may not be reproduced,
redistributed or passed on, directly or indirectly.
Angel Broking Limited and its affiliates may seek to provide or have engaged in providing corporate finance, investment banking or
other advisory services in a merger or specific transaction to the companies referred to in this report, as on the date of this report or in
the past.
Neither Angel Broking Limited, nor its directors, employees or affiliates shall be liable for any loss or damage that may arise from or in
connection with the use of this information.
Note: Please refer to the important `Stock Holding Disclosure' report on the Angel website (Research Section). Also, please
refer to the latest update on respective stocks for the disclosure status in respect of those stocks. Angel Broking Limited and
its affiliates may have investment positions in the stocks recommended in this report.
Disclosure of Interest Statement Dena Bank
1. Analyst ownership of the stock No
2. Angel and its Group companies ownership of the stock Yes
3. Angel and its Group companies' Directors ownership of the stock No
4. Broking relationship with company covered No
Note: We have not considered any Exposure below ` 1 lakh for Angel, its Group companies and Directors.
Ratings (Returns): Buy (> 15%) Accumulate (5% to 15%) Neutral (-5 to 5%)
Reduce (-5% to 15%) Sell (< -15%)