( Jasmin ) Top VIP Escorts Service Dindigul 💧 7737669865 💧 by Dindigul Call G...
Market Outlook - July 26, 2010
1. Market Outlook
India Research
July 26, 2010
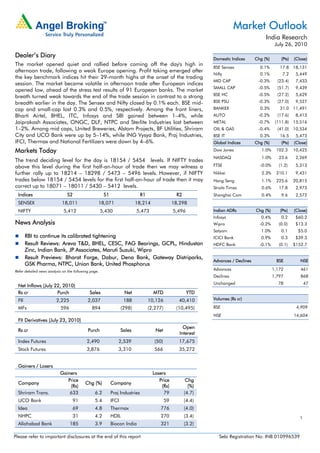
Dealer’s Diary Domestic Indices Chg (%) (Pts) (Close)
The market opened quiet and rallied before coming off the day's high in
BSE Sensex 0.1% 17.8 18,131
afternoon trade, following a weak Europe opening. Profit taking emerged after
Nifty 0.1% 7.2 5,449
the key benchmark indices hit their 29-month highs at the onset of the trading
MID CAP -0.3% (23.4) 7,433
session. The market became volatile in afternoon trade after European indices
SMALL CAP -0.5% (51.7) 9,439
opened low, ahead of the stress test results of 91 European banks. The market
breath turned weak towards the end of the trade session in contrast to a strong BSE HC -0.5% (27.2) 5,629
breadth earlier in the day. The Sensex and Nifty closed by 0.1% each. BSE mid- BSE PSU -0.3% (27.0) 9,527
cap and small-cap lost 0.3% and 0.5%, respectively. Among the front liners, BANKEX 0.3% 31.0 11,491
Bharti Airtel, BHEL, ITC, Infosys and SBI gained between 1–4%, while AUTO -0.2% (17.6) 8,413
Jaiprakash Associates, ONGC, DLF, NTPC and Sterlite Industries lost between METAL -0.7% (111.8) 15,516
1–2%. Among mid caps, United Breweries, Alstom Projects, BF Utilities, Shriram OIL & GAS -0.4% (41.0) 10,534
City and UCO Bank were up by 5–14%, while ING Vysya Bank, Praj Industries, BSE IT 0.3% 16.5 5,473
IFCI, Thermax and National Fertilizers were down by 4–6%. Global Indices Chg (%) (Pts) (Close)
Markets Today Dow Jones 1.0% 102.3 10,425
NASDAQ 1.0% 23.6 2,269
The trend deciding level for the day is 18154 / 5454 levels. If NIFTY trades
above this level during the first half-an-hour of trade then we may witness a FTSE -0.0% (1.2) 5,313
further rally up to 18214 – 18298 / 5473 – 5496 levels. However, if NIFTY Nikkei 2.3% 210.1 9,431
trades below 18154 / 5454 levels for the first half-an-hour of trade then it may Hang Seng 1.1% 225.6 20,815
correct up to 18071 – 18011 / 5430 – 5412 levels. Straits Times 0.6% 17.8 2,973
Indices S2 S1 R1 R2 Shanghai Com 0.4% 9.6 2,572
SENSEX 18,011 18,071 18,214 18,298
NIFTY 5,412 5,430 5,473 5,496 Indian ADRs Chg (%) (Pts) (Close)
Infosys 0.4% 0.2 $60.2
News Analysis Wipro -0.2% (0.0) $13.3
Satyam 1.0% 0.1 $5.0
RBI to continue its calibrated tightening ICICI Bank 0.9% 0.3 $39.3
Result Reviews: Areva T&D, BHEL, CESC, FAG Bearings, GCPL, Hindustan HDFC Bank -0.1% (0.1) $152.7
Zinc, Indian Bank, JP Associates, Maruti Suzuki, Wipro
Result Previews: Bharat Forge, Dabur, Dena Bank, Gateway Distriparks,
Advances / Declines BSE NSE
GSK Pharma, NTPC, Union Bank, United Phosphorus
Refer detailed news analysis on the following page.
Advances 1,172 461
Declines 1,797 868
Unchanged 78 47
Net Inflows (July 22, 2010)
Rs cr Purch Sales Net MTD YTD
FII 2,225 2,037 188 10,126 40,410 Volumes (Rs cr)
MFs 596 894 (298) (2,277) (10,495) BSE 4,909
NSE 14,604
FII Derivatives (July 23, 2010)
Open
Rs cr Purch Sales Net
Interest
Index Futures 2,490 2,539 (50) 17,675
Stock Futures 3,876 3,310 566 35,272
Gainers / Losers
Gainers Losers
Price Price Chg
Company Chg (%) Company
(Rs) (Rs) (%)
Shriram Trans. 633 6.2 Praj Industries 79 (4.7)
UCO Bank 91 5.4 IFCI 59 (4.4)
Idea 69 4.8 Thermax 776 (4.0)
NHPC 31 4.2 HDIL 270 (3.4) 1
Allahabad Bank 185 3.9 Biocon India 321 (3.2)
Please refer to important disclosures at the end of this report Sebi Registration No: INB 010996539
2. Market Outlook | India Research
RBI to continue its calibrated tightening
Signs of a revival in growth momentum are increasing, with IIP growth at 11.5% in May
2010. At the same time, food inflation (12.6% yoy) has taken the overall WPI in double
digits at 10.6%. We believe the engines of growth are clearly shifting from government-
driven consumption to risk capital-driven private consumption and investments. Hence, the
RBI’s priority is likely to be controlling inflation using monetary policy tools. Accordingly, we
expect the RBI to hike repo and reverse repo rates by 25bp each to 5.75% and 4.25%,
respectively. However, considering the current liquidity situation, we do not expect a CRR
hike in the coming policy.
Result Reviews-1QFY2011
Areva T&D-2QCY2010
Areva T&D India announced its results. The company posted top-line growth of 10.3% yoy
to Rs885.4cr (Rs802.4cr), which was below our estimates. On the operating front, the
company extended its weak performance reporting a sharp dip in EBITDA margin by
410bps to 9.2% (13.3%). Consequently, net profit for the quarter plunged by 35.6% yoy to
Rs32.2cr (Rs50.1cr). We maintain our Neutral recommendation on the stock.
BHEL
Bharat Heavy Electricals Ltd. (BHEL) came out with its results. Top line for the quarter grew
by 16% yoy to Rs6,480cr (Rs5597cr), which was below our estimates. Segment-wise, the
power segment posted revenue growth of 18% yoy to Rs5,400cr (Rs4,568cr), whereas the
industry segment grew by modest 11% to Rs1,476cr (Rs1,332cr). The bottom line
increased by a healthy 42% yoy to Rs667cr (Rs470cr). We maintain our Neutral
recommendation on the stock.
CESC
CESC registered 33.7% yoy growth in its standalone top line to Rs1,096cr, aided by a
10.9% yoy increase in sales volume to 2,321MU. Growth in sales volume was due to the
recent commissioning of the 250MW Budge-Budge plant and marginally higher PLFs in
Titagarh and southern plants. Growth in top line was also aided by higher tariff
Rs4.57/unit charged by the company in the Kolkata regulated area as against Rs3.91/unit
in 1QFY2010. However, the company's OPM declined by 119bp yoy to 23.7%. On the
bottom-line front, the company’s standalone net profit grew by a marginal 4.8% yoy to
Rs110cr. The per sq. ft. sales of the company’s retail subsidiary Spencers’ stood at Rs906
in June 2010, up by 23.1% on a yoy basis. Further, management has indicated that the
store EBITDA/sq. ft. for Spencers’ has turned positive in June 2010. We maintain a Buy
view on the stock with a target price of Rs460.
July 26, 2010 2
3. Market Outlook | India Research
FAG Bearing - 2QCY2010
FAG Bearing (FAG) recorded robust performance in 2QCY2010. FAG reported net sales
growth of 34.7% yoy to Rs273cr (Rs202cr), above our expectations of Rs244cr. This was
largely driven by a substantial jump in overall auto volume and sharp recovery in the
industrial bearing segment. EBITDA margins expanded by a substantial 364bp yoy to
19.1% (15.5%), basically due to the decrease in raw material costs by 558bp during the
quarter and better operating leverage. For 2QCY2010, FAG registered 81.6% yoy
increase in bottom line to Rs33.8cr (Rs18.6cr) largely on account of robust top-line growth
and substantial jump in operating performance. Further, higher other income and lower
tax rate aided robust net profit growth to a certain extent, which helped the company to
register NPM of 12.4% (9.2%).
We have revised our estimates upward: 1) ~9% upward revision in revenue to account
robust top-line growth in 2QCY2010, 2) higher OPM on better operating leverage and 3)
~30% revision in earnings. We believe that the company will register a CAGR of around
20% in net sales and 33% in net profit over CY2009–11E. We maintain Buy on the stock
with a target price of Rs931, at which it will trade at a multiple of 12x its earnings.
Godrej Consumer Products
Godrej Consumer (GCPL) reported strong top-line growth at 47% yoy to Rs643cr (Rs439cr)
driven largely by consolidation of recent acquisitions (Megasari, Tura, Issue and Argencos)
and remaining 51% consolidation of GHPL. Domestic business registered a growth of 35%
yoy to Rs457cr (Rs338cr) largely aided by six weeks consolidation of 100% GHPL revenue.
We estimate Soaps registered a ~7-9% yoy decline and Hair colours registered a ~2% yoy
decline during the quarter. International business stood at Rs186cr (Rs101cr) registering a
growth of 84% yoy aided by Rs83cr revenue from Megasari (consolidated for six weeks)
and Rs12cr revenue from Issue (consolidated for only 1 month). GCPL’s consolidated
earnings on a recurring basis registered a muted growth of 9% yoy to Rs76cr (Rs70cr),
despite strong top-line growth, impacted by margin contraction, 178% yoy spike in interest
costs to Rs10.5cr (Rs3.8cr), 62% yoy jump in depreciation to Rs8.4cr (Rs5.2cr) and 254bp
rise in tax rate. However, on a reported basis, earnings registered a growth of 67% yoy to
Rs116cr (Rs70cr) largely aided by Rs40cr exceptional income on account of compensation
received by GHPL from Sara Lee International on termination of manufacturing and
distribution license agreement. At the operating front, GCPL delivered a margin
contraction of 117bp yoy on account of 319bp contraction in gross margins. Nonetheless,
58bp drop in other expenses and 168b drop in staff costs arrested further margin decline.
GCPL has completed consolidation of all its recent acquisitions during the quarter (except
for Argencos which was completed on 8th July, 2010). We estimate the total cost of these
acquisitions at ~Rs2,550cr and the company has funded the same via – 1) US$350mn of
debt, 2) Rs700cr of NCDs , 3) Rs531cr via QIP leading to ~5% dilution (to be used to
repay NCDs) and 4) internal accruals and cash. The management has constantly re-
iterated that all recent acquisitions have been EPS accretive and debt-equity ratio is to be
maintained at comfortable 1:1 level. We believe the acquisitions are in-line with GCPL’s
3x3 strategy and have leapfrogged the company into a truly global presence. We maintain
Accumulate on the stock (Target price under review, to be decided post Concall with the
management today).
July 26, 2010 3
4. Market Outlook | India Research
Hindustan Zinc
Hindustan Zinc’s 1QFY2011 net revenue grew by 29.0% to Rs1,951cr, below our
estimates of Rs2,392cr. Deviation in the top line was on account of 1) low-grade
production at Rampura Agucha mine, 2) production impacted due to water shortage and
3) absence of concentrate sales. Although zinc sales volumes were higher 19.2% yoy to
164,445 tonnes, lead sales volumes were lower by 6.6% yoy to 14,075 tonnes. However,
higher zinc (up 34.3% yoy) and lead (up 28.5%) realizations partially negated the negative
impact of lower production. Despite strong top-line growth, operating margins were flat
yoy at 52.4%, mainly due to higher 1) mining and manufacturing costs (increased
stripping, coal and coke costs), 2) consumption of stores and spares and 3) staff cost
(impact of wage settlement). Consequently, EBITDA came in at Rs1,022cr, higher by 30.6%
yoy. Net profit increased by 23.9% yoy to Rs891cr, below our estimates of Rs1,158cr. At
the CMP of Rs988, the stock is trading at 5.6x FY2011E and 3.5x FY2012E EV/EBITDA. We
maintain a Buy view on the stock with a revised target price of Rs1,227, valuing the stock
at 6x FY2012E EV/EBITDA.
Indian Bank
Indian Bank has announced its results, wherein it has registered net profit growth of 11.0%
on a yoy basis to Rs368cr, which is better than our estimate of Rs342cr mainly on account
of better-than-estimated non-interest income and lower effective tax rate. Operating
performance came on expected lines, but a severe pressure on asset quality was the key
highlight of the result. NII increased 25.6% yoy but was down marginally by 0.8% qoq to
Rs927cr. Non-interest income stood at Rs355cr, up 21.4% yoy. Operating costs declined
2.9% yoy but were up 25.3% qoq to Rs444cr. The cost-to-income ratio stood at 34.7%,
lower than its eight-quarter average of 39.1%. The bank provided Rs8.2cr towards
additional gratuity-related liability.
In line with our view on select PSU banks, Indian Bank’s asset quality deteriorated
substantially during the quarter. Gross NPA increased by 93.8% sequentially to Rs988cr,
while net NPA stood at Rs511cr compared to Rs145cr (a sharp rise of 252.9%) in
4QFY2010. The bank’s gross and net NPA ratios stood at 1.5% (0.8% in 4QFY2010) and
0.8% (0.2% in 4QFY2010), respectively. The provision coverage ratio (without tech write-
offs) declined to 48.3% compared to 71.6% in 4QFY2010 and 56.6% in 1QFY2010. The
bank’s CAR decreased to 12.5% as compared to 12.7% in 4QFY2010 and 14.2% in
1QFY2010.
At the CMP, the stock is trading at 1.2x FY2012E ABV. Since the listing in March 2007, the
stock has traded in the range of 0.9–1.2x P/ABV, with an average multiple of 0.9x. In a
rising interest rate environment, the bank’s NIM is not sustainable at the current high
levels, in our view, given a relatively lower CASA of 32%. We have a Neutral rating on the
stock.
July 26, 2010 4
5. Market Outlook | India Research
JP Associates
JAL reported a robust top-line growth of 51.8% yoy to Rs3,215cr (Rs2,117cr), significantly
ahead of our estimates of ~31.7% growth, aided by a strong 52.0% and 36.8% growth in
cement and construction revenue to Rs1,442cr (Rs948cr) and Rs1,437cr (Rs1051cr),
respectively. JAL’s recurring earnings for the quarter declined by 57.6% to Rs105cr, which
was way below our expectations of Rs229cr. This was mainly on account unexpected
plunge in margins for both the segments (cement and construction). We were expecting
margins to be under pressure for the cement segment but the numbers were way below
our expectations mainly on account competitive pressures due to oversupply in markets.
Further, the house construction segment also faced margin pressure due to stoppage of
work at Baglihar II and Srisailam canal projects. Against this backdrop, we are factoring
margins to be under pressure for the coming quarters. JAL is one of the leading companies
in the infra space spread across verticals of Cement, Construction, Power, Real Estate and
Hospitality and a major beneficiary of the ongoing thrust in infrastructure development. We
believe that JAL would be one of the fastest growing companies and would post a top-line
and bottom-line CAGRs of 33.2% and 43.6%, respectively, over
FY2010-12E. We have valued JAL on an SOTP basis and maintain a buy with a target
price of Rs174.
Maruti Suzuki
For 1QFY2011, Maruti registered 27% yoy growth in net sales to Rs8,232cr (Rs6,493cr),
below our expectations. Volumes for the quarter increased 25% yoy, while realisations
increased by meager 2% for the quarter. Average realisations, however, declined
sequentially (qoq) by 1%, largely owing to currency (Euro) impact coming on export
revenue, which stood at Rs1,130cr (Rs1,283cr in 4QFY2010), while average export
realisation declined by almost 8.4% qoq to Rs2.79lakh (Rs3.05lakh in 4QFY2010).
On the operating front, EBITDA margins came in substantially lower than our expectations
owing to higher raw material costs (increased by 150bp yoy) and a substantial increase in
royalty (up 230bp yoy) to 5.9% of net sales (includes one-time arrears of FY2010
amounting to 0.8% of net sales). Royalty charges increased substantially due to the
increase in sales of K-series engine models and amendments in the various royalty
agreements the company entered with Suzuki Motor Corporation, resulting in additional
royalty expense of Rs188.7cr, including Rs65.2cr for the period: December 16, 2009, to
March 31, 2010. Net profit declined to Rs465cr, a dip of 20% yoy and below our
expectations. Lower export realisations, substantial contraction in EBITDA margins, higher
depreciation and lower-than-expected other operating income led to a substantial decline
in net profit yoy and qoq.
Owing to the lower-than-expected 1QFY2011 performance, we will be revising our
estimates downward by 11–12%, which would consequently lead to about 11–12%
downward revision in our target price. The stock rating is under review.
July 26, 2010 5
6. Market Outlook | India Research
Wipro
Wipro reported strong 1QFY2011 performance by witnessing 3.1% qoq (12.6% yoy) top-
line growth in rupee terms backed by 4.6% qoq (14% yoy) growth in IT services revenue.
The IT services topline was driven by 4.7% qoq growth in volumes despite of decline in
price realisations. In US Dollar terms, the company posted IT services revenue of US$
1204mn as against guidance given in the range of US$1,190mn-1,215mn. The EBIDTA
margins expanded by 92bp qoq (196bp yoy) despite of higher employee cost incurred and
decline in pricing. This was mainly due to a positive impact of 60bp on account of effective
hedges, which contained the adverse currency impact on the EBIDTA margins during the
quarter. Though the other income declined by 26.9% qoq (up 35.8% yoy) and the interest
cost increased by 70% qoq, the effective tax rate was down from 20% in 4QFY10 to 15%
in 1QFY2011. Thus, on net level, the company witnessed 9% qoq (30.5% yoy) increase in
bottom line backed by strong operational efficiency. Despite challenging macro-economic
indicators, the company’s management has given strong revenue guidance for the IT
services segment in 2QFY2011, which is expected to be in the range of US $1,253mn-
1,277mn, sequential growth of 4.1-6.1%. Hence, we maintain Accumulate on the stock.
Result Previews-1QFY2011
Bharat Forge
Bharat Forge is slated to announce its results today. The company is expected to post 59%
yoy growth in revenue to Rs559cr for the quarter. On the operating front, the company is
expected to post a 355bp yoy improvement in operating profit margin to 24.4%. Net profit
is expected to increase substantially by 239% yoy to Rs53.6cr. The stock rating is under
review.
Dabur India
Dabur is slated to announce its numbers. For the quarter, we expect robust consolidated
top-line growth of 16.5% yoy to Rs865cr. The company completed the acquisition of Fem
Care Pharma with itself during the quarter and has allotted Dabur’s shares to Fem Care
Pharma’s shareholders in the ratio of 5:1. Bottom line is expected to register growth of
26.3% yoy to Rs115.4cr, aided by top-line growth and margin expansion of 839bp yoy.
We maintain a Neutral view on the stock.
Dena Bank
Dena Bank is slated to declare its results. The bank is expected to post NII growth of 18.6%
yoy to Rs297cr. NIM is expected to dip by around 25bp on account of change in the
method of calculating interest on savings account balances. Growth in operating income is
expected to be flat at around 4%. Net profit growth is also expected to be muted at 4% yoy
to Rs120cr. We will be closely watching slippages from the bank’s restructured loans,
which stand at Rs1,330cr—forming 3.8% of advances (51.1% of the net worth). At the
CMP, the stock is trading at attractive valuations of 4.6x FY2012E EPS of Rs21.9 and 0.8x
FY2012E adjusted book value of Rs120.6. We have an Accumulate rating on the stock with
a target price of Rs115.
July 26, 2010 6
7. Market Outlook | India Research
Gateway Distriparks
Gateway Distriparks Limited (GDL) is scheduled to announce its results today. We expect
GDL to post strong growth of 14.7% yoy in its top line to Rs143cr for the quarter led by
better volumes from CFS as well as rail segment on account of improving Exim visibility
and low base. OPMs are expected to remain flat with marginal decline of 26bp at 26.5%
as rail business has shown signs of improvement. We expect healthy contribution from
other income on account of unutilised amount from Blackstone deal being invested for a
short duration. Consequently, net profit is estimated to grow by 15.6% yoy to Rs19.2cr. At
the CMP of Rs116, the stock is trading at 9.6x its FY2012E earnings of Rs12.1 per share.
We continue to recommend Buy on the stock with a target price of Rs150.
GlaxoSmithKline Pharmaceuticals-2QCY2010
GlaxoSmithKline Pharmaceuticals (Glaxo) is expected to announce its 2QCY2010 results.
Glaxo is expected to post 15.3% growth on the top-line front to Rs527.5cr (Rs457.4cr). The
company is expected to report flat OPM at 35.8%, with net profit growing 16.9% to
Rs145.3cr (Rs124.4cr). The stock is currently trading at 31.7x CY2010E and 28.0x
CY2011E earnings. We recommend Sell with a target price of Rs1,700.
NTPC
NTPC is expected to announce its results. We expect the company’s top line to grow 9.2%
yoy to Rs13,110cr, aided by 5.0% volume growth. The company's operating profit is
expected to increase by 8.5% yoy to Rs3,445cr. We estimate NTPC's net profit to grow
moderately by 3.9% yoy to Rs2,279cr on account of high depreciation costs. We maintain
Accumulate on the stock with a target price of Rs230.
Union Bank of India
Union Bank of India is scheduled to announce its results. We expect the bank to post
robust growth of 65.7% in NII on a yoy basis to Rs1,329cr and a marginal dip of 4.8% on
a sequential basis. However, the bank’s NIM is expected to decline sequentially by 30bp
during 1QFY2011 on account of interest payment on savings accounts on a daily basis.
The pre-provision profit of the bank is expected to go up by healthy 37.5% on a yoy basis.
Net profit is expected to go up by 22.7% on a yoy basis to Rs542cr. In line with our view
on select PSU banks, where we predicted pressure on asset quality to continue during
1QFY2011, Indian Bank and PNB have actually witnessed asset quality pressure in
1QFY2011. Hence, we will be closely watching Union Bank’s asset quality, though the
bank is relatively less exposed to such risks in our opinion. At the CMP, the stock is trading
at 1.3x FY2012E ABV. We have a Neutral rating on the stock.
United Phosphorus
United Phosphorus is slated to announce its numbers. For the quarter, we expect
consolidated top-line growth of 10% yoy to Rs1801cr. Bottom line is expected to register
growth of 5% yoy to Rs185cr. We maintain our Buy rating on the stock with a target price
of Rs228.
July 26, 2010 7
8. Market Outlook | India Research
Economic and Political News
Indian telecom user base up ~18mn in June 2010
SEZ units cannot avail IT exemption on DTA sale: MOC
Rs2,245cr FDI proposals approved
Corporate News
LSE approves de-admission of Gateway Distripark’s GDR from trading
RPG flagship eyes Rs2,000cr solar project in Rajasthan
SBI raises US $1bn in overseas bonds issue
Wockhardt gets US FDA approval for generic version of ToprolXL
Source: Economic Times, Business Standard, Business Line, Financial Express, Mint
Events for the day
Bharat Forge Results
Dabur India Results
Dena Bank Results
Gateway Distriparks Results
GlaxoSmithKline Pharma Results
KEI Inds Results
NELCO Results
NTPC Results
Sterlite Industries Results
TajGVK Hotels Results
Union Bank Results
United Phos Results
July 26, 2010 8
9. Market Outlook | India Research
Research Team Tel: 022-4040 3800 E-mail: research@angeltrade.com Website: www.angeltrade.com
DISCLAIMER
This document is solely for the personal information of the recipient, and must not be singularly used as the basis of any investment
decision. Nothing in this document should be construed as investment or financial advice. Each recipient of this document should make
such investigations as they deem necessary to arrive at an independent evaluation of an investment in the securities of the companies
referred to in this document (including the merits and risks involved), and should consult their own advisors to determine the merits and
risks of such an investment.
Angel Broking Limited, its affiliates, directors, its proprietary trading and investment businesses may, from time to time, make investment
decisions that are inconsistent with or contradictory to the recommendations expressed herein. The views contained in this document are
those of the analyst, and the company may or may not subscribe to all the views expressed within.
Reports based on technical and derivative analysis center on studying charts of a stock's price movement, outstanding positions and
trading volume, as opposed to focusing on a company's fundamentals and, as such, may not match with a report on a company's
fundamentals.
The information in this document has been printed on the basis of publicly available information, internal data and other reliable sources
believed to be true, but we do not represent that it is accurate or complete and it should not be relied on as such, as this document is for
general guidance only. Angel Broking or any of its affiliates/ group companies shall not be in any way responsible for any loss or
damage that may arise to any person from any inadvertent error in the information contained in this report. Angel Broking Limited has
not independently verified all the information contained within this document. Accordingly, we cannot testify, nor make any representation
or warranty, express or implied, to the accuracy, contents or data contained within this document. While Angel Broking Limited
endeavours to update on a reasonable basis the information discussed in this material, there may be regulatory, compliance, or other
reasons that prevent us from doing so.
This document is being supplied to you solely for your information, and its contents, information or data may not be reproduced,
redistributed or passed on, directly or indirectly.
Angel Broking Limited and its affiliates may seek to provide or have engaged in providing corporate finance, investment banking or other
advisory services in a merger or specific transaction to the companies referred to in this report, as on the date of this report or in the past.
Neither Angel Broking Limited, nor its directors, employees or affiliates shall be liable for any loss or damage that may arise from or in
connection with the use of this information.
Note: Please refer to the important `Stock Holding Disclosure' report on the Angel website (Research Section).
Address: Acme Plaza, ‘A’ Wing, 3rd Floor, M.V. Road, Opp. Sangam Cinema, Andheri (E), Mumbai - 400 059.
Tel : (022) 3952 4568 / 4040 3800
Angel Broking Ltd: BSE Sebi Regn No : INB 010996539 / CDSL Regn No: IN - DP - CDSL - 234 - 2004 / PMS Regn Code: PM/INP000001546
Angel Capital & Debt Market Ltd: INB 231279838 / NSE FNO: INF 231279838 / NSE Member code -12798 Angel Commodities Broking (P) Ltd: MCX Member ID: 12685 / FMC Regn No: MCX / TCM /
CORP / 0037 NCDEX : Member ID 00220 / FMC Regn No: NCDEX / TCM / CORP / 0302
July 26, 2010 9