Credit Corp - turnaround in performance
•
1 like•174 views

Analysing the turnaround of Credit Corp

Recommended
More Related Content
What's hot
What's hot (17)
Viewers also liked
Viewers also liked (20)
Similar to Credit Corp - turnaround in performance
Similar to Credit Corp - turnaround in performance (20)
More from George Gabriel
More from George Gabriel (20)
Recently uploaded
Recently uploaded (20)
Credit Corp - turnaround in performance
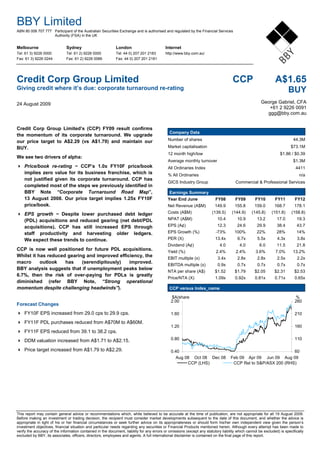
- 1. BBY Limited ABN 80 006 707 777 Participant of the Australian Securities Exchange and is authorised and regulated by the Financial Services Authority (FSA) in the UK Melbourne Sydney London Internet Tel: 61 3) 9226 0000 Tel: 61 2) 9226 0000 Tel: 44 0) 207 201 2183 http://www.bby.com.au/ Fax: 61 3) 9226 0244 Fax: 61 2) 9226 0066 Fax: 44 0) 207 201 2181 b This report may contain general advice or recommendations which, while believed to be accurate at the time of publication, are not appropriate for all 19 August 2009. Before making an investment or trading decision, the recipient must consider market developments subsequent to the date of this document, and whether the advice is appropriate in light of his or her financial circumstances or seek further advice on its appropriateness or should form his/her own independent view given the person’s investment objectives, financial situation and particular needs regarding any securities or Financial Products mentioned herein. Although every attempt has been made to verify the accuracy of the information contained in the document, liability for any errors or omissions (except any statutory liability which cannot be excluded) is specifically excluded by BBY, its associates, officers, directors, employees and agents. A full international disclaimer is contained on the final page of this report. Credit Corp Group Limited Giving credit where it’s due: corporate turnaround re-rating CCP A$1.65 BUY 24 August 2009 S&P/ASX 200 18 August 2009 XJO George Gabriel, CFA +61 2 9226 0091 ggg@bby.com.au Credit Corp Group Limited’s (CCP) FY09 result confirms the momentum of its corporate turnaround. We upgrade our price target to A$2.29 (vs A$1.79) and maintain our BUY. We see two drivers of alpha: Price/book re-rating − CCP’s 1.0x FY10F price/book implies zero value for its business franchise, which is not justified given its corporate turnaround. CCP has completed most of the steps we previously identified in BBY Note “Corporate Turnaround Road Map”, 13 August 2008. Our price target implies 1.25x FY10F price/book. EPS growth − Despite lower purchased debt ledger (PDL) acquisitions and reduced gearing (net debt/PDL acquisitions), CCP has still increased EPS through staff productivity and harvesting older ledgers. We expect these trends to continue. CCP is now well positioned for future PDL acquisitions. Whilst it has reduced gearing and improved efficiency, the macro outlook has (serendipitously) improved. BBY analysis suggests that if unemployment peaks below 6.7%, then the risk of over-paying for PDLs is greatly diminished (refer BBY Note, “Strong operational momentum despite challenging headwinds”). Forecast Changes FY10F EPS increased from 29.0 cps to 29.9 cps. FY11F PDL purchases reduced from A$70M to A$60M. FY11F EPS reduced from 39.1 to 38.2 cps. DDM valuation increased from A$1.71 to A$2.15. Price target increased from A$1.79 to A$2.29. Company Data Number of shares 44.3M Market capitalisation $73.1M 12 month high/low $1.86 / $0.39 Average monthly turnover $1.3M All Ordinaries Index 4411 % All Ordinaries n/a GICS Industry Group Commercial & Professional Services Earnings Summary Year End June FY08 FY09 FY10 FY11 FY12 Net Revenue (A$M) 149.9 155.8 159.0 168.7 178.1 Costs (A$M) (139.5) (144.9) (145.8) (151.8) (158.8) NPAT (A$M) 10.4 10.9 13.2 17.0 19.3 EPS (A¢) 12.3 24.6 29.9 38.4 43.7 EPS Growth (%) -73% 100% 22% 28% 14% PER (X) 13.4x 6.7x 5.5x 4.3x 3.8x Dividend (A¢) 4.0 4.0 6.0 11.5 21.8 Yield (%) 2.4% 2.4% 3.6% 7.0% 13.2% EBIT multiple (x) 3.4x 2.8x 2.8x 2.5x 2.2x EBITDA multiple (x) 0.9x 0.7x 0.7x 0.7x 0.7x NTA per share (A$) $1.52 $1.79 $2.05 $2.31 $2.53 Price/NTA (X) 1.09x 0.92x 0.81x 0.71x 0.65x CCP versus Index_name 0.40 0.80 1.20 1.60 2.00 Aug 08 Oct 08 Dec 08 Feb 09 Apr 09 Jun 09 Aug 09 $A/share 60 110 160 210 260 % CCP (LHS) CCP Rel to S&P/ASX 200 (RHS)
- 2. b BBY Limited 24 August 2009 2 CREDIT CORP GROUP LIMITED Financial Summary Credit Corporation Limited 1.65$ Income Statement (A$'000) 2008A 2009F 2010F 2011F 2012F Cash Flow (A$000) 2008A 2009F 2010F 2011F 2012F Total Revenue 149,867 155,800 158,998 168,735 178,123 Revenue 149,867 155,800 158,998 168,735 178,123 Employee Expenses (40,985) (35,009) (36,571) (38,605) (40,165) Less cash Costs (70,414) (68,450) (68,501) (70,538) (74,422) Occupancy Costs (8,392) (7,635) (7,807) (8,283) (8,787) Other Non-Cash Adjustments 2,037 (5,264) (5,719) (8,505) (8,962) Ledger Amortisation (59,634) (70,181) (70,364) (73,216) (75,946) Gross op. cash flow 81,490 82,086 84,778 89,693 94,739 Depreciation (2,282) (1,482) (1,212) (842) (674) Portfolio Purchases (79,673) (36,740) (60,000) (80,000) (100,000) Collection Costs (11,442) (12,617) (14,246) (15,119) (15,960) Other Investments (1,975) (277) (477) (506) (534) Other Costs (5,893) (2,462) (2,869) (3,043) (3,229) Investment Cash Flow (81,648) (37,017) (60,477) (80,506) (100,534) EBIT 21,239 26,414 25,928 29,627 33,362 Debt Changes 2299 (46000) 3675 (841) 12082 Interest (12,040) (10,727) (7,008) (5,487) (6,281) Share issue Proceeds 2070 447 0 0 0 Profit Before Tax 9,199 15,687 18,920 24,139 27,081 Dividends (6421) (1690) (2649) (10138) (11374) Tax (3,838) (4,825) (5,676) (7,242) (8,124) Financing cash Flows (2,052) (47,243) 1,027 (10,980) 708 Net Profit After Tax 5,361 10,862 13,244 16,897 18,957 Net cash Flows (2,210) (2,174) 25,327 (1,794) (5,087) Significant Items 5,000 0 0 0 0 Adjusted Net Profit After Tax 10,361 10,862 13,244 16,897 18,957 Amortisation (A$000) 2008A 2009F 2010F 2011F 2012F Weighted avge shares on issue (M) 44 44 44 44 44 Ledger WDV balance 203,103 170,165 160,956 167,740 191,794 EPS (cps) 12.3 24.6 29.9 38.2 42.8 P&L Charge (59,634) (70,181) (70,364) (73,216) (75,946) EPS growth on pcp -73% 100% 22% 28% 12% Amort Avge. Of WDV 29% 41% 44% 44% 40% Dividends (cps) 4 4 6 23 26 Franking 100 100 100 100 100 Debt Analysis (A$'000) 2008A 2009F 2010F 2011F 2012F Cash dividend 2.4% 3.6% 13.9% 15.6% Ledger WDV 203,103 170,165 160,956 167,740 191,794 Operating Spreads 2008A 2009F 2010F 2011F 2012F Est. Debt Balance 120,000 81,830 85,505 84,664 96,746 Total Cost/$ Revenue 96% 93% 92% 90% 89% Debt/ Ledger WDV (%) 59% 48% 53% 50% 50% Cash Cost/$ Revenue 52% 47% 47% 46% 46% Net Profit Margin 3.6% 7.0% 8.3% 10.0% 10.6% Op cash flow/interest (x) 6.8x 7.7x 12.1x 16.3x 15.1x Pre-Tax ROTA 4.2% 8.8% 9.7% 12.1% 12.4% ROE 8.1% 13.8% 14.6% 17.4% 18.1% Valuation Ratios (x) 2008A 2009F 2010F 2011F 2012F P/E Multiple 13.43x 6.70x 5.51x 4.32x 3.85x Balance Sheet (A$'000) 2008A 2009F 2010F 2011F 2012F Price/operating cash flow 0.88x 0.89x 0.86x 0.81x 0.77x Cash 2,441 651 25,978 24,185 19,097 Price to Book Value 1.09x 0.92x 0.81x 0.75x 0.70x Trade Receivables 6,662 1,452 1,504 1,588 1,698 Price to NTA 1.09x 0.92x 0.81x 0.75x 0.70x Other Current Assets 123 416 416 416 416 EBITDA Multiple 0.87x 0.74x 0.75x 0.70x 0.66x Current Ledger Assets 61,935 63,265 60,000 80,000 100,000 EBIT Multiple 3.39x 2.76x 2.82x 2.46x 2.19x Total Current Assets 71,161 65,784 87,898 106,188 121,211 Trade Receivables 0 0 0 0 0 Valuation (A$ / Share) 2009F 2010F 2011F 2012F Ledgers at Cost 370,477 407,961 422,185 468,785 474,485 Current share price $1.65 Less Prov. For Amortisation (167,374) (237,796) (261,229) (301,045) (282,691) Less Current Portion (61,935) (63,265) (60,000) (80,000) (100,000) 1. DDM Valuation Net Non-Current Ledger WDV 141,168 106,900 100,956 87,740 91,794 Estimated cost of equity % Fixed Assets Net 2,988 2,238 1,503 1,167 1,027 Assumed terminal value growth rate 3.0% Intangibles 2,090 1,520 1,520 1,520 1,520 NPV of Dividends $2.15 Deferred Tax 1,442 2,736 2,736 2,736 2,736 Price target discount to NPV 0% Total Non-Current Assets 147,688 113,394 106,715 93,163 97,077 DDM-based price target $2.15 Total Assets 218,849 179,178 194,613 199,351 218,288 Trade and Other Payables 13,015 7,210 8,434 8,922 9,508 2. Book value Payables Under Sales Contracts 1,064 1,103 1,103 1,103 1,103 Current tax Liability 0 727 727 727 727 Price/book value target (x) 1.25x 1.25x 1.25x 1.25x Short term provisions 2,455 1,746 1,746 1,746 1,746 Price/book value target implied price $2.10 $2.44 $2.63 $2.84 Interest Bearing Liabilities 7,376 52 52 52 52 Target book value $2.44 Total Current Liabilities 23,910 10,838 12,062 12,550 13,136 Financial liabilities 120,000 81,830 85,505 84,664 96,746 Price target (average of NPV and FY10F book value) $2.29 Long term provisions 65 87 63 63 63 Premium/(discount) to current share price 38.9% Deferred Tax Liabilities 8,622 7,626 6,435 4,768 3,454 Dividend yield 2.4% Total Liabilities 152,597 100,381 104,066 102,045 113,399 Total 12-mth return 41.3% Net Assets 66,252 78,797 90,547 97,306 104,889 BBY recommendation BUY Net assets per share $1.52 $1.79 $2.05 $2.20 $2.37 PE ratio 6.7x 5.5x 4.3x 3.9x Implied PE of price target 9.9x 8.1x 6.4x 5.7x PEG ratio 6.7x 0.3x 0.2x 0.5x Source: Company Reports, BBY Source: BBY, Company Reports
- 3. b BBY Limited 24 August 2009 3 CREDIT CORP GROUP LIMITED Outlook We expect alpha to be driven by: (i) price/book re-rating; and (ii) continued operating efficiency. CCP has executed most of the turnaround steps we previously identified in BBY’s “Corporate Turnaround ROAD MAP”, 13 August 2008 (litigation risk remains). Despite reduced gearing and lower purchased debt ledger (PDL) acquisitions, CCP has managed to drive increased EPS through: (i) Staff productivity (staff revenue/hour increased from A$207 FY08 median to A$222 FY09); and (ii) Harvesting older ledgers (50% 4Q revenue from 2 year+ old PDLs, vs 14% in 1Q07). Charts 1 and 2. CCP is now well positioned for future PDL acquisitions. Whilst de-leveraging and improving core operations, the macro outlook has (serendipitously) improved such that the risk of overpaying for PDLs is greatly ameliorated. We previously concluded that if this cycle’s peak unemployment is less than 6.7%, then PDL prices are currently at about fair value, (refer BBY Note, “Strong operational momentum despite challenging headwinds”). Henceforth, we expect alpha to be driven by: (i) continued price/book re-rating; and (ii) ongoing operating efficiency. We analyse price/book rating and the FY09 result below. Table 1 below summarises the CCP investment case. TABLE 1: SUMMARY INVESTMENT CASE BULL CASE BEAR CASE Price-value discount. Current trading price implies: - - 1.0x FY10 price/book; and - 6.0x FY10F PE. High DCF sensitivity to total expected collection (TEC) multiple. Corporate turnaround momentum – - de-leveraging balance sheet; - operational momentum: (i) EPS up 83%, despite PDL acquisitions falling 51.5%; and (ii) Staff revenue/hour up from FY08 A$207 median to FY09 A$222. - New Board and management have driven the turnaround. Litigation risk. This appears mitigated by: (i) CCP’s resolve to defend its position; and (ii) possibly insured. PDL acquisition risks diminishing - with improved unemployment outlook. Refer BBY Note 15 July 09 for detailed analysis of unemployment vs PDL purchasing risks, “Strong operational momentum despite challenging headwinds”. Increasing annuity income (via payment arrangements). This has increased from 45% in Dec 07 to 65% in June 09. Source: BBY
- 4. b BBY Limited 24 August 2009 4 CREDIT CORP GROUP LIMITED CHART 1: EPS VS PDL ACQUISITIONS - 20 40 60 80 100 120 140 2003 2004 2005 2006 2007 2008 2009 A$M 0 5 10 15 20 25 30 35 40 45 50 cps PDL Acquistions (A$M) LHS Diluted EPS (cps) RHS Source: BBY, CCP CHART 2: NET DEBT/PDL CARRYING VALUE (%) - 20 40 60 80 100 120 140 160 2003 2004 2005 2006 2007 2008 2009 A$M 0 10 20 30 40 50 60 70 80 % PDL Acquistions (A$M) LHS Net Debt (A$M) LHS Net Debt/PDL carrying value (%) RHS Source: BBY, CCP Relative Value Analysis We expect continued price/book re-rating. We expect continued price/book re-rating because: (i) the current 1.0x is not justified as it attributes zero value to CCP’s business franchise; and (ii) the re-rating of major financial stocks will eventually flow through to second line financials like CCP. Major banks provide a valuation benchmark (ceiling) for CCP. Australian major bank stocks provide a relative valuation benchmark for CCP because: (i) Both are financial services businesses; (ii) CCP acquires its debt ledgers from major banks; and (iii) The bad debt cycle/ rising unemployment is a key risk for both. Major bank stocks currently trade at an average of 1.7x FY10F price/book. CCP should trade at a discount to the banks given CCP’s characteristics: Price taker in a competitive market − This compares to the major banks’ oligopoly and pricing power. Low earnings diversification − CCP has one main revenue line, whereas major banks have seven to eight.
- 5. b BBY Limited 24 August 2009 5 CREDIT CORP GROUP LIMITED Relative scale. Low annuity income/earnings visibility − Whilst major banks generate annuity-style revenues from annual fee income, wealth management, insurance and mortgages/long-dated debt facilities, CCP’s earnings are much less transparent, particularly given the high DCF valuation sensitivity to the total expected collection (TEC) multiple. We believe CCP should trade at 1.2-1.3x FY10F price/book. We believe that CCP should trade at 1.2-1.3x price/book given: (i) Current major bank sector average of 1.7x. (ii) Expected further re-rating of major financial stocks. Major bank stocks generally trade at a discount to their historic price/book range during the bad debt cycle. (For a more detailed assessment of major banks historic price/book trading ranges, refer BBY Note, 15 Apr 09, “Price v Value in bank sector”). (iii) ROE is improving. Stabilisation of the operating platform warrants some value attribution for the CCP business franchise, and arguably a reduced cost of equity capital. 1.3x price/book requires cost of equity/ROE combinations in the range of 15% Ke/19.5% ROE to 17.5% Ke/22.8% ROE. BBY’s forecasts ROE to reach 24.9% in FY13F. Tables 2 and 3. TABLE 2: PRICE/BOOK VS INVESTORS’ MINIMUM REQUIRED RETURN Investors' minimum required return (%) 10 15 16 17 17.50 18 19 20 Sustainable ROE (%) 20 20 20 20 20 20 20 20 Implied price/book 2.0x 1.33x 1.25x 1.18x 1.14x 1.11x 1.05x 1.0x Source: BBY TABLE 3: ROE FORECASTS 2009A 2010F 2011F 2012F 2013F ROE 14.6% 15.9% 17.8% 18.4% 21.2% Source: BBY FY09 Result Summary CCP’s FY09 result was overall in line with BBY forecasts. Table 4 summarises the results, FY10F guidance and BBY FY10F. Table 4 summarises the investment case. TABLE 4: FY09 RESULTS FY09 result Actual FY08 Actual FY09 BBY FY09F FY09 vs FY08 FY10 guidance BBY FY10F PDL acquisitions A$76.7M A$37.2M A$35.3M -51.5% A$45-60M A$60M Revenue A$149.9M A$155.8M A$151.7M 3.9% - A$159.0M- NPAT A$5.8M A$10.9M A$10.6M 87.9% - A$12.9M EPS (basic) 13.27 cps 24.26 cps 24.0cps 82.8% 25-29cps 29.3cps ROE 8.5% 14.6% 14.2% 71.8% - 15.9% Dividend 4 cps 4 cps 5 cps - 5-6 cps (20% DPR policy) 6 cps Source: BBY, CCP
- 6. b BBY Limited 24 August 2009 6 CREDIT CORP GROUP LIMITED This report has been prepared and issued (in Australia) by BBY Limited (ABN 80 006 707 777/AFS Licence No. 238095) (BBY) and is subject to the disclosures and restrictions set out below. Analyst Certification: The research analyst(s) identified on the cover of this report individually certify that in respect of each security or issuer that the research analyst covers that: this report accurately reflects his or her personal views about any and all of the subject issuer(s) or securities; and no part of the research analyst’s compensation was, is, or will be directly or indirectly related to the specific recommendation(s) or views expressed by the research analyst(s) in this report. Legal Entity Disclosures Australia: BBY is Market Participant with the ASX and regulated by ASIC. U.K. BBY is authorised and regulated by the Financial Services Authority (FSA) Registration No. 146367. U.A.E BBY (Dubai) Limited is authorised and regulated by the Dubai Financial Services Authority, Licence No. CL0705 General Disclosure BBY and its associates (as defined in Chapter 1 of the Corporations Act 2001), officers, directors, employees and agents, from time to time, may own or have positions in securities of the company(ies) covered in this report and may trade in the securities mentioned either as principal or agent or may be materially interested in such securities. BBY does and seeks to do business with companies covered in its research reports. As a result, investors should be aware that the firm may have a conflict of interest that could affect the objectivity of this report. Investors should consider this report as only a single factor in making their investment decision. Disclaimer & Warning This report may contain general advice or recommendations which, while believed to be accurate at the time of publication, are not appropriate for all persons or accounts. This report does not purport to contain all the information that a prospective investor may require. Before making an investment or trading decision, the recipient must consider Market developments subsequent to the date of this document, and whether the advice is appropriate in light of his or her financial circumstances or seek further advice on its appropriateness or should form his/her own independent view given the person’s investment objectives, financial situation and particular needs regarding any securities or Financial Products mentioned herein. Information in this document has been obtained from sources believed to be true but neither BBY nor its associates make any recommendation or warranty concerning the Financial Products or the accuracy, or reliability or completeness of the information or the performance of the companies referred to in this document. Past performance is not indicative of future performance. This document is not an offer, invitation, solicitation or recommendation with respect to the subscription for, purchase or sale of any Financial Product, and neither this document or anything in it shall form the basis of any contract or commitment. Although every attempt has been made to verify the accuracy of the information contained in the document, liability for any errors or omissions (except any statutory liability which cannot be excluded) is specifically excluded by BBY, its associates, officers, directors, employees and agents. The securities of such company(ies) may not be eligible for sale in all jurisdictions or to all categories of investors. Country specific disclosures US Investors: This material is intended for use by “major U.S. institutional investors” (as defined in Rule 15(a)-6 of the U.S. Securities Exchange Act of 1934, (SEA 1934)). Transactions by or on behalf of any “major U.S institutional investors” or “U.S institutional investors” (as defined in Rule 15(a)-6 of the SEA 1934 in any security mentioned in this document may only be effected through CIMB-GK Securities (USA) Inc, or Jefferies & Company, Inc. (“Jefferies”), U.S. registered broker dealers. The information upon which this material is based was obtained from sources believed to be reliable, but has not been independently verified. Therefore, its accuracy is not guaranteed. Additional and supporting information is available upon request. This is not an offer or solicitation of an offer to buy or sell any security or to make any investment. Any opinion or estimate constitutes the preparer's best judgement as of the date of preparation and is subject to change without notice. BBY or Jefferies, Jefferies International Limited or CIMB-GK Securities (USA) Inc, and their associates or affiliates, and their respective officers, directors and employees may buy or sell securities mentioned herein as agent or principal for their own account. United Kingdom: This report is issued and distributed by BBY (which is authorised and regulated by the Financial Services Authority (FSA) Registration No. 146367) only to persons falling within Articles 19 (5), 38, 47 and 49, of the Financial Services and Markets Act 2000 (Financial Promotion) Order 2005, (all such persons together being referred to as “relevant persons”). Directors, officers and employees of such entities are also included provided their responsibilities regarding those entitles involve engaging in investment activity. Persons who do not have professional experience relating to investments should not rely on this document. U.A.E: This report is prepared or published by BBY (Dubai) Ltd (BBYDL) which is regulated by the Dubai Financial Services Authority (DFSA). This document is intended only for Professional Clients and should not be relied upon or distributed to any other person. The writer of this document or a close relative may have a financial interest or material interest in any investment to which this document relates. BBYDL or its associate may hold 1% or more of the total issued share capital of any issuer referred to in this document. BBYDL or its associate may act as corporate broker for any issuer referred to herein. An issuer mentioned herein may have a material shareholding in BBYDL or its associate. BBYDL or its associate may have undertaken corporate finance business with or for any issuer mentioned herein over the past 12 months, and/or may undertake such business in the future. An associate of BBYDL may be a market maker in any investment referred to herein. Canada: The investments or investment services referred to in this document are available in Canada only to “Designated Institutions”, as defined by the Securities Act (Ontario). Analysts’ Compensation: the research analysts responsible for the preparation of this report receive compensation based upon various factors, including the quality and accuracy of the analyst(s) research, client evaluation feedback, independent survey rankings and overall firm revenues, which include revenues from, among other business units and corporate finance. Other International Investors: International investors outside the US, UK, UAE or Canada are encouraged to contact their local regulatory authorities to determine whether any restrictions apply to their ability to purchase this investment. Recipient Representations/Warranties: By accepting this report, the recipient represents and warrants that he or she is entitled to receive such report in accordance with the restrictions set out in this document and agrees to be bound by the limitations contained herein. Any failure to comply with these limitations may constitute a violation of law. Meanings of BBY Limited Ratings Buy – Describes stocks that we expect to provide a total return (price appreciation plus yield) of 15% or more within a 12-month period. Hold – Describes stocks that we expect to provide a total return (price appreciation plus yield) of plus or minus 15% within a 12-month period. Underperform – Describes stocks that we expect to provide a total negative return (price appreciation plus yield) of 15% or more within a 12-month period. NR – The investment rating and price target have been temporarily suspended. Such suspensions are in compliance with applicable regulations and/or BBY Limited policies. CS – Coverage Suspended. BBY Limited has suspended coverage of this company. Speculative Buy – Describes stocks we view with a positive bias, whose company fundamentals and financials are being monitored, but for which there is insufficient information for BBY Limited to assign a Buy, Hold or Underperform rating. Speculative Underperform – Describes stocks we view with a negative bias, whose company fundamentals and financials are being monitored, but for which there is insufficient information for BBY Limited to assign a Buy, Hold or Underperform rating. Monitor – Describes stocks whose company fundamentals and financials are being monitored, or for which no financial projections or opinions on the investment merits of the company are provided. Valuation Methodology BBY’s methodology for assigning ratings may include the following: market capitalisation, maturity, growth/value, volatility and expected total return over the next 12 months. The price targets are based on several methodologies, which may include, but are not restricted to, analyses of market risk, growth rate, revenue stream, discounted cash flow (DCF), EBITDA, EPS, cash flow (CF), free cash flow (FCF), EV/EBITDA, P/E, PE/growth, P/CF, P/FCF, premium (discount)/average group EV/EBITDA, premium (discount)/average group P/E, sum of parts, net asset value, dividend returns, and return on equity (ROE) over the next 12 months. © Copyright BBY Limited Approved for release by BBY Limited